First Quarter Fiscal 2021 Earnings Presentation - June 30, 2021 Gustavo Arnal, Executive Vice President, Chief Financial Officer - Seeking Alpha
←
→
Page content transcription
If your browser does not render page correctly, please read the page content below

First Quarter Fiscal 2021
                          Earnings Presentation
                               Mark Tritton, President & Chief Executive Officer
                    Gustavo Arnal, Executive Vice President, Chief Financial Officer

                                                          June 30, 2021

BED BATH & BEYOND                                                                      1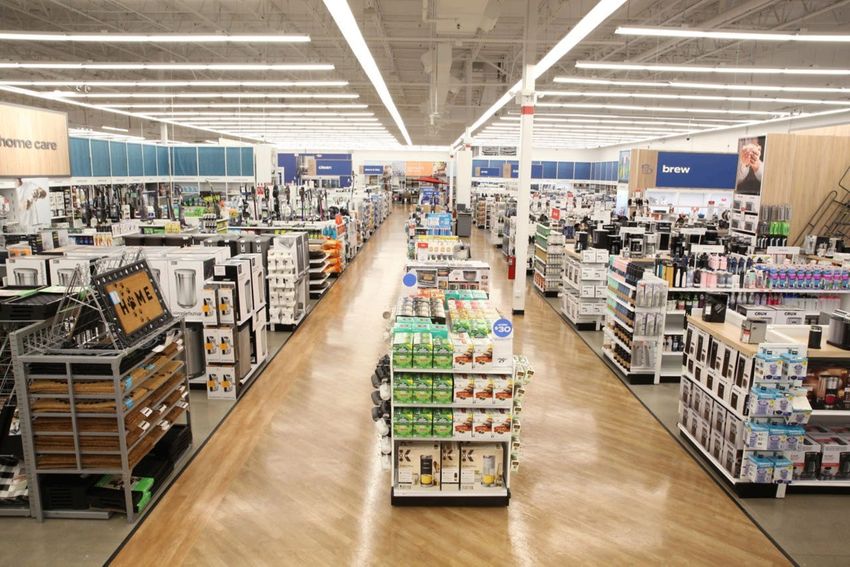
Forward Looking Statements
This presentation contains forward-looking statements within the meaning of Section 21 E of the Securities Exchange Act of 1934 including, but not limited to, the
Company’s progress and anticipated progress towards its long-term objectives, as well as more generally the status of its future liquidity and financial condition and its
outlook for the Company’s fiscal 2021 second quarter and for its 2021 fiscal year. Many of these forward-looking statements can be identified by use of words such as
may, will, expect, anticipate, approximate, estimate, assume, continue, model, project, plan, goal, preliminary, and similar words and phrases, although the absence of
those words does not necessarily mean that statements are not forward-looking. The Company’s actual results and future financial condition may differ materially from
those expressed in any such forward-looking statements as a result of many factors. Such factors include, without limitation: general economic conditions including the
housing market, a challenging overall macroeconomic environment and related changes in the retailing environment; risks associated with the COVID-19 pandemic and
the governmental responses to it, including its impacts across the Company’s businesses on demand and operations, as well as on the operations of the Company’s
suppliers and other business partners, and the effectiveness of the Company’s actions taken in response to these risks; consumer preferences, spending habits and
adoption of new technologies; demographics and other macroeconomic factors that may impact the level of spending for the types of merchandise sold by the
Company; civil disturbances and terrorist acts; unusual weather patterns and natural disasters; competition from existing and potential competitors across all channels;
pricing pressures; liquidity; the ability to achieve anticipated cost savings, and to not exceed anticipated costs, associated with organizational changes and investments,
including the Company’s strategic restructuring program and store network optimization strategies; the ability to attract and retain qualified employees in all areas of the
organization; the cost of labor, merchandise and other costs and expenses; potential supply chain disruption due to trade restrictions, and other factors such as natural
disasters, pandemics, including the COVID-19 pandemic, political instability, labor disturbances, product recalls, financial or operational instability of suppliers or carriers,
and other items; the ability to find suitable locations at acceptable occupancy costs and other terms to support the Company’s plans for new stores; the ability to
establish and profitably maintain the appropriate mix of digital and physical presence in the markets it serves; the ability to assess and implement technologies in support
of the Company’s development of its omnichannel capabilities; the ability to effectively and timely adjust the Company’s plans in the face of the rapidly changing retail
and economic environment, including in response to the COVID-19 pandemic; uncertainty in financial markets; volatility in the price of the Company’s common stock and
its effect, and the effect of other factors, including the COVID-19 pandemic, on the Company’s capital allocation strategy; risks associated with the ability to achieve a
successful outcome for the Company’s business concepts and to otherwise achieve its business strategies; the impact of intangible asset and other impairments;
disruptions to the Company’s information technology systems, including but not limited to security breaches of systems protecting consumer and employee
information or other types of cybercrimes or cybersecurity attacks; reputational risk arising from challenges to the Company’s or a third party product or service
supplier’s compliance with various laws, regulations or standards, including those related to labor, health, safety, privacy or the environment; reputational risk arising
from third-party merchandise or service vendor performance in direct home delivery or assembly of product for customers; changes to statutory, regulatory and legal
requirements, including without limitation proposed changes affecting international trade; changes to, or new, tax laws or interpretation of existing tax laws; new, or
developments in existing, litigation, claims or assessments; changes to, or new, accounting standards; and foreign currency exchange rate fluctuations. Except as
required by law, the Company does not undertake any obligation to update its forward-looking statements.

 BED BATH & BEYOND                                                                                                                                                                  2
Agenda
Q1’21 Results
Q2’21 & FY 2021 Outlook
Transformation Progress
Appendix
BED BATH & BEYOND 3
Q1’21 Results
Q1’21 RESULTS

  BED BATH & BEYOND   4

1Q’21 RESULTS
First Quarter Highlights
Results within or above Company’s previously provided Q1’21 outlook
Net Sales of $1.95 B
Core Sales increased +73%, above guidance of +65-70%
1
Comp Sales growth of +86% vs. Q1’20 and +3% versus Q1’19
2
Adjusted Gross Margin of 34.9%, above guidance of approx. 34%
2
Adjusted EBITDA of $86 M, within guidance range of $80 M - $90 M
Successfully launched Owned Brands: Nestwell, Haven and Simply Essential
Next three Owned Brands slated for launch ahead of schedule
BED BATH & BEYOND 5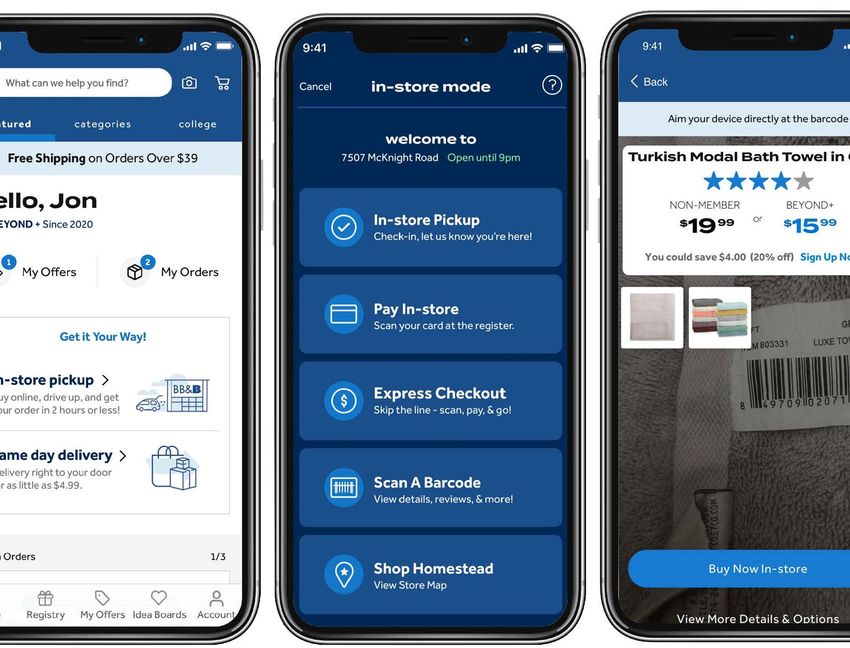
1Q’21 RESULTS

  First Quarter Results – Sales & P&L

                                   Net Sales                                                   Core Banner Growth           Comp Sales1
                      $1.95 Billion                                                                   +73% vs. Q1’20      +86% vs. Q1’20
                                 [+49% vs. Q1’20]                                                                            [+3% vs. Q1’19]

                                                                               2
                      Adj. Gross Margin                                                                               2
                                                                                                            Adj. EBITDA
                                                                                                                                               2
                                                                                                                          Adj. Diluted EPS
                                    34.9%                                                            $86 Million             $0.05
                             [+820bps vs. Q1’20]
                              [+40bps vs. Q1’19]

Note: The Company’s four Core banners include Bed Bath & Beyond, buybuy BABY, Harmon Face Values and Decorist.

      BED BATH & BEYOND                                                                                                                            6
1Q’21 RESULTS

  Total Net Sales to Comparable Sales – Q1’21 vs. Q1’20
  •      Total Net Sales growth of +49% includes:
         •     planned reduction from non-core banner divestitures of -24%

  •      Core banner net sales growth of +73% includes:
         •     planned reduction from fleet optimization activity of -13%

  •      Comparable1 sales growth of 86%
                                                                                                                                    -13%        86%
                                                                                                                                    Fleet
                                                                                      -24%                         73%           Optimization   Comp
                                                                                                                                                Sales
                                                                                  Divestitures                     Core
                                                                                                                  Banner
                                            49%                                                                  Net Sales
                                                                                                                    (excl.
                                         Total Net                                                               Divestitures)

                                           Sales

Note: The Company’s four Core banners include Bed Bath & Beyond, buybuy BABY, Harmon Face Values and Decorist.

      BED BATH & BEYOND                                                                                                                                 7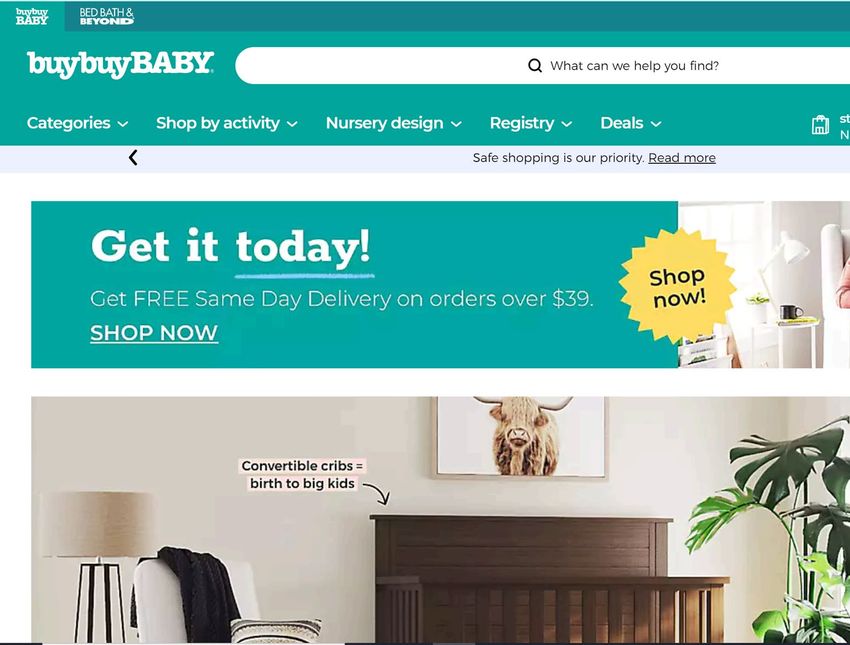
1Q’21 RESULTS

  Total Net Sales to Comparable Sales – Q1’21 vs. Q1’19
  •      Total Net Sales of -24% includes:
         •     planned reduction from non-core banner divestitures of -18%

  •      Core banner net sales of -6% includes:
         •     planned reduction from fleet optimization activity of 9%

  •      Comparable sales growth of 3% (digital +84%; stores -20%)
                                                                                                                                           -9%            3%
                                              -24%                                                                       -6%               Fleet       Comp Sales
                                                                                                                                        Optimization
                                          Total                                                                  Core Banner
                                                                                      -18%                        Net Sales
                                         Net Sales                                                               (excl. Divestitures)

                                                                                  Divestitures

Note: The Company’s four Core banners include Bed Bath & Beyond, buybuy BABY, Harmon Face Values and Decorist.

      BED BATH & BEYOND                                                                                                                                             8
1Q’21 RESULTS

Key Drivers of Sales Growth
                                 Core Sales Comp Sales
                                  vs Q1’20   vs. Q1’19                     Increased Digital
                                                                             Penetration
Total Enterprise
                                  +73%        +3%
                                                                                           Q1'21
   Bed Bath & Beyond Banner                                                                38%
                                  +96%        +3%
                                                                                          Q1’20*
                                                                                           66%
                                                         % of Net                          Q1'19
Top 5 Destination Categories     Core Sales Comp Sales
                                                          Sales                            20%
at Bed Bath & Beyond Banner       vs Q1’20   vs. Q1’19   in Q1’21
                                                                                           Q1'18
  Bedding                          +128%       +6%         18%                             18%

  Bath                             +147%       -1%         10%

  Kitchen Food Prep                +59%       +15%         21%

  Indoor Décor                     +112%       +1%         9%

  Home Organization                +127%       +5%         6%

Destination Category              +100%       +7%         65%

Other Categories                   +88%        flat       35%

Total Bed Bath & Beyond Banner    +96%        +3%         100%
                                                                    *Operated mainly as a digital business in Q1’20 due to
                                                                          store closures as a result of COVID-19

BED BATH & BEYOND                                                                                                            9
1Q’21 RESULTS

  Gross Margin Bridge – Q1’20 to Q1’21
  Q1’21 total enterprise gross margin expansion of +820 bps from product mix improvement due to
  Owned Brands penetration, cost savings/ leverage from higher sales and improved channel mix

                                                                               290bps          34.9%
                                                                           Channel Mix / DTC
                                                                           Shipping Expense
                                                             240bps
                                                                                                Q1'21
                                            290bps
                                                          Cost Savings /
                                                            Leverage
                                                                                               Gross
                                                                                               Margin
                             26.7%          Product Mix

                             Q1'20
                             Gross
                             Margin

Note: numbers may not add due to rounding

      BED BATH & BEYOND                                                                                 10
1Q’21 RESULTS
Strong Cash & Liquidity
Total Liquidity
4
of $1.9B
ABL
No Net Debt
$0.7B
Q4'20 Total
3
Cash & Free Cash Flow
Cash Flow used
Investments
-$0.1B in Financing Q1'21 Total Total Cash & Bonds
$1.4B -$0.1B Cash & Investments
$1.2B
Investments
$1.2B
$1.2B
share repurchases
$130M in Q1’21
BED BATH & BEYOND 11FINANCIAL OUTLOOK BED BATH & BEYOND 12
FINANCIAL OUTLOOK
Second Quarter Fiscal 2021 Outlook
Q2’21
Sales $2.04 B - $2.08 B
Comp Sales +low single-digits
P&L Adjusted Gross Margin 35.0% - 36.0%
Adjusted EBITDA $150 M - $160 M
Adjusted EPS Range $0.48 - $0.55
Key Considerations:
July and August are important sales periods (i.e. Independence Day and Back-to-College)
Depreciation & Amortization: $63 M - $65 M
Interest Expense: approx. $16 M
Tax Rate: 26% - 28% (excluding discrete items)
Weighted Average Share Count: approx. 105 M
Note: Adj. gross margin, adj, EBITDA & adj. EPS are non-GAAP financial measures. For a reconciliation to comparable GAAP measures, see Appendix of this presentation.
BED BATH & BEYOND 13FINANCIAL OUTLOOK
Raising Full Year Fiscal 2021 Outlook
FULL YEAR FISCAL 2021
CURRENT PRIOR CHANGE
Sales $8.2 B - $8.4 B $8.0B - $8.2B Increased
Comp Sales (Q2’21 – Q4’21) +low single-digit growth flat Increased
Adjusted Gross Margin Approx. 35% Approx. 35% Reaffirmed
P&L (as a percentage of sales)
Adjusted SG&A Approx. 31% Approx. 31% Reaffirmed
(as a percentage of sales)
Adjusted EBITDA $520 M - $540 M $500M - $525M Increased
Adjusted EPS Range $1.40 - $1.55 NM Initial
Key Considerations:
Depreciation & Amortization: approx. $250 M [updated]
Interest Expense: approx. $63 M - $65 M
Tax Rate: 26% - 28% (excluding discrete items)
Weighted Average Share Count: approx. 105 M
Note: Adj. gross margin, adj. SG&A, adj, EBITDA & adj. EPS are non-GAAP financial measures. For a reconciliation to comparable GAAP measures, see Appendix of this presentation.
BED BATH & BEYOND 14FINANCIAL OUTLOOK
Full Year Fiscal 2021 Outlook – Capital Allocation
FULL YEAR FISCAL 2021
CURRENT PRIOR CHANGE
CAPEX Approx. $400 M Approx. $400 M Reaffirmed
CAPITAL
Reaffirmed
6
ALLOCATION Gross Debt-to-EBITDA Ratio Faster Improvement toFINANCIAL OUTLOOK
Portfolio & Financial Transformation
2019 2021
Net Sales
non-core banner divestitures &
Net Sales of $11B store fleet optimization
$8.2B to $8.4B
[Core Net Sales of $9B] with +low single-digit
comp. growth (Q2’21-Q4’21)
Adj. Gross Margin Adj. Gross Margin
up approx. 200 bps
approx. 33% approx. 35%
Adj. EBITDA $465M Adj. EBITDA
up +25%
[Core EBITDA $425M] $520M to $540M
EPS EPS
≥3x higher
$0.46 $1.40 to $1.55
Approx. 126 million >20% reduction through share Approx. 100 million*
ending total shares repurchases; total of $700M ending total shares
*Represents total, ending shares outstanding available for share repurchases. The Company has guided to WEIGHTED AVERAGE SHARES of approximately 105 M related to its FY 2021 EPS guidance. Please refer to slides 13 and 14 for additional details.
Note: Adj. gross margin, adj. SG&A, adj, EBITDA & adj. EPS are non-GAAP financial measures. For a reconciliation to comparable GAAP measures, see Appendix of this presentation.
BED BATH & BEYOND 16TRANSFORMATION UPDATE BED BATH & BEYOND 17
TRANSFORMATION UPDATE

Launched Significant TRANSFORMATION with pivot in 2020

BED BATH & BEYOND                                        18
TRANSFORMATION UPDATE
Key Strategic Initiatives on-track
3-Year Strategic Fiscal Year 2021
(Year 1) of Q1’21 Snapshot
Plan Transformation
Expanded same-day delivery
Digital-First, Stores as fulfillment hubs Invest in key projects for
services via DoorDash
Omni-Always Omni-always platform enhanced capabilities on-track
Mobile app enhancements
Approx. 130 to 150 remodels Initiated 26 BBB remodels
Store Remodel Remodel ~450 BBB stores
Approx. 200 BBB closures Closed 16 BBB stores (160
& Fleet Optimization Close ~ 200 BBB stores on-track
(cumulative) cumulative)
commercial
Inspirational Launch 10 BBB Owned Brands Introduce 8 Owned Brands
merchandising Launched 3 Owned Brands
Owned Brand penetration of Launch 6 Owned Brands in 1H21
assortment including on-track Penetration approx. 2x FY20
30% Owned brand penetration of 20%
Owned Brands
Continued positive comp
Accelerate growth of Modernize destination
sales growth
buybuy BABY & Increase BABY sales to $1.5B+ categories & extend value prop
on-track Digital penetration of 55%
Harmon Banners Age up strategy
at BABY
Reduce store replenishment to
operational
Plan and begin implementation of On track for NE RDC
Modernize supply 10 days (via RDCs)
two RDCs in NE/West Began IT testing and data
chain and technology New tech roadmap (merch, on-track
Initiate new Oracle ERP rollout migration
ERP & supply chain)
BED BATH & BEYOND 19TRANSFORMATION UPDATE
Digital Transformation
Three Pillars of Transformation
38% Digital Sales penetration
ELEVATE EXPERIENCE: Overhauled
websites with new look, reduced
steps to checkout and AI-powered
more than
Visits to websites
search
200 million
approximately
UNLOCK OMNI-ALWAYS: launched App launches
BOPIS & curbside pickup services
16.4 million
approximately
First-time app visitors
500 thousand
TRANSFORM TO DIGITAL FIRST:
Upgraded tools and processes to
improve speed to market 50 % of Omni + Digital shoppers
customers
Note: App data (launches and first-time visitors) relates to Bed Bath & Beyond banner only
BED BATH & BEYONDTRANSFORMATION UPDATE
Store Remodels
BEFORE
• Initiated 26 store remodels
Q1’21 (after refreshing most stores LY)
• Initial output of sales
Progress exceed estimates
AFTER
• Expecting to remodel
FY 2021 approx. 130 to 150 stores
across US & CAN)
BED BATH & BEYOND 21TRANSFORMATION UPDATE
Store Fleet Optimization
Continuing to position our network for
the future:
• 16 store closures during
Disciplined management of Q1’21 the quarter
inventory and receipts Progress • Total of 160 store closures
through Q1’21
Partnership with recognized
liquidation service
• Expecting to close approx.
Robust in-store and digital local FY 2021 200 stores through FY21
marketing
Data-driven tracking and monitoring
BED BATH & BEYOND 22TRANSFORMATION UPDATE
Assortment Progress: Launched 3 New Owned Brands in Q1’21
Launched March 2021 Launched April 2021 Launched May 2021
everyday comfort Escape the noise Home starts here
BED BATH & BEYOND 23Owned Brands Sales Penetration
• Ahead of schedule to reach our Full Fiscal Year 2021 Owned Brands penetration goal
FY 2020 Q1’21 FY 2021 FY 2023
approx. achieved run rate of GOAL OF
10% high-teens
percentage 20% 30%
BED BATH & BEYOND 24TRANSFORMATION UPDATE
Launching Next 3 New Owned Brands Ahead of Schedule
Launched June 2021 Launched June 2021 Launching July 2021
Start with food. End with love. Bring your story to life Solutions for a well-kept home
BED BATH & BEYOND 25OPERATIONS UPDATE
Continued Growth in buybuy Baby Banner
#1
specialty baby
greater than
retailer in Positive Net Sales growth
markets with a
presence
20% vs. Q1’20
#5 55% Digital penetration driven by
BOPIS orders
retailer in
baby registry
nationally
BED BATH & BEYOND 26OPERATIONS UPDATE
Supply Chain and Technology
PRIOR Q1’21 FUTURE
STATE PROGRESS STATE
Delivering Value
35-day store
replenishment 10-day store
Increased digital capabilities Vendor direct
Addressed first
step of our store replenishment
SUPPLY
CHAIN
network with fulfillment strategy 4 regional DCs
consolidation hubs Selected NE DC Increased
FUTURE
Flexibility, agility and scalability Inefficiencies location standardization
STATE to
driving high, West DC plans lower total supply
uncompetitive underway chain costs
Speed to market costs
More efficient technology
RELEX system
operations
TECHNOLOGY
Disparate legacy
implementation Cloud-based and
technology
underway scalable
Legacy and siloed
Phase 1 of Oracle infrastructure
Shift spend towards innovation architecture and
applications
ERP design New ERP
complete Automated and
Reactive and
Phase 2 of Oracle agile operating
manually intensive
Improved return on technology operating model
ERP design
underway
model
investment
BED BATH & BEYOND 27TRANSFORMATION UPDATE Unlocking a Virtuous Cycle to Drive Sustainable Value Creation BED BATH & BEYOND 28
TRANSFORMATION UPDATE

   Building a Positive Track Record of Performance – Comp Sales
                                                                                                                        >35% Digital Penetration
                                                                                                                          +80% Digital Growth

                                                                                                                                                    86%
                                                                                                                                                     vs.
                                                                                                                                                    Q1’20

                                                                                                                                6%
TRANSFORMATION UPDATE
Building a Positive Track Record of Performance – Gross Margin
38.0%
36.0%
35.0% Continued
34.1% Gross Margin
Expansion
33.3% 33.6%
FY 2017 FY 2018 FY 2019 FY 2020 FY 2021E FY 2022E FY 2023E
BED BATH & BEYOND 30TRANSFORMATION UPDATE
Shareholder Value Creation Through Capital Deployment
approx. $1 billion cumulative share repurchases
$400
$350 $600M cash in-flow from divestitures $375M total of
$325M
$300
more than $500M repurchased through Q1’21
$250
$225M
Leverage ofWHO WE ARE Investing in What We Believe In Our Commitments People: Become a Top 10 Retail Employer by 2030 by creating an equitable, inclusive work environment where all our people feel at home and can thrive Community: Donate $1 billion in products, 2 million volunteer hours by 2030 to help provide the safety and sense of home to our neighbors Planet: Lead by example to build a better home for the next generation by becoming Net Zero by 2040, and offering more access to sustainable products BED BATH & BEYOND 32
WHO WE ARE
Investment Thesis
Turnaround story with significant potential for sustainable
financial results
Sales acceleration through assortment curation, the addition of
owned brands and a digital-first mindset
Enhancing gross margin & EBITDA through product mix, pricing
and operational efficiencies
Strong balance sheet and consistent cash flow generation
Capital allocation focused on shareholder return
BED BATH & BEYOND 33APPENDIX BED BATH & BEYOND 34
APPENDIX

     Quarterly Summary of FY2019 & FY2020 Net Sales
     •     The following table shows a quarterly summary of the Company’s fiscal 2019 and 2020 net sales on both a
           Reported GAAP basis and on a Core Go-Forward basis, which excludes sales from divested banners.

     •     The Company is providing this additional transparency to help analysts and investors gain further perspective on
           the Company’s recent portfolio transformation and the quarterly comparisons of the Core Go-Forward banners, which
           include Bed Bath & Beyond, buybuy BABY, Harmon Face Values and Decorist.

         Net Sales                          Q1’19    Q2’19    Q3’19    Q4’19
                                                                                  FY
                                                                                          Q1’20    Q2’20    Q3’20    Q4’20
                                                                                                                               FY
         ($ in millions)                                                         2019                                         2020

         Reported                           $2,573   $2,719   $2,759   $3,107   $11,159   $1,307   $2,688   $2,618   $2,619   $9,233
         Core                               $2,080   $2,263   $2,191   $2,471   $9,006    $1,128   $2,239   $2,186   $2,390   $7,943

Note: numbers may not add due to rounding

      BED BATH & BEYOND                                                                                                                35
Non-GAAP Information
This presentation contains certain non-GAAP information, including adjusted earnings before interest, income taxes, depreciation and amortization ("EBITDA"), adjusted
EBITDA margin, adjusted gross margin, adjusted SG&A, adjusted net earnings per diluted share, and free cash flow. Non-GAAP information is intended to provide
visibility into the Company’s core operations and excludes special items, including non-cash impairment charges related to certain store-level assets and tradenames,
loss on sale of businesses, loss on the extinguishment of debt, charges recorded in connection with the restructuring and transformation initiatives, which includes
accelerated markdowns and inventory reserves related to the planned assortment transition to Owned Brands and costs associated with store closures related to the
Company's fleet optimization and the income tax impact of these items. The Company’s definition and calculation of non-GAAP measures may differ from that of other
companies. Non-GAAP financial measures should be viewed in addition to, and not as an alternative for, the Company’s reported GAAP financial results. For a
reconciliation to the most directly comparable US GAAP measures and certain information relating to the Company’s use of Non-GAAP financial measures, see “Non-
GAAP Financial Measures” below.
Footnotes
1 The Company notes that first quarter growth rates in fiscal 2021 are not fully comparable due to last year’s extended store closures related to the COVID-19 pandemic.
Therefore, Comparable Sales Growth for the three months ended May 29, 2021 has been calculated by adjusting Core Sales for the estimated negative impact on 2021
sales of the store closures in fiscal 2020 as part of the Company's fleet optimization program. The Company estimates that the stores closed in 2020 as part of this fleet
optimization program would have contributed approximately 13% to Core Sales in the first quarter of fiscal 2021. The Company believes this calculation of comparable
sales is a more meaningful reference for the current quarter.
2 Adjusted items refer to comparable sales as well as financial measures that are derived from measures calculated in accordance with GAAP, which have been adjusted to
exclude certain items. Adjusted Gross Margin, Adjusted SG&A, Adjusted EBITDA, Adjusted EBITDA Margin, and Adjusted Diluted EPS are non-GAAP financial measures.
For more information about non-GAAP financial measures, see “Non-GAAP Information” below.
3 Free Cash Flow is defined as operating cash flow less capital expenditures.
4 Total Liquidity includes cash & investments and availability under the Company’s asset-based revolving credit facility.
5 Leverage ratio calculated using Moody's gross debt/EBITDA ratios.
BED BATH & BEYOND 36APPENDIX Q1’21 Non-GAAP Reconciliation BED BATH & BEYOND 37
APPENDIX

Q1’20 Non-GAAP Reconciliation

BED BATH & BEYOND               38
First Quarter Fiscal 2021
                          Earnings Presentation
                               Mark Tritton, President & Chief Executive Officer
                    Gustavo Arnal, Executive Vice President, Chief Financial Officer

                                                          June 30, 2021

BED BATH & BEYOND                                                                  39
You can also read