First Quarter of Fiscal 2018 Supplementary Material
←
→
Page content transcription
If your browser does not render page correctly, please read the page content below

First Quarter of Fiscal 2018
                                                Supplementary Material
                                                POLA ORBIS HOLDINGS INC.
                                                Director and Vice President
                                                Management Planning, IT, HR and
                                                Group International Business
                                                Naoki Kume

This report contains projections of performance and other projections based on information currently available
and certain assumptions judged to be reasonable. Actual performance may differ materially from these projections
resulting from changes in the economic environment and other risks and uncertainties.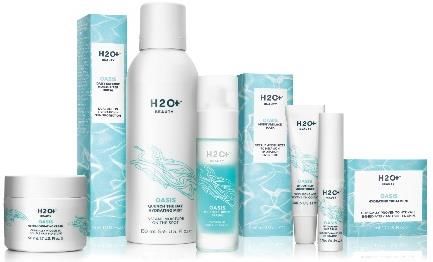
1.   Highlights of Consolidated Performance
2.   Segment Analysis
3.   Forecasts for Fiscal 2018
4.   Initiatives Going Forward & Appendices

                                              1
Q1 Key Topics
Cosmetics Market
Japanese cosmetics market overall showed steady growth. However, pure domestic market, excluding
inbound demand seemed to be flat year-on-year.*
By price range, high prestige remained steady.
As for inbound market, the market overall continued to grow backed up by the increasing number of tourists
visiting Japan, but the growth rate of the average spending price has slowed down slightly.
*Source: Ministry of Economy, Trade and Industry, Japan Department Stores Association, Ministry of Internal Affairs and Communications, Intage SLI.
Our Group
The Group achieved increases in sales and operating income on a consolidated basis, driven by POLA and
brands under development.
For POLA, thanks to the customer base expanded during last year, the brand achieved increases in sales
and operating income year-on-year, in spite of the high performance recorded in the first quarter of last year.
ORBIS is currently implementing structural reforms; sales ratio of mainstay skincare series improved but
the sales decreased due to the decreased number of customers.
Jurlique maintained its performance flat year-on-year due to strengthened investments for branding.
Sales dropped at H2O PLUS as a result of selection and integration of sales channels.
THREE and DECENCIA from brands under development maintained their momentum.
Updates on Inbound Sales (Consolidated)
FY2016 (full-year) : Approximately 6% of consolidated net sales
↓
FY2017 (full-year) : Approximately 7% of consolidated net sales
↓
FY2018 Q1 : Approximately 7% of consolidated net sales
2
Analysis of Consolidated P&L Changes
Net Sales to Operating Income
FY2017 FY2018 YoY Change
(mil. yen) Q1 Results Q1 Results Amount %
Consolidated net sales 56,074 59,526 3,452 6.2%
Cost of sales 9,320 9,445 124 1.3%
Gross profit 46,753 50,081 3,327 7.1%
SG&A* expenses 37,626 40,137 2,511 6.7%
Operating income 9,127 9,943 816 8.9%
*Selling, General and Administrative Expenses
Key Factors
Consol. net sales Sales were very strong driven by POLA, especially from existing customers which
the brand successfully expanded its customer base during last year.
On the other hand at ORBIS, sales did not recover but the sales from new customers
increased year-on-year thanks to the promotion centered on ORBIS=U.
Cost of sales Cost of sales ratio was improved owing to increase in sales compound ratio of
high-prestige products under POLA brand.
Cost of sale ratio 2017Q1 : 16.62% ⇒ 2018Q1: 15.87%
SG&A expenses Labor expenses : up ¥282 mil. YoY
Sales commissions : up ¥1,066 mil. YoY
-> resulted from increase in sales at POLA. Commission ratio within POLA has improved.
Sales related expenses : up ¥611 mil. YoY
-> resulted from costs for customer structure reforms at ORBIS.
Administrative expenses : up ¥551 mil. YoY
-> resulted from costs for launching new brands.
Operating income Beauty care : up ¥879 mil. YoY
3
Analysis of Consolidated P&L Changes
Operating Income to Profit Attributable to Owners of Parent
FY2017 FY2018 YoY Change
(mil. yen) Q1 Results Q1 Results Amount %
Operating income 9,127 9,943 816 8.9%
Non-operating income 107 155 48 44.5%
Non-operating expenses 279 638 359 128.4%
Ordinary income 8,955 9,460 505 5.6%
Extraordinary income 7 26 19 252.2%
Extraordinary loss 128 19 (108) (84.5%)
Profit before income taxes 8,834 9,467 633 7.2%
Income taxes 3,056 3,063 6 0.2%
Profit attributable to non-
controlling interests
0 (2) (2) -
Profit attributable to owners
of parent
5,777 6,406 628 10.9%
Key Factors
Non-operating expenses : Loss from unfavorable foreign exchanges ¥600 mil.
Income taxes : Lowered effective tax rate as a result of reduction of losses in overseas
business (Effective tax rate = 32.4%)
4Factors Impacting Profit Attributable to Owners of Parent
Profit attributable to owners of parent was up 10.9% yoy
due to increase in gross margin and improvement in profit structure
Positive impact Negative impact
(mil. yen) Increase in sales at
POLA brand
Costs for customer
10,000 structure reform at ORBIS
449
282 1,066
8,000
2,878 611
551 128 6,406
6,000
5,777 4
Increase in commissions in association with 311
sales increase at POLA brand
(Commission rate was improved)
4,000
Costs for launching
New brands
2,000
0
FY2017 Q1 Increase Improved Labor Sales Sales- Admin. Non- Extra- Income FY2018 Q1
Profit in cost of expenses commissions related expenses operating ordinary taxes, Profit
attributable gross sales expenses income income etc. attributable
to owners profit ratio and loss and loss to owners
of parent of parent
51. Highlights of Consolidated Performance
2. Segment Analysis
3. Forecasts for Fiscal 2018
4. Initiatives Going Forward & Appendices
6Segment Results
FY2017 FY2018 YoY Change
(mil yen) Q1 Results Q1 Results Amount %
Consolidated net sales 56,074 59,526 3,452 6.2%
Beauty care 52,345 55,821 3,476 6.6%
Real estate 675 676 1 0.2%
Others 3,053 3,028 (25) (0.8%)
Operating income 9,127 9,943 816 8.9%
Beauty care 8,790 9,670 879 10.0%
Real estate 334 312 (21) (6.5%)
Others (10) 74 85 -
Reconciliations 13 (113) (126) -
Segment Results Summary
Beauty care Sales grew driven by POLA.
Operating income rose 10% thanks to sales increase at POLA and COGS improvement.
Real estate Occupancy rate has been maintained at a high level. However, temporary maintenance expenses
were incurred.
Others At pharmaceutical business, sales increased year-on-year by concentrating sales and promotion
resources on mainstay products.
At building maintenance business, sales dropped due to staffing shortages.
7Beauty Care Business Results by Brands
FY2017 FY2018 YoY Change
(mil. yen) Q1 Results Q1 Results Amount %
Beauty care net sales 52,345 55,821 3,476 6.6%
POLA 33,126 36,164 3,037 9.2%
ORBIS 12,760 12,475 (284) (2.2%)
Jurlique 2,603 2,599 (3) (0.1%)
H2O PLUS 635 517 (118) (18.6%)
Brands under
development
3,220 4,065 844 26.2%
Beauty care
operating income
8,790 9,670 879 10.0%
POLA 6,794 7,693 899 13.2%
ORBIS 2,626 2,466 (160) (6.1%)
Jurlique (695) (775) (79) -
H2O PLUS (180) (157) 22 -
Brands under
development
245 443 197 80.6%
Note: Consolidated operating income and loss for each brand are shown for reference purpose only (figures are unaudited)
8Brand Analysis (1)
Q1 Result Topics
The number of existing customer grew. Renewed “White Shot”,
New whitening products are strong. the whitening series.
Entered into Korean duty-free store market.(January) “MAQUIA Whitening & UV Grand-Prix”
Inbound ratio was approximately 11%. - Best of best whitening awards (left two)
- Whitening inner care awards #1 (right)
Q1 Results (mil. yen) YoY Change Quarterly net sales (mil. yen)
Net sales 36,164 9.2%
40,000 36,164
Operating income 7,693 13.2% 33,126
30,000
Key indicators 25,134
Number of sales offices (vs. Dec. 2017) 4,135 20,000
(down 15)
Number of PB(1) (vs. Dec. 2017) 658 (up 2) 10,000
Cosmetics sales ratio PB(1) 39.6%
0
Esthe-inn 47.6% 2016 1Q 2017 1Q 2018 1Q
D2D(2) and other 12.8% Quarterly operating income (mil. yen)
Sales growth* PB up 4.9%
10,000
PB (like-for-like) up 4.8% 7,693
8,000 6,794
Esthe-inn up 5.9%
6,000
D2D up 1.5%
Purchase per customer* down 4.6% 4,000
2,305
Number of new customers* down 12.2% 2,000
Growth rate of overseas sales up 156.6% 0
2016 1Q 2017 1Q 2018 1Q
(1) PB: POLA THE BEAUTY stores (2) D2D: Conventional door-to-door *YoY 9Brand Analysis (2)
Q1 Result Topics
Developed promotions centered on “ORBIS=U”. Initiatives for
Purchase price per customer recovered at the same unified design
level as the first quarter of last year. However, the across the brand
number of customers decreased.
Focused on acquisition of customers with potential
of high lifetime value in ORBIS. Its result started to
appear in a leading indicator. Quarterly net sales (mil. yen)
(# of customers purchased mainstay skincare product series)
20,000
Q1 Results (mil. yen) YoY change
Net sales 12,475 (2.2%) 15,000 13,572 12,760 12,475
Operating income 2,466 (6.1%)
10,000
Key indicators
5,000
Sales ratio Online 47.2%
Other mail-order 24.5% 0
2016 1Q 2017 1Q 2018 1Q
Stores and overseas 28.3%
Quarterly operating income (mil. yen)
Sales increase* Online up 1.0%
Other mail-order down 12.0% 4,000
Stores and overseas up 0.8% 3,000 2,655 2,626 2,466
(1)
Mail-order purchase per customer* up 0.3%
2,000
(1)
Number of mail-order customers* down 4.1%
1,000
Number of customers purchased mainstay
up 11.2%
skincare product series*(2)
0
(1) Mail-order includes online and other mail-order * YoY basis 2016 1Q 2017 1Q 2018 1Q
(2) For last 6 months period 10Brand Analysis (3)
Q1 Result Topics
Sales increased by 1% yoy (on AUD basis). Reinforce brand
By region, sales grew at China, Hong Kong and duty- communication as a premium
free markets. natural skincare brand
Operating income dropped due to strengthened
investments in branding.
Q1 Results (mil. yen) YoY change(1) Quarterly net sales (mil. yen)
Net sales 2,599 (0.1%) 4,500
Operating income (760) (79) 3,369
(before goodwill amortization)
3,000 2,603 2,599
Operating income (775) (79)
Key indicators
Number of doors in China (vs. Dec. 2017) 104 (down 6) 1,500
Sales ratio China 19%
Hong Kong 14% 0
2016 1Q 2017 1Q 2018 1Q
Duty free 17%
Australia 26% Quarterly operating income (mil. yen)
Sales growth(2) China up 0% 2016 1Q 2017 1Q 2018 1Q
0
Hong Kong up 4%
Duty free up 13%
-500
Australia down 13%
(1) For operating income YoY difference is shown in amount (mil. yen). -695
-1,000 -775
(2) AUD basis, YoY -893
-1,500
11Brand Analysis (4)
Q1 Result Topics
Sales were down year-on-year in North America due
Implemented management
to reduction in sales channels.
changes and kicked-off for
Strengthened communication with existing retailers
brand revitalization
and implement marketing strategies focused on
hero products development. (OASIS series) OASIS series
Quarterly net sales (mil. yen)
Q1 Results (mil. yen) YoY change(1)
1,500
Net sales 517 (18.6%)
Operating income (157) 22
1,000
Key indicators
635
Sales ratio North America 88% 510 517
500
Others 12%
Sales growth(2) North America down 9%
0
Others down 42% 2016 1Q 2017 1Q 2018 1Q
(1) For operating income YoY difference is shown in amount (mil. yen) Quarterly operating income (mil. yen)
(2) USD basis, YoY
2016 1Q 2017 1Q 2018 1Q
0
-250 -180 -157
-500
-519
-750
-1,000
12Brand Analysis (5) Brands Under Development
Q1 Result Topics
At THREE, sales especially from existing customers
New products from THREE
were strong. Holistic care products contributed to
and DECENCIA
the sales. From left:
Costs for launching new brands amounted to THREE new base makeup
approximately ¥150 mil. THREE “THREE” series
Whitening product series was revamped at DECENCIA “saeru” series
DECENCIA, which showed 20% of sales growth. Quarterly net sales (mil. yen)
Q1 Results (mil. yen) YoY change
4,500 4,065
Net sales 4,065 26.2%
3,567
Operating income 443 80.6% 3,220
3,000
ACRO Net sales 2,313 27.6%
ACRO OP income 175 (25.6%)
1,500
(THREE Net sales) 2,313 27.6%
(THREE OP income) 321 36.3%
0
Key indicators 2016 1Q 2017 1Q 2018 1Q
THREE Dept. store counters in Japan 38 Quarterly operating income (mil. yen)
Other stores in Japan 65
Overseas stores (in 7 countries & regions) 37 500 443
Overseas sales ratio 20% 400
■ Brand Portfolio of Brands Under Development
300 254 245
Company ACRO INC. DECENCIA INC. 200
100
Brand
New Brands 0
2016 1Q 2017 1Q 2018 1Q
Note: Apart from the portfolio above, Brands Under Development includes OEM business. 131. Highlights of Consolidated Performance
2. Segment Analysis
3. Forecasts for Fiscal 2018
4. Initiatives Going Forward & Appendices
14Forecasts for FY2018 (No Change)
FY2018 YoY Change FY2018 YoY Change
(mil. yen) H1 Plan Amount % Full-year Plan Amount %
Consol. net sales 121,000 3,621 3.1% 253,000 8,664 3.5%
Beauty care 112,900 3,596 3.3% 235,800 8,666 3.8%
Real estate 1,300 (48) (3.6%) 2,600 (94) (3.5%)
Others 6,800 73 1.1% 14,600 92 0.6%
OP income 19,600 (1,344) (6.4%) 41,500 2,618 6.7%
Beauty care 19,200 (895) (4.5%) 40,700 2,578 6.8%
Real estate 500 (92) (15.7%) 900 (182) (16.9%)
Others 150 (15) (9.2%) 300 614 -
Reconciliations (250) (341) - (400) (391) -
Ordinary income 19,600 (1,344) (6.4%) 41,500 2,249 5.7%
Net income
attributable to owners 13,000 (955) (6.8%) 28,000 862 3.2%
of parent
【Assumed exchange rates】
【Assumptions behind the plan】
1.00 AUD = 88 JPY(PY 86.00)
- Inbound sales : approximately ¥17,500 mil. (almost same level as last year) 1.00 USD = 110JPY (PY112.18)
- Sales of Wrinkle Shot Serum : ¥10,000 mil. 1.00 CNY = 17 JPY(PY 16.62)
FY2017 FY2018 (plan)
Shareholder Annual ¥70 Annual ¥80 (Interim ¥35, Year-end ¥45)
returns Consol. payout ratio 57.1% Consol. payout ratio 63.2%
Capital
investment
¥8,885 million ¥8,000 ~ 9,000 million
Depreciation
¥6,551 million ¥7,000 ~ 8,000 million
151. Highlights of Consolidated Performance
2. Segment Analysis
3. Forecasts for Fiscal 2018
4. Initiatives Going Forward & Appendices
16Initiatives for 2018 onward
■ Sustain stable growth of flagship brands to lead Group earnings
Launch Wrinkle Shot overseas (see next page for details)
Introduce seasonal promotions for new whitening products
and cross-sells through Wrinkle Shot
Accelerate overseas store openings
(Open four new stores in Beijing, Shanghai and Hong Kong by April)
POLA
Reinforce communication through “ORBIS=U” (left) WHITISSIMO UV Block Shield White Plus
Concentrate resources on targeted customer acquisition (right) Wrinkle Shot Season Special Kit
■ Bring overseas operations solidly into the black overall
Constantly launch new products
Develop unified branding at every customer touchpoint
Focus on main products and main retailers in view of
Jurlique
investment efficiency
New Cleansing Line
■ Expand brands under development, create new brands, pursue M&A activity
May - Summer makeup collection
June - New scalp & hair care series
Focus on acquisition and retention of new customers
Sustain strong sales among existing customers THREE (left) Shimmering Lip Jam
(right) ORDERANGE Shampoo & Conditioner
17Overseas Expansion of POLA Wrinkle Shot Serum
Overseas launch in 2018; starting from June 15 (Hong Kong and Taiwan)
■ Being backed up by post-marketing surveillance in Japan since the launch
Set out to overseas launches
There are no serious problems
(in Hong Kong and Taiwan,
at the moment
at channels with face-to-face consultation)
2017 2018 2019 onwards (plan)
Post-marketing surveillance period Introduce to duty-free stores in multiple countries
Launched in January Price revision in January Timeline for launch in China, where the brand set
as its primary region, depends on the approval
Recorded ¥13.0 bil. Recorded ¥3.4 bil. in
process of the application
annual sales 1Q (¥10 bil. annual target)
For the Chinese market, cross-border e-commerce
Overseas launch
is planned
starting from June
Overseas
Department Duty-fee stores
Overseas stores, etc. Cross-border
E-commerce e-commerce
Department stores,
Japan etc. Japan
(through consultation)
PB, PB, department stores, etc.
Department stores E-commerce
(through consultation)
◆ Sales impact of this on the performance of fiscal 2018 is minor as there are few stores carrying the brand;
however, positive effect can be expected after the full-fledged expansion in 2019.
18(Appendix) About POLA ORBIS Group
Beauty care is the core business of the Group, and
6 different cosmetics brands are operated under the Group umbrella
FY2017
Consol. Net Sales
¥244.3 bil. Overseas Flagship Brands under
Brands Brands development
¥20,000
High Prestige New Brands
×3
*
Price Range
¥10,000
Prestige
¥5,000
Middle-tier
Beauty care business 93%
¥1,000
Real estate business 1% Mass-market
Other businesses 6%
(dermatological drugs and POLA CHEMICAL INDUSTRIES
building maintenance business)
* to be launched in this autumn
Our strengths
Multi-brand strategy Meeting diversified needs of customers
Focus on skincare products High customer repeat ratio
Flagship brands, POLA and ORBIS own and operate
Strong relationships with customers
through their own unique sales channels
19(Appendix) Beauty Care Business Brand Portfolio
Sales
Brand Concept and products Price Sales channel
ratio*
Consignment sales through
High-prestige skincare Beauty Directors:
Approx. POLA THE BEAUTY (PB),
Leading-edge technology in
63% anti-aging and skin-whitening
¥10,000 Esthe-inn and conventional door-to-door
Since 1929 or higher Department store counters
fields
Flagship
Overseas
brands
Mail-order (online and catalog)
Anti-aging brand to draw out ¥1,000~
23% Retail stores
the people’s intrinsic beauty ¥3,000
Since 1984 Overseas
Approx. Specialty stores, department store
Prestige organic skincare brand
6% from Australia
¥5,000 counters and directly-operated stores,
Acquired in 2012 or higher Duty free stores
Overseas
Brands Approx.
Skincare with concept of
¥4,000
1% innovation and power of pure US: Specialty stores and online
water not sold in
Acquired in 2011 Japan
Department store counters and specialty
Skincare made with natural Approx. stores
Brands ingredients from Japan and ¥5,000
Since 2009 Directly-operated stores and online
fashion-forward make-up or higher
under Overseas
7%
develop
-ment Skincare for sensitive skin
¥2,000~
Online
¥5,000
Since 2007
*Sales ratio in the beauty care business as of FY2017
20(Appendix) Long-term Vision
STAGE3
Become a highly profitable
global enterprise
Consolidated
Net sales STAGE2 Goals for FY2020:
•Consol. net sales: ¥250.0 bil. or higher
(bil. yen)
Further strengthen domestic •Overseas sales ratio: 20% or higher
STAGE1 earnings structure and •Operating margin: 13-15%
accelerate overseas expansion
Generate stable domestic
profits and create a successful FY2016 Results:
250.0
business model overseas •Consol. net sales: ¥218.4 bil.
•Overseas sales ratio: 8.7% Domestic and overseas:
FY 2013 Results: •Operating margin: 12.3% Accelerate growth through M&As
•Consol. net sales: ¥191.3 bil.
•Overseas sales ratio: 12.2% Overseas:
•Operating margin: 8.4%
Expand flagship brands overseas
Domestic:
160.0 Achieve stable growth in Japan
(CAGR of around 2%)
2017 – 2020 Mid-term
~
~
Management Plan
2010 2013 2016 2020
21(Appendix) 2017 – 2020 Medium-term Management Plan
The final stage of the long-term vision for 2020.
Aim to improve profitability in Japan, promote a solid shift toward overall profitability
from overseas operations and build a brand structure for next-generation growth.
Consolidated net sales Capital efficiency
Consol. net sales: CAGR 3 to 4% Target for ROE: 12% in FY2020
(¥250.0 bil. in FY2020)
Operating income Shareholder returns
Operating income: CAGR 10% or higher Consolidated payout ratio: 60% or higher
Operating margin: 15% or higher in FY2020 from FY2017
Japan Overseas
Strategy 1. Sustain stable growth of flagship Strategy 2. Bring overseas operations solidly into
brands to lead Group earnings the black overall
Strategy 3. Expand brands under development, create new brands,
pursue M&A activity
Strategy 4. Strengthen operations (reinforce R&D, human resources and
governance)
Strategy 5. Enhance capital efficiency and enrich shareholder returns
22(Appendix) Beauty Care Business Results
for FY2015 – FY2017 by Brands
FY2015 FY2016 FY2017 2016 vs 2017 YoY Change
(mil. yen) Results Results Results Amount %
Consolidated net sales 214,788 218,482 244,335 25,853 11.8%
Beauty care net sales 200,570 202,446 227,133 24,686 12.2%
POLA 109,352 116,126 144,012 27,886 24.0%
ORBIS 56,354 55,857 53,066 (2,790) (5.0%)
Jurlique 18,390 13,118 12,772 (346) (2.6%)
H2O PLUS 3,944 2,547 2,303 (243) (9.6%)
Brands under development 12,529 14,796 14,978 181 1.2%
Consol. operating income 22,511 26,839 38,881 12,041 44.9%
Beauty care operating
income 21,290 25,904 38,121 12,216 47.2%
POLA 12,302 16,993 28,584 11,591 68.2%
ORBIS 11,197 11,279 9,080 (2,199) (19.5%)
Jurlique (379) (1,183) (505) 677 -
H2O PLUS (1,814) (2,027) (317) 1,709 -
Brands under development (15) 841 1,278 437 51.9%
Note : Consolidated operating income and loss for each brand are shown for reference purpose only (figures are unaudited)
23You can also read