Fiscal First Quarter 2021 Ended June 30, 2020 Earnings Presentation - Azure Power

Page created by Ron Stevenson
 
CONTINUE READING
Fiscal First Quarter 2021 Ended June 30, 2020 Earnings Presentation - Azure Power
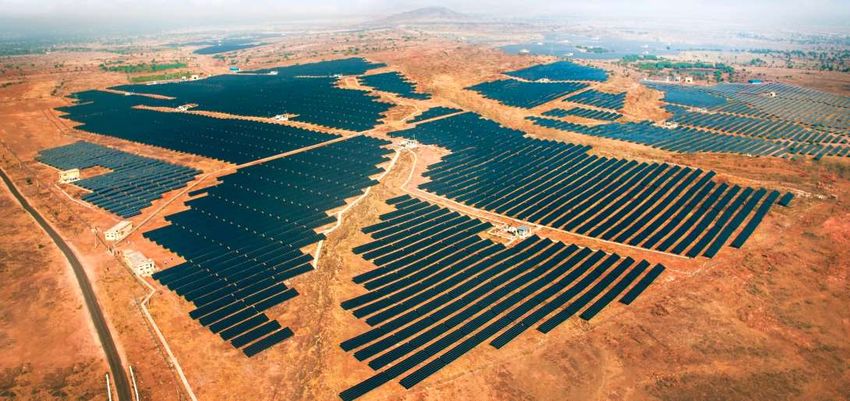
7 GW+ Pan India portfolio of solar assets

                                                     India’s first private grid connected MW solar plant

                                                             Issued India’s first solar Green Bond

Fiscal First Quarter 2021 Ended June 30, 2020
Earnings Presentation
August 14, 2020

1|Copyright © 2020 Azure Power |www.azurepower.com
Fiscal First Quarter 2021 Ended June 30, 2020 Earnings Presentation - Azure Power
Disclaimer
Forward-Looking Statements

This information contains forward-looking statements within the meaning of Section 21E of the Securities Exchange Act of 1934
and the Private Securities Litigation Reform Act of 1995, including statements regarding our future financial and operating
guidance, operational and financial results such as estimates of nominal contracted payments remaining and portfolio run rate,
and the assumptions related to the calculation of the foregoing metrics. The risks and uncertainties that could cause our results to
differ materially from those expressed or implied by such forward-looking statements include: the availability of additional financing
on acceptable terms; changes in the commercial and retail prices of traditional utility generated electricity; changes in tariffs at
which long term PPAs are entered into; changes in policies and regulations including net metering and interconnection limits or
caps; the availability of rebates, tax credits and other incentives; the availability of solar panels and other raw materials; our ability
to attract and retain our relationships with third parties, including our solar partners; our ability to meet the covenants in debt
facilities; meteorological conditions; impact of the COVID-19 pandemic and lockdowns in India and globally; supply disruptions;
power curtailments by Indian state electricity authorities and such other risks identified in the registration statements and reports
that we have filed with the U.S. Securities and Exchange Commission, or SEC, from time to time. In the presentation, portfolio
represents the aggregate megawatts capacity of solar power plants pursuant to PPAs, signed or allotted or where we have been
cleared as one of the winning bidders or won a reverse auction but has yet to receive a letter of allotment. There is no assurance
that we will be able to sign a PPA even though we have a letter of award. All forward-looking statements in this presentation are
based on information available to us as of the date hereof, and we assume no obligation to update these forward-looking
statements.

This presentation also contains non-GAAP financial measures. We have provided a reconciliation of such non-GAAP financial
measures to the most directly comparable measures prepared in accordance with U.S. GAAP in the Appendix to this presentation.

2|Copyright © 2020 Azure Power |www.azurepower.com
Fiscal First Quarter 2021 Ended June 30, 2020 Earnings Presentation - Azure Power
Key Highlights of Recent Developments

                       7,115 MW Portfolio:
                  1,809 MWs Operational,
              1,306 MWs Under Construction,
                  4,000 MWs Committed(2)

                          Key Developments
Sustainability – Awarded Most Sustainable Company in the Solar
                                                                                                                                                                                     Present Value of Equity(2)
                                                                                                                                                                             (Does not consider value for growth beyond current
Energy Industry by World Finance Magazine. Rated top 10 global                                                                                                                          portfolio or cost reductions)
renewable energy company by Sustainalytics.                                                                                                                              $2,500

                                                                                                                                                 PV of Equity (US$ Mn)
Cash Flow to Equity (CFe) from Operating Assets(1) was $21.7                                                                                                             $2,000

million for 1Q FY’21, up 45% from 1Q FY’20; Reiterate long term                                                                                                          $1,500
guidance of CFe growth to $170 - $210 million.                                                                                                                           $1,000

                                                                                                                                                                          $500
Increasing PV of Equity by ~$100mn (~$2/share) for 50bp reduction
                                                                                                                            Under Construction                              $0
in interest rate expectations; Net debt for 7.1GWs expected to be                                                                                                                          10.0%                 12.5%                    15.0%
$100 mn lower than previous guidance                                                                                        Operating
                                                                                                                                                                                                              Cost of Equity
                                                                                                                                                                                  8.5% Interest Rate   9.5% Interest Rate      10.5% Interest Rate
Received LOA for 2 GW greenshoe as part of 4GW win in Dec
2020. Estimated PV of Equity for total 4 GWs is ~$800 - $1bn(2).
Likely extended timeline to sign PPA. ISTS waiver on 4GWs                                                                                                                                      Expect to
                                                                                                                                                                                              achieve 9.0                   Current
provides significant pricing advantage after June 2023. SECI is                                                                                                                                – 10.0%                    market cap
engaging with states to sell power on a blended average.                                                                                                                                     lending cost                  is ~$1 bn
                                                                                                                                                                                               in future
New non-executive, independent Board member, Ms. Supriya Sen.
1) CFe is a Non-GAAP metric, please refer to the reconciliation of this non-GAAP metric in the Appendix. 2) Includes 4,000 MWs which LOA has been received but PPA has not been signed and for which there is a ~$450 mn
of equity raise need; The PPA will follow only after the power is contracted with DISCOMs under a power sale agreement (PSA). There is no assurance that we will be able to sign a PPA even though we have a letter of award.
   3|Copyright © 2020 Azure Power |www.azurepower.com
Fiscal First Quarter 2021 Ended June 30, 2020 Earnings Presentation - Azure Power
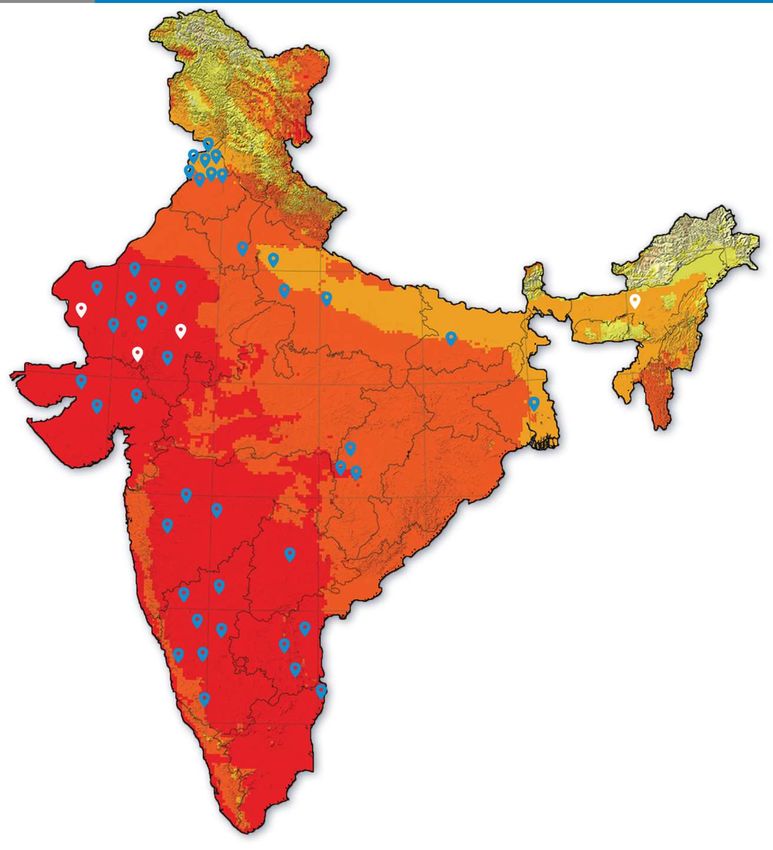
Commitment to Create Shareholder Value
          Focused on value creation; all projects must earn a return above our cost of capital and we will pursue
          the lowest cost of capital
          Focused only on best counterparties with the strongest track records of payment (i.e. NTPC, SECI)
          Will not win projects for just growth’s sake; Participated in but did not win any capacity in recent record low
          tariff auction (INR 2.36/kWh)
          Opportunities to enhance returns in select sites for new projects through expansion and leveraging common
          infrastructure (i.e. avoid transmission, road build costs, construction & operating and maintenance synergies)

                               Current Construction Costs Provides Upside to 4GWs and Strong Returns for
                                                   New Projects Even at Lower Tariffs
                                                                                 December 2019                            Aug 2020       Change(2)

                                              Average Tariff                   INR 2.65 - 2.74/kWh                 INR 2.36 - 2.43/kWh      -11%

                                              Module Costs                          19₵ - 21₵/w                         17₵ - 19₵/w         -10%

                                              Total project costs(1)                58₵ - 62₵/w                         52₵ - 55₵/w         -11%
                                              Interest Rates                        9.5 - 10.0%                          9.0 - 9.5%        -50 bp

1) PPA (or AC) cost per Watt operating excluding Safe Guard Duty and Basic Custom Duty as this is a pass through, 2) Midpoint.

4|Copyright © 2020 Azure Power |www.azurepower.com
Fiscal First Quarter 2021 Ended June 30, 2020 Earnings Presentation - Azure Power
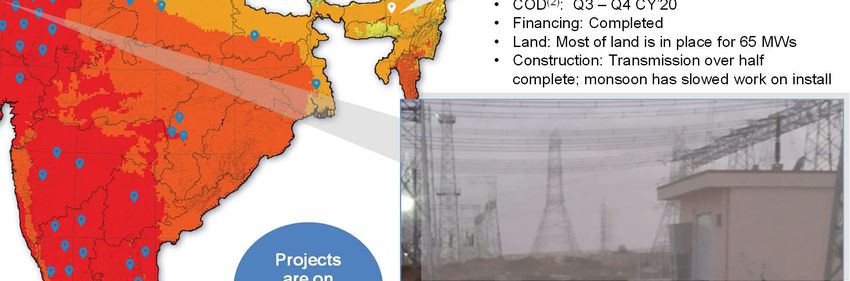
Projects Under Construction Update

                                                                     Expect
                                                                   completion
                                                                      before
                                                                    expected
                                                                     revised
                                                                       COD

Rajasthan 6 - 600 MWs                                                                        Assam - 90 MWs (1)
•   PPA COD: Q1 CY’21                                                                        •   COD(2): Q3 – Q4 CY’20
•   Financing: Completed                                                                     •   Financing: Completed
•   Land: 100%                                                                               •   Land: Most of land is in place for 65 MWs
•   Construction: transmission; fencing, roads                                               •   Construction: Transmission over half
    levelling/grading under way                                                                  complete; monsoon has slowed work on install

                                                                        Projects
                                                                         are on
Rajasthan 8 - 300 MWs                                                  budget to
•   PPA COD: Q2 CY’21                                                     date     Rajasthan 9 - 300 MWs
•   Financing: near complete                                                       •   PPA COD: Q3 CY’21
•   Land: 100%                                                                     •   Financing: Sanction letter received
•   Construction: work on transmission has begun          Under Construction       •   Land: ~75%
                                                                                   •   Construction: in planning stage
    1) 25 MWs on hold; 2) Extension of COD applied for.   Operating
     5|Copyright © 2020 Azure Power |www.azurepower.com
Fiscal First Quarter 2021 Ended June 30, 2020 Earnings Presentation - Azure Power
Industry and Regulatory Update

                       Industry Update                                                 Regulatory Update
 Continued strong growth opportunities remain despite COVID-       Safe Guard Duties (SGD) were extended for another year and
 19. During the quarter, 5.9 GWs of tenders were released and      apply to imports of modules from China, Thailand and Vietnam.
 4.63 GWs of capacity was auctioned. Tariffs for SECI vanilla      A 14.9% duty will be imposed for six months (from July 30, 2020
 solar auctions fell from INR 2.50 – 2.55/kWh to INR 2.36 –        – January 29, 2021) and the duty will fall to 14.5% in the
 2.43/kWh reflecting lower construction costs.                     following six months. The previous duty structure was initiated
                                                                   at 25% in July 2018 for the first year, 20% for the next six
 The Ministry of Power has given an additional 2 month (total is
                                                                   months, and then 15% until July 2020. All of our projects are
 ~5 months) extension for COVID to scheduled COD for
                                                                   protected under Change in Law Provisions.
 renewable energy and transmission projects.

 Extension of ISTS waiver for six months to June 2023.             Basic Custom Duty (BCD) – The current expectation is that a
 Manufacturing linked bids were given a special mention that       10% BCD will be imposed, which will be in addition to the SGD,
 reconfirmed that they would not incur any ISTS charges or         although there has not been a final order. We expect recovery of
 losses on transmission of electricity.                            Safe Guard Duty and BCD as our PPAs are protected from
                                                                   changes in law.
 The Central Government will infuse ~$12bn through Power
 Finance Corp (PFC) and Rural Electrification Corp (REC) to pay    The MNRE and MoP have implemented changes to streamline
 for outstanding DISCOM bills. The payments to suppliers will      recovery of SGD and potentially BCD if implemented. In
 come directly through PFC and REC.                                addition, a standard formula is being applied in PPAs to reduce
                                                                   ambiguity and reduce recovery time.

6|Copyright © 2020 Azure Power |www.azurepower.com
Fiscal First Quarter 2021 Ended June 30, 2020 Earnings Presentation - Azure Power
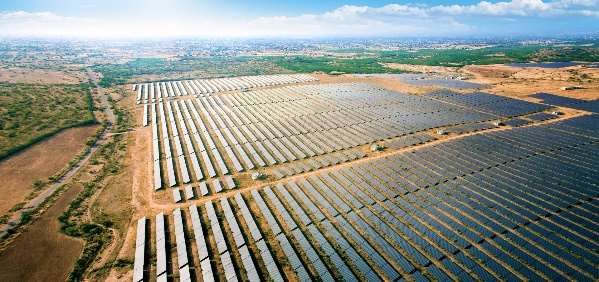
Review of Q1 FY’21 Results
                            Reported             Reported          Reported                           1Q FY’21 After             % Change
                                                                                  Adjustments*
      (in million)          1Q FY’20             1Q FY’21          1Q FY’21                            Adjustments          Adjusted Q1FY’21 vs                                     Comments
                                                                                      US$
                              INR                  INR               US$                                   US$                    Q1FY’20

                               3,389                3,940             52.2                -                  52.2                     16%              21% increase in operational DC MWs. Additional revenue
       Revenue
                                                                                                                                                       of $1 million from recovery of SGD/ GST.
                                                                                                                                                       O&M cost /MW-qtr was ~$1,900 reflecting productivity
 Cost of Operations             297                  263               3.5              (0.7)                 4.2                      7%              improvement. Adjustment of $0.7mn for deferment of
                                                                                                                                                       expenses due to impact of COVID-19.
                                                                                                                                                       Lower primarily due to the absence of management
     General &                                                                                                                                         transition expenses of $ 1.2 million incurred in last year.
   Administrative               544                  379               5.0              (0.7)                 5.7                    (21)%             Adjustment of $0.7mn for lower legal and professional
     Expenses                                                                                                                                          expenses, travel expenses etc due to less activity during
                                                                                                                                                       COVID-19
Non-GAAP Adjusted
                               2,548                3,298             43.7              (1.4)                42.3                     26%                          A 26% YoY increase after adjustments
     EBITDA*
                                                                                                                                                       Operational DC Mw increased by 16% YoY, or 234 MWs;
  Depreciation and
                                623                  755              10.0                -                  10.0                     21%              including full quarter of depreciation for plants
    Amortization
                                                                                                                                                       commissioned during 4Q FY’20
Interest Expense, net
                               1,560                2,163             28.7              3.5                  25.2                     22%              Increase in operational MWs and lower interest income.
   (including other
                                                                                                                                                       Excludes $3.5 million of one-time refinancing charges
       income)
   Loss on Foreign                                                                                                                                     Lower exchange loss on account of lower volatility in INR
 Currency Exchange,              50                   17               0.2                -                   0.2                    (66)%             versus the U.S. dollar compared to the same quarter in the
          net                                                                                                                                          prior year and refinancing of foreign loans.

                                144                  317               4.2                -                   4.2                    120%              Higher taxable income and tax withholding related to our
Income tax expense
                                                                                                                                                       solar green bonds

 Net Profit after tax           171                   46               0.6               2.1                  2.7                     19%                     1Q’21 adjusted net income of US$ 2.7 million

Exchange rate INR 75.53 to US$1 (New York closing rate of June 30, 2020) | *For a reconciliation of Non-GAAP measures to comparable GAAP measures, refer to the Appendix. Refer to earnings press release for further information.
Adjustments are charges or additional items that are non recurring, recurring but expected to be higher or lower going forward or we expect recovery of in the future.
     7|Copyright © 2020 Azure Power |www.azurepower.com
Fiscal First Quarter 2021 Ended June 30, 2020 Earnings Presentation - Azure Power
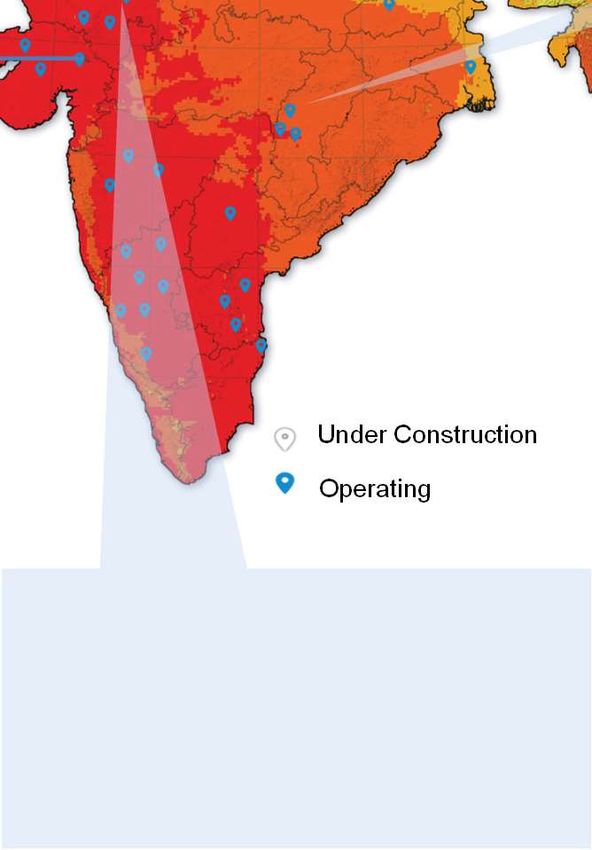
Cash Flow to Equity (CFe) for Operating Assets: 1Q FY’21 vs 1Q FY’20
                                                                  45% growth in CFe from Operating Assets YoY
                  $30                                     ~$1.4 mn of expenses                 $6.3                        ( $6.0 )
                                                          were deferred into future
                                                          quarters due to COVID-19

                  $25
                                                                 $7.3                                                                                   ( $0.9 )
                                                                                                                                                                                 $21.7

                  $20
In US$ Millions

                                    $15.0
                  $15

                  $10

                   $5

                   $0
                           1Q FY'20 CFe from             Additional Revenue           Lower Cash Operating         Higher Cash Interest              Higher Debt           1Q FY'21 CFe from
                            Operating Assets                                          Expenses (O&M, G&A,                                            Amortization           Operating Assets
                                                                                             taxes)
                    ___________________________
                    Exchange rate- INR 75.53 to US$1 (New York closing rate of June 30, 2020) | For a reconciliation of CFe from Operating Assets, refer to the Appendix
                  8|Copyright © 2020 Azure Power |www.azurepower.com
Fiscal First Quarter 2021 Ended June 30, 2020 Earnings Presentation - Azure Power
Balance Sheet

                                                             As at March 31, 2020                               As at June 30, 2020
                                                                  (in million)                                      (in million)

                                                                         INR                               INR                            US$##

   Cash, Cash Equivalents and Current
                                                                        9,792                             7,971                           105.5
             Investments*

      Property, Plant & Equipment, Net                                 95,993                            98,759                          1,307.8

                      Net Debt(1)                                      73,780                            76,249                          1,009.5

                   Hedging Asset                                        6,292                             7,435                            98.4

  *Does not include Current and Non-Current Restricted cash of INR 5,377 million (US$ 71.2 million) as on June 30, 2020.
  (1) Includes hedging asset. The hedging asset is the gains related to the hedges put in place for the Green Bonds maturing in 2022 and 2024. Changes in value is
      directly proportionate to the devaluation of INR versus the US$.

  ## Exchange rate- INR 75.53 to US$1 (New York closing rate of June 30, 2020).

9|Copyright © 2020 Azure Power |www.azurepower.com
Fiscal First Quarter 2021 Ended June 30, 2020 Earnings Presentation - Azure Power
DSO by Counterparty

                                                                                                                               Amounts in US$ million

                                                                                                                              On time/
                                                                                                                                                        Past due
                                                                     Project                                       Net         Within     Past due up                  DSO
                    Customer Name                                                    Capacity (MWs)                                                   more than 365
                                                                     Name                                       Receivables    grace      to one year                 days (1)
                                                                                                                                                          days
                                                                                                                              period(1)

                 SECI , NTPC, NVVN                                                            689                    13.5       13.4         0.1            _           68
                                                                      AP-1
Southern Power Distribution Com of AP Ltd(1)                                                   50                    9.8        1.2          5.3           3.3         522
                                                                       K-3
      Hubli Electricity Supply Company Ltd                                                     40                    5.6        1.0          4.3           0.3         363
                                                                       K-4
      Gulbarga Electricity Supply Company                                                      40                    5.4        1.0          2.6           1.7         339
                                                                       K-5
     Chamundeshwari Electricity Supply Co                                                      50                    7.4        1.3          2.4           3.6         364

                       Other States                                                           799                    21.7       16.2         5.5            -          108

                          Rooftop                                                             141                    4.4        2.2          2.3            -          221
                                                                                             1,809                   67.9       36.5         22.5          8.9         139

(1) Includes revenue generated but yet to be billed of $16.5 mn. DSO is computed on an INR basis.
______________________
Exchange rate- INR 75.53 to US$1 (New York closing rate of June 30, 2020). Figures may not add up due to rounding.
    10|Copyright © 2020 Azure Power |www.azurepower.com
Reiterating FY’21 Guidance

  2,650 – 2,950 MWs                                                                                                       INR 15,800 – 16,600 million(1)
 Operating by March 31,                                                                                                      of Revenue for FY’21
         2021
                                                                                                                           2Q FY’21 Revenue: INR 3,200 – 3,400 million
                                                                                                                                    Q2 FY’21 PLF 18%- 19%

   _________________________
  1) US$ 209- 220 Mn (at June 30, 2020 exchange rate- INR75.53 to US$1); ~90% of the expected revenue is from projects already commissioned and operating and have not been materially impacted
     due to COVID-19. Our remaining revenue is subject to when plants under construction are completed and completion timelines are currently more difficult to forecast due to disruptions related to
     COVID-19.
11|Copyright © 2020 Azure Power |www.azurepower.com
Historical and Future Strong Growth
                                           MWs Operational Guidance
       MWs                                                                                                                                            Gross Margin(2), Cash Flow to Equity for
       8,000
       7,000
                                                                                                                                                       Operating Assets(3) and Debt Forecast
       6,000                                                                                                                                 USD Millions                                                           Gross Margin:
                                                                                            CAGR                                              $700
       5,000                                                                                                                                                                                                         $575 - $675
                                                                                            30%
       4,000
                                CAGR                                                                                                          $600
       3,000
                                42%
       2,000
                                                                                                                                              $500
       1,000
            -                                                                                                                                                                                Gross Margin:
                                                                                                                                              $400
                                FY'17(a)

                                            FY'18(a)

                                                          FY'19(a)

                                                                     FY'21(a)

                                                                                 FY'21(e)

                                                                                             FY'22(e)

                                                                                                         FY'23(e)

                                                                                                                    FY'24(e)

                                                                                                                                FY'25(e)
                    IPO(a)

                                                                                                                                                                                              $275 - $290
                                                                       1Q

                                                                                                                                              $300                    Gross Margin:
                                                                                                                                                                       $180 - $190

                                                       Capex Forecast(1)                                                                      $200
    USD Millions
     $600
                                                                                                                                              $100
                                                                                                                                                                          CFe:                    CFe:                 CFe:
     $300                                                                                                                                                               $45 - $60               $70 - $100          $170 - $210
                                                                                                                                                 $0
       $0
                                                                                                                                                              LTM   Current Operational     Total Contracted      Total Committed
                    FY'21                         FY'22                    FY'23                        FY'24                    FY'25                                 (1,809 MWs)        Portfolio (3,115 MWs) Portfolio (7,115 MWs)
                                                                       Equity Debt
                                                                                                                                                   Net Debt                $978mn               $1,550 mn            $3,100 mn
(US$ millions)               FY'21                     FY'22                    FY'23                      FY'24                  FY'25
                                                                                                                                                                                EBITDA           CFe
                       1Q’21: $25
Cap Ex             9M’21: $475 - $575             $400 - $525               $500 - $650                 $500 - $650            $500 - $650

Exchange rate- INR 75.53 to US$1 (New York closing rate of June 30, 2020) (1) Midpoint of guidance, (2) Revenue less cost of operations equals Gross Margin. Corporate G&A as overhead is covered during
construction in cap ex. (3) CFe (cash flow to equity) for Operating Assets is profit before tax (the most comparable GAAP metric), adjusted for net cash provided for used/in operating activities, other than changes in
operating assets and liabilities, income and deferred taxes and amortization of hedging costs; less: cash paid for income taxes, debt amortization and maintenance capital expenditure. LTM actual debt amortization was
$8.2 million but projections assume normalized debt amortization over 20 years.

   12|Copyright © 2020 Azure Power |www.azurepower.com
Appendix

13|Copyright © 2020 Azure Power |www.azurepower.com
Historical Plant Load Factor (PLF); Annual, Quarterly and 2Q FY’21 Forecast

                23.0%
                                           Q1’ FY’21 PLF:
                                           23.1%                                                                      22.3%
                22.0%

                          21.5%
                21.0%
                                                                                                                      20.5%
                                                                                                                                 Annual PLF
                20.0%                                                                                                         FY'20     19.5%
                                  19.4%
                                                                                                                              FY'19     18.6%
                                                                                                 17.9%
                19.0%                                                                                                         FY'18     18.2%
                                                               18 – 19% PLF 2Q FY’21
                                                                      forecast
                18.0%

                17.0%
                                                                                                         17.7%

                                                       16.4%
                16.0%
                                                                              16.8%

                15.0%
                                      1Q                              2Q                            3Q           4Q

                                                                               FY'19a   FY'20a

 14|Copyright © 2020 Azure Power |www.azurepower.com
Use of Non-GAAP Financial Measures: EBITDA
Adjusted EBITDA is a non-GAAP financial measure. We present Adjusted EBITDA as a supplemental measure of its performance. This
measurement is not recognized in accordance with USGAAP GAAP and should not be viewed as an alternative to USGAAP GAAP
measures of performance. The presentation of Adjusted EBITDA should not be construed as an inference that the Company’s future results
will be unaffected by unusual or non-recurring items.
We define Adjusted EBITDA as net loss (income) plus (a) income tax expense, (b) interest expense, net, (c) depreciation and amortization,
and (d) loss (income) on foreign currency exchange. We believe Adjusted EBITDA is useful to investors in evaluating our operating
performance because:
• Securities analysts and other interested parties use such calculations as a measure of financial performance and debt service
   capabilities; and
• it is used by our management for internal reporting and planning purposes, including aspects of its consolidated operating budget and
   capital expenditures.
Adjusted EBITDA has limitations as an analytical tool, and you should not consider it in isolation or as a substitute for analysis of the
Company’s results as reported under USGAAP GAAP. Some of these limitations include:
• it does not reflect its cash expenditures or future requirements for capital expenditures or contractual commitments or foreign exchange
   gain/loss;
• it does not reflect changes in, or cash requirements for, working capital;
• it does not reflect significant interest expense or the cash requirements necessary to service interest or principal payments on its
   outstanding debt;
• it does not reflect payments made or future requirements for income taxes; and
• although depreciation and amortization are non-cash charges, the assets being depreciated and amortized will often have to be replaced
   or paid in the future and Adjusted EBITDA does not reflect cash requirements for such replacements or payments.
Investors are encouraged to evaluate each adjustment and the reasons we consider it appropriate for supplemental analysis. For more
information, please see the table captioned “Reconciliations of Non-GAAP Measures to Comparable GAAP Measures” in this presentation.

15|Copyright © 2020 Azure Power |www.azurepower.com
Reconciliation of Non-GAAP Measures to Comparable GAAP measures

                                                                                       Quarter Ended June 30,
                                                                                             (in million)
                                                                               2019               2020          2020
                                                                               INR                 INR          US$
         Net profit                                                            171                46            0.6

         Income tax expense                                                    144                317           4.2

         Interest expense, net                                                 1,560             2,163          28.7

         Depreciation and amortization                                         623                755           10.0

         Loss on foreign currency exchange                                      50                17            0.2

         Adjusted EBITDA                                                       2,548             3,298          43.7

  __________________________
  Exchange rate- INR 75.53 to US$1 (New York closing rate of June 30, 2020).

16|Copyright © 2020 Azure Power |www.azurepower.com
Use of Non-GAAP Financial Measures: Cash Flow to Equity (CFe)
Cash Flow to Equity is a Non-GAAP financial measure. We present CFe as a supplemental measure of our performance. This measurement is not
recognized in accordance with U.S. GAAP and should not be viewed as an alternative to U.S. GAAP measures of performance. The presentation of
CFe should not be construed as an inference that our future results will be unaffected by unusual or non-recurring items. We believe GAAP metrics
such as net income (loss) and cash from operating activities do not provide with the same level of visibility into the performance and prospects of our
operating business as a result of the long term capital-intensive nature of our businesses, non-cash depreciation and amortization, cash used for debt
servicing as well as investments and costs related to the growth of our business. Our business owns high-value, long-lived assets capable of
generating substantial Cash Flow to Equity over time. We define CFe as profit before tax (the most comparable GAAP metric), adjusted for net cash
provided for used/in operating activities, other than changes in operating assets and liabilities, income and deferred taxes and amortization of hedging
costs; less: cash paid for income taxes, debt amortization and maintenance capital expenditure. We believe that changes in operating assets and
liabilities is cyclical for cash flow generation of our assets, due to our high growth environment. Furthermore, to reflect the actual cash outflows for
income tax, we deduct income and deferred taxes computed under US GAAP and presented in our consolidated financial statements and instead
include the actual cash tax outflow during the period, are considered as part of interest expense. We believe that external consumers of our financial
statements, including investors and research analysts, use Cash Flow to Equity both to assess Azure Power’s performance and as an indicator of its
success in generating an attractive risk-adjusted total return, assess the value of the business and the platform. In addition, we use CFe internally to
forecast long term financing needs and to determine equity returns on our projects.
We have disclosed CFe for our operational assets on a consolidated basis, which is not the Cash from Operations of the Company on a consolidated
basis. We believe CFe supplements GAAP results to provide a more complete understanding of the financial and operating performance of our
businesses than would not otherwise be achieved using GAAP results alone. Cash Flow to Equity should be used as a supplemental measure and not
in lieu of our financial results reported under GAAP. We have also bifurcated the CFe into Operational Assets and Others, as defined below, so that
users of this financial statement are able to understand the Cash generation from our operational assets. We define our Operational Assets, as the
Projects which had commenced operations on or before the year ended June 30, 2020, the operational assets represent the MW operating as of that
date. We define Others as the project SPV’s which are under construction, or under development - as provided on page 55 of Form 20F, Corporate
which includes our three Mauritius entities, the other than projects covered under operational assets, as well as, a company incorporated in USA and
other remaining entities under the group.

17|Copyright © 2020 Azure Power |www.azurepower.com
Cash Flow to Equity (CFe)

                                                                   For the quarter ended                               For the quarter ended
 (US $ millions)
                                                                       June 30, 2019                                       June 30, 2020

                                                                  Operating         Others            Total          Operating      Others            Total
Sale of power                                                            44.9                 0.0             44.9         52.2                   -           52.2
Cost of operations                                                         3.9                0.0              3.9          3.5                   -            3.5
General and administrative                                                4.5                2.7               7.2          1.6              3.4               5.0
Depreciation and amortization                                             8.1                0.1               8.2          9.9              0.1              10.0
Operating income                                                         28.4              (2.8)              25.6         37.2            (3.5)              33.7
Interest expense, net                                                    19.5                1.2              20.7         25.4              3.3              28.7
Loss/(gain) on foreign currency exchange, net                             0.7              (0.1)               0.6          0.3               -               0.3
Profit before Income Tax                                                   8.2               (3.9)             4.3         11.5            (6.8)               4.7
Add: Depreciation                                                         8.1                  0.1          8.2              9.9             0.1              10.0
Add: Foreign exchange loss, net                                           0.7                (0.1)          0.6              0.3               -                0.3
Add: Ancillary cost of borrowing                                             -                 0.9          0.9                -             1.6                1.6
Add: Other items from the Statement of Cash Flows(1)                      0.8                  0.2          1.0              3.3             1.0                4.3
Less: Cash paid for income taxes                                        (1.2)                (0.8)        (2.0)            (0.8)           (0.4)              (1.2)
Less: Debt Amortization(2)                                              (1.6)                    -        (1.6)            (2.5)               -              (2.5)
Less: Maintenance Capital expenditure(3)                                     -                   -             -               -               -                  -
CFe                                                                    15.0(4)               (3.6)       11.4(4)           21.7            (4.5)              17.2

  __________________________
  All amounts for the years 2020 and 2019 have been translated at an exchange rate- INR 75.53 to US$1 (New York closing rate of June 30, 2020).
18|Copyright © 2020 Azure Power |www.azurepower.com
Cash Flow to Equity (CFe) – Contd.
(1) Items from the Statement of Cash Flows. Other items include: loss on disposal of property plant and equipment of US$ Nil and US$ 0.1 million, share based
    compensation of US$ 0.2 million and US$ 0.9 million, realized gain on investment of US$ Nil million and US$ Nil, non-cash rent expense of US$ -0.1 million and US$
    -0.1 million, allowance for doubtful debts of US$ 0.5 million and US$ 0.2 million, loan repayment charges of US$ Nil and US$ 3.1 million and ARO accretion of US$
    0.1 million and US$ 0.1 million for the period ended June 30, 2019 and June 30, 2020 respectively.
(2) Repayments of term and other loans during the period ended June 30, 2020, was US$ 73.8 million (refer to the Statement of Cash Flows) which includes US$ 71.3
    million related to refinancing of loans or early repayment of debt before maturity and have been excluded to determine debt amortization of US$ 2.5 million.
    Repayments of term and other loans during the period ended June 30, 2019, was US$ 3.3 million (refer to the Statement of Cash Flows) which includes US$ 1.7
    million related to refinancing of loans or early repayment of debt before maturity and has been excluded to determine debt amortization of US$ 1.5 million.
(3) Classification of Maintenance Capital Expenditures and Growth Capital Expenditures All our capital expenditures are considered Growth Capital Expenditures. In
    broad terms, we expense all expenditures in the current period that would primarily maintain our businesses at current levels of operations, capability, profitability or
    cash flow in operations and maintenance and therefore there are no Maintenance Capital Expenditures. Growth capital expenditures primarily provide new or
    enhanced levels of operations, capability, profitability or cash flows.
(4) Reconciliation of total CFe to cash from operations:
                                                                                                          For the quarter ended June           For the quarter ended
    (US$ millions)                                                                                                                                June 30, 2020
                                                                                                                    30, 2019
           CFe                                                                                                         11.4                             17.2

              Items included in GAAP Cash Flow from Operating Activities but not considered in CFe
              Change in Current assets and liabilities as per statement of cash flow                                    (20.0)                            (29.6)
              Current income taxes                                                                                       (2.2)                             (4.6)
              Prepaid lease payments                                                                                     (2.3)                             (0.7)
              Amortization of hedging costs                                                                               3.4                               6.5

              Items included in CFe but not considered in GAAP Cash Flow from Operating Activities
              Debt amortization as per CFe                                                                               1.6                                2.5
              Cash taxes paid as per CFe                                                                                 2.0                                1.2
              Cash from Operating Activities                                                                            (6.1)                              (7.5)
        __________________________
        All amounts for the years 2020 and 2019 have been translated at exchange rate- INR 75.53 to US$1 (New York closing rate of June 30, 2020).
      19|Copyright © 2020 Azure Power |www.azurepower.com
Projects Commissioned - Utility
As on June 30, 2020
                                         Commercial                                                                                                                                                                            Duration
                                                                 PPA Capacity             DC Capacity                    Tariff
       Project Names                      Operation                                                                                                                         Off taker                                          of PPA in          Credit Ratings
                                                                    (MW)                    (MW)                      (INR/kWh)
                                           Date(1)                                                                                                                                                                               Years
Operational - Utility
Punjab 1 (3)                                Q4 2009                       2                        2                     17.91               NTPC Vidyut Vyapar Nigam Limited                                                       25                   AAA
Punjab 2.1 (3)                              Q3 2014                      15                       15                     7.67                Punjab State Power Corporation Limited                                                 25                    A
Punjab 2.2 (3)                              Q4 2014                      15                       15                     7.97                Punjab State Power Corporation Limited                                                 25                    A
Punjab 2.3 (3)                              Q4 2014                       4                        4                     8.28                Punjab State Power Corporation Limited                                                 25                    A
Karnataka 1 (3)                             Q1 2015                      10                       10                     7.47                Bangalore Electricity Supply Company Limited                                           25                    A+
Uttar Pradesh 1 (3)                         Q1 2015                      10                       12                     8.99                Uttar Pradesh Power Corporation Limited                                                12                    A+
Gujarat 1.1 (3)                             Q2 2011                       5                        5                    15.00(4)             Gujarat UrjaVikas Nigam Limited                                                        25                   AA-
Gujarat 1.2 (3)                             Q4 2011                       5                        5                    15.00(4)             Gujarat Urja Vikas Nigam Limited                                                       25                   AA-
Rajasthan 1                                 Q4 2011                       5                        5                     11.94               NTPC Vidyut Vyapar Nigam Limited                                                       25                   AAA
Rajasthan 2.1                               Q1 2013                      20                       21                     8.21                NTPC Vidyut Vyapar Nigam Limited                                                       25                   AAA
Rajasthan 2.2                               Q1 2013                      15                       17                     8.21                NTPC Vidyut Vyapar Nigam Limited                                                       25                   AAA
Rajasthan 3.1 (3)                           Q2 2015                      20                       22                    5.45(2)              Solar Energy Corporation of India                                                      25                   AA+
Rajasthan 3.2 (3)                           Q2 2015                      40                       44                    5.45(2)              Solar Energy Corporation of India                                                      25                   AA+
Rajasthan 3.3 (3)                           Q2 2015                      40                       41                    5.45(2)              Solar Energy Corporation of India                                                      25                   AA+
Chhattisgarh 1.1                            Q2 2015                      10                       10                     6.44                Chhattisgarh State Power Distribution Company Ltd                                      25                    A
Chhattisgarh 1.2                            Q2 2015                      10                       10                     6.45                Chhattisgarh State Power Distribution Company Ltd                                      25                    A
Chhattisgarh 1.3                            Q3 2015                      10                       10                     6.46                Chhattisgarh State Power Distribution Company Ltd                                      25                    A
Rajasthan 4 (3)                             Q4 2015                       5                        6                    5.45(2)              Solar Energy Corporation of India                                                      25                   AA+
Delhi 1.1                                   Q4 2015                       2                        2                    5.43(2)              Solar Energy Corporation of India                                                      25                   AA+
Karnataka 2                                 Q1 2016                      10                       12                     6.66                Bangalore Electricity Supply Company Limited                                           25                    A+
Andhra Pradesh 1 (3)                        Q1 2016                      50                       54                    6.63(4)              Southern Power Distribution Com of AP Ltd                                              25                   BB-
Punjab 3.1(3)                               Q1 2016                      24                       25                     7.19                Punjab State Power Corporation Limited                                                 25                    A
Punjab 3.2(3)                               Q1 2016                       4                        4                     7.33                Punjab State Power Corporation Limited                                                 25                    A
(1) Refers to the applicable quarter of the calendar year. There can be no assurance that our projects under construction and our committed projects will be completed on time or at all., (2) Projects are supported by viability gap funding in addition to
the tariff, (3) Projects under Restricted Group, (4) Current tariff, subject to escalation/change, as per PPA

   20|Copyright © 2020 Azure Power |www.azurepower.com
Projects Commissioned– Utility and C&I
As on June 30, 2020
                                                       Commercial                 PPA                                                                                                        Duration
                                                                                                  DC Capacity               Tariff
               Project Names                            Operation               Capacity                                                                                 Off taker           of PPA in   Credit Ratings
                                                                                                    (MW)                 (INR/kWh)
                                                         Date(1)                 (MW)                                                                                                          Years
Operational – Utility
                                                                                                                                             North & South Bihar Power Distribution
Bihar 1 (3)                                               Q3 2016                   10                   11                   8.39                                                              25            B+
                                                                                                                                             Company Ltd
Punjab 4.1(3)                                           Q4 2016                     50                   52                  5.62            Punjab State Power Corporation Limited             25            A
Punjab 4.2(3)                                           Q4 2016                     50                   52                  5.63            Punjab State Power Corporation Limited             25            A
Punjab 4.3(3)                                           Q4 2016                     50                   52                  5.64            Punjab State Power Corporation Limited             25            A
Karnataka 3.1 (3)                                       Q1 2017                     50                   54                  6.51            Chamundeshwari Electricity Supply Company          25             A
Karnataka 3.2(3)                                        Q1 2017                     40                   42                  6.51            Hubli Electricity Supply Company Limited           25            BB
Karnataka 3.3(3)                                        Q1 2017                     40                   42                  6.51            Gulbarga Electricity Supply Company Limited        25             A
Maharashtra 1.1(3)                                      Q1 2017                      2                    2                 5.50(2)          Ordnance Factory, Bhandara                         25           AA+
Maharashtra 1.2(3)                                      Q1 2017                      5                    6                  5.31            Ordnance Factory, Ambajhari                        25           AA+
Andhra Pradesh 2                                        Q2 2017                    100                  130                  5.12            NTPC Limited                                       25           AAA
Uttar Pradesh 2                                       Q2 - Q3 2017                  50                   59                  4.78            NTPC Limited                                       25           AAA
Telangana 1(3)                                          Q1 2018                    100                  128                  4.67            NTPC Limited                                       25           AAA
Uttar Pradesh 3(3)                                      Q2 2018                     40                   49                 4.43(2)          Solar Energy Corporation of India                  25           AA+
Andhra Pradesh 3(3)                                     Q2 2018                     50                   59                 4.43(2)          Solar Energy Corporation of India                  25           AA+
Gujarat 2(3)                                            Q4 2018                    260                  360                  2.67            Gujarat Urja Vikas Nigam Limited                   25           AA-
Karnataka 4.1(3)                                       Q1 2019                      50                   75                  2.93            Bangalore Electricity Supply Company               25           A+
Karnataka 4.2(3)                                       Q1 2019                      50                   75                  2.93            Hubli Electricity Supply Company Limited           25           BB
Rajasthan 5                                           Q2-Q3 2019                   200                  265                  2.48            Solar Energy Corporation of India                  25           AA+
                                                                                                                                             Maharashtra State Electricity Distribution
Maharashtra 3(3)                                         Q3 2019                    130                 195                  2.72                                                               25          BBB+
                                                                                                                                             Company Limited
Total Operational Capacity –
                                                                                  1,658                2,059
 Utility
Total Operational Capacity –
                                                    2013 – Q2 2020                  151                  151                 5.52(3)         Various                                            25
 C&I(4,5)
Total Operational                                                                  1,809                2,210
 (1) Refers to the applicable quarter of the calendar year. There can be no assurance that our projects under construction and our committed projects will be completed on time or at all.
 (2)Projects are supported by viability gap funding, in addition to the tariff, 3) Projects under Restricted Group
 21|Copyright © 2020 Azure Power |www.azurepower.com
Under Construction Projects –Utility and C&I
 As on June 30, 2020
                                                                                                                                                                                             Duration
                                                    Expected Commercial                 PPA Capacity                        Tariff                                                                       Credit
              Project Names                                                                                                                                                Off taker         of PPA in
                                                      Operation Date(1)                    (MW)                          (INR/kWh)                                                                       Ratings
                                                                                                                                                                                               Years
 Under Construction
Assam 1                                                     Q3 - Q4 2020                        90                         3.34                Assam Power Distribution Company                25         B+

Rajasthan 6                                                    Q1 2021                         600                         2.53                Solar Energy Corporation of India               25        AA+

Rajasthan 8                                                    Q2 2021                         300                         2.58                Solar Energy Corporation of India               25        AA+

Rajasthan 9                                                    Q3 2021                         300                         2.54                Solar Energy Corporation of India               25        AA+

Total Under Construction- Utility                                                            1,290

Total Under Construction- Rooftop                      Q2 2020 – Q4 2020                        16                         4.83                Various                                         25

Total Capacity Under Construction                                                            1,306
Total Portfolio                                                                              3,115
Committed

2 GW Project 1                                                                              2,000 (2)                      2.92                Solar Energy Corporation of India               25        AA+

2 GW Project 2                                                                              2,000 (2)                      2.92                Solar Energy Corporation of India               25        AA+

Total Committed Capacity- Utility                                                            4,000
Total Portfolio                                                                              7,115

 (1) Refers to the applicable quarter of the calendar year. There can be no assurance that our projects under construction and our committed projects will be completed on time or at all.
 (2) Company has been awarded LOA for 4GW solar projects under SECI manufacturing linked tender and has not signed a PPA.

 22|Copyright © 2020 Azure Power |www.azurepower.com
Debt Overview
As of June 30, 2020

                                                                                Maturity Profile (1,2,3)
         $600                                                                     $531.0
         $500                                                                                                                   $470.8

         $400
         $300
         $200
                                                           $73.8                                                                                         $86.6
         $100                 $28.7                                                                          $22.6
           $0
                             FY'21                         FY'22                  FY'23                      FY'24            FY'25 - 29             FY'30 & Beyond

                  Debt Split by Currency                                    LT vs ST Debt Split                      Consolidated Debt (2,3)                 $ 1,213.5
                          INR Debt    Foreign Debt                        Short Term Debt   Long Term Debt
                                                 258.8 ,                                                             Average Interest Rate                            9.9%
                                                                                                     $28.7 ,
                                                  21%
                                                                                                      2%

                                                                                                                     Balance average debt maturity
                954.7 ,                                            $1,184.8 ,
                 79%                                                                                                 for LT debt                                 5.2 years
                                                                     98%

1) This represents the last repayment period. These loans are repayable on a quarterly or semi-annual basis. For repayment by period of the above-mentioned loans, refer to contractual
   obligation and commercial commitments. 2) Exchange rate- INR 75.53 to US$1 (New York buying rate of June 30, 2020). 3) The Company carries the hedging asset of US$ 98.4
   million as at June 30, 2020 against foreign currency loans/borrowings to be settled over loan tenure.

23|Copyright © 2020 Azure Power |www.azurepower.com
Project Debt Schedule
As of June 30, 2020

                                                            Outstanding Principal Amount (In millions)                      Type of Interest            Currency      Maturity Date(1)
               Name of Project
                                                             INR                             US$   (2)

Andhra Pradesh 1                                            2,508                              33.2                              Fixed                    INR               2022
Bihar 1                                                      439                                5.8                              Fixed                    INR               2022
Gujarat 1                                                    928                               12.3                              Fixed                    INR               2022
Karnataka 1                                                  528                                7.0                              Fixed                    INR               2022
Karnataka 3.1                                               1,383                              18.3                              Fixed                    INR               2022
Karnataka 3.2                                               1,430                              18.9                              Fixed                    INR               2022
Karnataka 3.3                                               6,546                              86.7                              Fixed                    INR               2022
Punjab 1                                                     174                                2.3                              Fixed                    INR               2022
Punjab 2                                                    1,699                              22.5                              Fixed                    INR               2022
Punjab 4                                                    5,810                              76.9                              Fixed                    INR               2022
Rajasthan 3.1                                                867                               11.5                              Fixed                    INR               2022
Rajasthan 3.2                                               1,700                              22.5                              Fixed                    INR               2022
Rajasthan 3.3                                               1,805                              23.9                              Fixed                    INR               2022
Rajasthan 4                                                  236                                3.1                              Fixed                    INR               2022
Telangana 1                                                 4,610                              61.0                              Fixed                    INR               2022
Uttar Pradesh 1                                              514                                6.8                              Fixed                    INR               2022
Gujarat 2                                                   9,188                             121.6                              Fixed                    INR               2024
Maharashtra 3                                               5,238                              69.3                              Fixed                    INR               2024
Karnataka 4                                                 3,934                              52.1                              Fixed                    INR               2024
Maharashtra 1.1 & 1.2                                        325                                4.3                              Fixed                    INR               2024
Uttar Pradesh 3                                             1,778                              23.5                              Fixed                    INR               2024
Andhra Pradesh 3                                            2,179                              28.8                              Fixed                    INR               2024
 1) This represents the last repayment period. These loans are repayable on a quarterly or semi-annual basis. For repayment by period of the above-mentioned loans, refer to contractual
 obligation and commercial commitments. 2) Exchange rate- INR 75.53 to US$1 (New York buying rate of June 30, 2020).

 24|Copyright © 2020 Azure Power |www.azurepower.com
Project Debt Schedule
As of June 30, 2020

                                                              Outstanding Principal Amount (In millions)                      Type of Interest             Currency      Maturity Date(1)
                  Name of Project
                                                               INR                             US$ (5)

Punjab 3.1 and 3.2                                            1,219                              16.1                              Fixed                     INR               2024

Chhattisgarh 1.1,1.2 & 1.3                                    1,276                             16.9                              Floating                   INR               2029

Rajasthan 1                                                    467                               6.2                               Fixed                     INR               2031

Rajasthan 2                                                   2,529                             33.5                               Fixed                     INR               2033

Karnataka 2                                                    422                               5.6                              Floating                   INR               2032

Andhra Pradesh 2                                              5,286                             70.0                              Floating                   INR               2036

Uttar Pradesh 2                                               2,091                              27.7                             Floating                   INR               2037

Rajasthan 5                                                   5,751                              76.1                              Mixed                     INR               2038

Assam                                                         1,250                             16.5                              Floating                   INR               2039

Rooftop Projects (4)                                          3,411                              45.2                              Mixed                   INR/US$          2022-2031

                                                           77,521 (2)(3)                       1,026.1
Total

 1) This represents the last repayment period. These loans are repayable on a quarterly or semi-annual basis. For repayment by period of the above-mentioned loans, refer to contractual
 obligation and commercial commitments. 2) This amount is presented in the financials as net of ancillary cost of borrowing of INR 1,133 million (US$ 15.0 million). 3) Non-project level
 debt of INR 6,496 million (US$ 86.0 million) is excluded from the above table. Further foreign exchange fluctuation of INR 8,773 million (US$ 116.2 million) is in respect of project debt
 against which the company has taken hedge. 4) Rooftop Projects includes, Delhi Rooftop 4, Gujrat rooftop, Punjab Rooftop 2, Railway 1, DJB, DMRC and SECI. 5) Exchange rate- INR
 75.53 to US$1 (New York buying rate of June 30, 2020).

 25|Copyright © 2020 Azure Power |www.azurepower.com
Glossary of Select Terms
Accelerated Depreciation – Accelerated depreciation can be elected at the project level, such that projects that reach COD in the first half of the fiscal year can expense
  100% of eligible project costs in year 1, and otherwise can expense 50% of project costs in year 1 and the remainder thereafter. After March 31, 2017, projects that reach
  COD in the first half of the fiscal year will be eligible to expense 60% of project costs in fiscal year 1
Balance of System (BOS) – The non-module costs of a solar system
Basic Custom Duty (BCD) - a proposed tax on imported modules from most countries outside India. The final tax rate and periods have yet to be established.
Committed Projects – Solar power plants that pursuant to customer PPAs signed, allotted or won in an auction but not commissioned and operational as of the reporting date.
Contracted Projects – Solar power plants that have signed PPAs, or are under-construction but not commissioned.
Cash Flow to Equity (CFe) – profit before tax (the most comparable GAAP metric), adjusted for net cash provided for used/in operating activities, other than changes in
  operating assets and liabilities, income and deferred taxes and amortization of hedging costs; less: cash paid for income taxes, debt amortization and maintenance capital
  expenditure. LTM are actuals and projections assume normalized debt amortization over 20 years.
                                                                   Outstanding amount∗Period
Day Sales Outstanding (DSO)- Days Sales Outstanding (DSO) =                                    DSO represents the average no of days taken to recognize the revenue
                                                                    Total Sales for the period
   against sale of power
Gross Margin - Revenue less cost of operations
Ministry of New and Renewable Energy (MNRE) – A Government of India ministry whose broad aim is to develop and deploy new and renewable energy to supplement
   India’s energy requirements
Power Purchase Agreement (PPA) shall mean the Power Purchase Agreement signed between off-taker and the Company for procurement of contracted capacity of solar
  power
Renewable Purchase Obligations (RPO) – Requirements specified by State Electricity Regulatory Commissions (SERCs) as mandated by the National Tariff Policy 2006
  obligating distribution companies to procure solar energy by offering preferential tariffs.
Safe Guard Duty (SGD) – a tax on imported modules from most countries outside India which is 14.9% from July 30, 2020 – January 2021 and 14.5% from January 2021 to
   June 2021.

     26|Copyright © 2020 Azure Power |www.azurepower.com
Affordable Solar Power for Generations
                        Excellence | Honesty | Social Responsibility | Entrepreneurship
27|Copyright © 2020 Azure Power |www.azurepower.com
You can also read