Fissuring in Flight: Consolidation and Outsourcing in the US Domestic Airline Industry, 1997-2018 - Brian Callaci, Ph.D. January 7, 2020 ...
←
→
Page content transcription
If your browser does not render page correctly, please read the page content below
Fissuring in Flight: Consolidation and Outsourcing in
    the US Domestic Airline Industry, 1997-2018
                   Brian Callaci, Ph.D.
                     January 7, 2020

                            1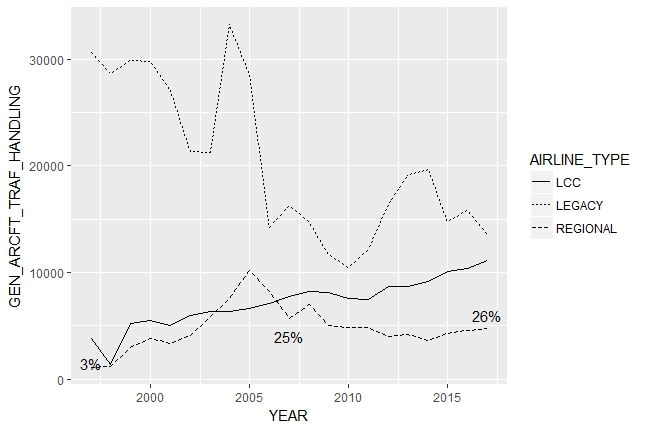
This report was commissioned by the Communications Workers of America (CWA). Mem-
bers of CWA work in telecommunications, media, airlines, health care, public service, edu-
cation, and manufacturing. CWA represents more than 20,000 passenger service agents at
American Airlines and its regional subsidiaries Envoy Air and Piedmont Airlines and, as
part of its AFA-CWA sector, 50,000 Flight Attendants at 20 airlines.

   Brian Callaci is an economist researching how business firms pursue innovations in law
and technology to change the boundaries of the firm through vertical dis-integration strate-
gies such as franchising and subcontracting. These strategies often have the effect of leaving
workers, small businesses, and other stakeholders outside the walls of the firm that controls
their economic lives. Brian received his PhD from the University of Massachusetts Amherst
in 2019. Prior to graduate work in economics he worked as a researcher for labor unions
including UNITE HERE, Workers United, and Change to Win.

                                              2
Contents
1 Executive Summary 6
2 Introduction 8
3 Outsourcing of the First Kind: Shifting Ground and Passenger Service
Work to Third-Party Contractors 11
3.1 Employment and Wages for Direct and Outsourced Airline Workers . . . . . 12
3.2 Employment and Wages in Aviation-Related Occupations . . . . . . . . . . . 16
4 Outsourcing of the Second Kind: Outsourcing Flights to Regional Airlines 22
4.1 Legacy, Regional, and LCC Employment and Wages . . . . . . . . . . . . . . 23
4.2 Full Time Equivalent Employment Across All Labor Groupings . . . . . . . 24
4.3 Employment by Labor Grouping . . . . . . . . . . . . . . . . . . . . . . . . . 29
4.4 Annual Salaries by Labor Group . . . . . . . . . . . . . . . . . . . . . . . . . 37
5 Conclusion 46
Appendices 50
A Airline and Related Industry NAICS classifications 50
B Correlations Between Percent Outsourced and Change in Wages 51
C Description of Form 41 Data 53
D Cleaning and Smoothing Salary Estimates 58
D.1 Pilot Salaries . . . . . . . . . . . . . . . . . . . . . . . . . . . . . . . . . . . 58
D.2 Flight Attendant Salaries . . . . . . . . . . . . . . . . . . . . . . . . . . . . . 59
D.3 Ground and Passenger Service Salaries . . . . . . . . . . . . . . . . . . . . . 62
3List of Tables
1 Number of workers, average hourly real wages (2018 dollars), and share out-
sourced for selected occupations . . . . . . . . . . . . . . . . . . . . . . . . . 18
2 Schedule P-6 and Schedule P-10 detailed labor groupings . . . . . . . . . . . 35
3 Univariate Regression of Percent Change in Wages on Change in Percent
Outsourced . . . . . . . . . . . . . . . . . . . . . . . . . . . . . . . . . . . . 51
4 Employment in Aviation-Related Occupations with More Than 5,000 Employ-
ees in the Air Transportation and Support for Air Transportation Industries 52
5 Airlines Included in Form 41 Data Set by Type and Years Active . . . . . . 55
List of Figures
1 Airline Industry Employment (Private Employers) . . . . . . . . . . . . . . . 13
2 Airline Industry Real Wage . . . . . . . . . . . . . . . . . . . . . . . . . . . 15
3 Relationship of Outsourcing to Wage Growth, 2008 to 2018 . . . . . . . . . . 20
4 Distribution of Airline Industry (Direct and Outsourced) Occupational Wages 21
5 Employment by Airline Type, 1997-2017 . . . . . . . . . . . . . . . . . . . . 25
6 Employment by Airline Type, Separate Scales . . . . . . . . . . . . . . . . . 27
7 Regional Airline Employment by Ownership Status . . . . . . . . . . . . . . 28
8 Pilot and Co-Pilot Employment by Airline Type . . . . . . . . . . . . . . . . 30
9 Flight Attendant Employment by Airline Type . . . . . . . . . . . . . . . . . 31
10 Employment by Airline Type, Other Labor Groups . . . . . . . . . . . . . . 33
11 Ground and Passenger Service Labor Costs as Percentage of Operating Revenue 36
12 Average Domestic Pilot Real Salaries by Airline Type . . . . . . . . . . . . . 38
13 Average Domestic Regional Pilot Salaries by Ownership Status . . . . . . . . 39
14 Average Flight Attendant Real Salaries by Airline Type . . . . . . . . . . . . 41
15 Average Regional Flight Attendant Real Salaries by Ownership . . . . . . . 42
416 Average Annual Salaries, Ground and Passenger Service Workers . . . . . . . 44
17 Average Annual Salaries, Ground and Passenger Service Workers, Legacy Car-
riers Only . . . . . . . . . . . . . . . . . . . . . . . . . . . . . . . . . . . . . 45
18 Average Real Pilot Salaries by Airline Type . . . . . . . . . . . . . . . . . . 59
19 Average FA Salaries by Airline Type . . . . . . . . . . . . . . . . . . . . . . 60
20 Annual FA Salaries for SkyWest . . . . . . . . . . . . . . . . . . . . . . . . . 62
21 Average Ground and Passenger Service Workers Real Salaries . . . . . . . . 63
51 Executive Summary
There is growing evidence that both industrial concentration and practices like outsourcing
and contracting out are major contributors to inequality and wage stagnation for blue collar,
and increasingly white collar, workers. The decline of the US collective bargaining regime has
removed the major force that could counter these trends. First, the falling share of workers
in unions has removed the primary source of countervailing power against industrial concen-
tration that would ensure workers get a fair share of corporate profits. Second, the rising use
of contracting arrangements excludes outsourced workers from direct collective bargaining
with the corporations that control their working conditions, reducing the effectiveness of
traditional firm-level collective bargaining.
Industrial consolidation happens when a small number of firms control market share.
While the Airline Deregulation Act of 1979 was intended to increase competition in the ari-
line industry, that has not been the outcome. Workers in the US domestic airline industry
have been affected by a merger wave that has left three major legacy airlines—American,
Delta, and United—in a tight oligopoly with each other, with only low cost carrier Southwest
exerting substantial national pressure on the legacy carrier oligopoly.1 At the same time,
workers in the airline industry have also been affected by two distinct types of outsourc-
ing. One one hand, airlines have been increasingly outsourcing ground and passenger service
work to third-party contractors. On the other hand, legacy carriers have been turning to out-
sourced regional airlines to fly an increasing share of routes. Legacy carriers minutely control
the operations of regional airlines to an extent virtually equivalent to full integration, yet
customers and workers of regional airlines are treated as customers and workers of separate
firms under many important applicable laws. This report documents trends in employment
and wages in the airline and outsourced airline service industries. Findings include:
1
While other low-cost carriers exert competitive pressure on certain routes, they lack the national network
of Southwest. In an industry where firms compete on the extent of their network (especially for lucrative
business travelers), this means Southwest is the only national competitor to the American/Delta/United
oligopoly.
6• Airlines are increasingly turning to third party contractors, as the outsourced share of
employment has grown from 19 percent in 2001 to 30 percent in 2018. At the same
time, direct employee wages are above the national average for all workers and have
been rising. Meanwhile, outsourced employee wages are below the average and have
been stagnant.
• Heavily outsourced occupations in the airline industry have lower wages. An increase
in outsourcing of ten percent from 2008 to 2018 across a selected group of occupations
is correlated with a decline in wages of five percent.
• Employment of regional airline workers has been growing as a share of total airline
industry employment, and regional pay scales are far below legacy wage scales. The
increasing substitutability of regional for mainline jets threatens to increase the pace
of this type of outsourcing.
72 Introduction
The airline industry is currently very concentrated. There are only three major legacy
carriers left—American, United, and Delta—as US Airways, TWA, Northwest Airlines, and
Continental Airlines have all disappeared by merger since 2001 and ceased to provide effective
competition. Moreover, consolidation in the airline industry is even greater than it seems
just by looking at the market shares of the largest airlines. Azar et al. (2018) point out
that the same investors largely own all three airlines. They show that when one takes
into account the prevalence of the same institutional investors owning blocks of shares in
each airline, the concentration level in the industry is ten times larger than is “presumed
likely to enhance market power” by the antitrust authorities. They also show that increases
in this type of concentration have led to higher fares. Azar and his co-authors do not
focus on regional airlines or outsourcing, but if they did, they would have also found that
“independent” regional airlines like SkyWest are also owned by the same small group of
institutional investors.
Consolidation among legacy carriers can be expected to have two distinct effects on wages
at those carriers, that push in opposing directions. On one hand, rising concentration makes
it easier for airlines to tacitly collude and raise consumer prices, leading to oligopoly profits.
This creates a larger pool of money to share with workers. Historically, particularly in
unionized industries, there has been a “large firm premium” in US labor markets reflecting
this dynamic. On the other hand, there being a smaller number of employers in the industry
means that employers do not have to compete as aggressively for workers, which leads to
lower wages. Economists call this situation “monopsonsy,” and evidence shows it contributes
to lower wages, particularly in the absence of collective bargaining (Azar et al., 2017). Which
of these two effects dominates the other depends mainly on the balance of power between
workers and firms in the industry. In an earlier era of US history, labor market institutions,
most importantly labor unions, balanced out the monopsony effect and ensured that workers
shared in the profits of large firms. As unions have weakened and firms have had more
8freedom in setting wages, the monopsony effect has become stronger.2
While many industries have been consolidating horizontally (meaning firms in the same
market are merging with each other, eliminating competition), firms have simultaneously
been breaking apart vertically (meaning they perform fewer tasks directly in-house, out-
sourcing them to other firms and creating longer supply chains). The economist David Weil
(2014) has coined the term “fissured workplaces” to describe workplaces in which the “lead”
firm decides to focus on the most profitable activities and outsource everything else to third
parties. This takes the form of manufacturing firms replacing direct employees with staffing
agencies, construction general contractors turning to increasingly complex webs of subcon-
tractors, and legacy airlines outsourcing routes to lower-cost regional airlines. In fissured
workplaces, the legal boundaries of the firm act as barriers excluding workers outside them
from gaining access to shares of profits, internal career ladders, and legal protections (whose
coverage remains largely limited to the firm in which the worker has formal employee status).
According to Weil, pressure from shareholders and financial markets, a phenomenon
known as “financialization,” has been a major driver of fissuring. Along with pushing man-
agements to outsource more activity, shareholders, empowered and emboldened relative to
managers and workers since the 1980s, have also demanded a greater share of corporate prof-
its. Corporations that pay out large sums to shareholders in dividends or share buybacks
have less money on hand to invest in innovations or employee skills, wages and working con-
ditions. United paid $7.75B in buybacks since 2013, Delta $10.99B, and American $12.52B.
Fissuring allows firms to pull larger shares of revenue upward by using the legal boundaries
of the firm as barriers to exclude workers and other stakeholders from the revenues generated
by production. As Donald Tomaskovic-Devey argues, limiting “organizational citizenship”
is a key factor generating inequalities in contemporary capitalism (Tomaskovic-Devey, 2014,
p. 59). While janitors in General Motors could demand a share of GM’s oligopoly profits
2
Labor monopsony is actually a special case of monopsony, or “buyer power” generally. In this case it
refers to employers, who buy labor services. But it can also refer to a dominant buyer in any situation, such
as an auto company’s monopsony power over its suppliers.
9by demanding a wage proportionate to assembly workers, outsourcing janitorial services to
contractors prevents these workers from making such claims. Similarly, fast food chains
deploy their low-wage business model by ensuring the legal employer of the affected workers
is not the corporate chain but the legally independent franchisee. Even though the corporate
franchisor minutely prescribes employee training and controls each step of the production
process, workers negotiate wages and benefits with the less wealthy franchisee rather than
the franchisor that controls their working conditions.
The use of legally separate contractors in airlines can be just as arbitrary as in fast food
franchises. For example, years ago American Airlines outsourced 500 wheelchair attendants
at Miami International Airport to a low-wage contractor, putting the service contractor Eulen
America between the parent company and those workers, and putting the workers outside the
walls of American Airlines. However, when the airport enacted a living wage ordinance that
raised the wages of employees of service contractors, American insourced the work to avoid
paying the higher wage. In both the insourcing and outsourcing decisions, American was
taking advantage of differential treatment of service contractors and direct airline employees
under labor law.3 While outsourcing activities to firms with a comparative advantage in
those activities can increase overall efficiency, manipulating business relationships to avoid
inconvenient laws does not.
The notion of firms using legal boundaries to reallocate revenue within supply chains
is consistent with recent empirical data. A growing body of empirical evidence using ad-
ministrative social security data suggests that rising inequality is being driven by between-
firm rather than within-firm inequality (Card et al., 2012; Song et al., 2015; Barth et al.,
2014; Tomaskovic-Devey et al., 2015). Tomaskovic-Devey et al., in particular point out
that since outsourcing moves jobs into new industries, and the growth of low-wage firms
generates much of the observed inequality, outsourcing might explain the empirical pattern
(Tomaskovic-Devey et al., 2015).
3
https://www.miamiherald.com/news/business/tourism-cruises/article222612650.html
10A few recent pieces of research offer additional tools for thinking about airlines. (Wilmers,
2018) focuses on buyer power in supply chains. He finds that horizontal concentration in
the retail sector (fewer and fewer firms controlling more of the final consumer market) plus
vertical dis-integration in the supply chain (outsourcing manufacturing activities to smaller,
less powerful firms) has contributed to wage stagnation for workers in the supply chain. For
example, if you are a poultry worker, WalMart’s buyer power over the poultry farm where
you work gives it the power to put downward pressure on your wages. On the face of it,
Wilmer’s story looks like the airline industry, which has experienced horizontal concentration
at the legacy carrier level plus vertical dis-integration (growth of regionals, outsourcing to
airline services firms) in recent decades. Another piece of research offers a different twist.
(Goldschmidt and Schmieder, 2015) find that when large manufacturing firms outsource
activities (like janitorial or food service) to third party contractors who continue to work
on-site, what happens over time is that wages at the manufacturing firm continue to rise,
but the wages of outsourced workers do not. Over time, a wage gap opens up between the
outsourced workers and their former co-workers at the manufacturing company.
3 Outsourcing of the First Kind: Shifting Ground and
Passenger Service Work to Third-Party Contractors
The airline industry has been affected by two distinct types of outsourcing. First, airlines
have concentrated on the highest-profit activity of flying passengers and cargo, and have
increasingly outsourced maintenance and ground and passenger service activities to low-wage
third-party contractors. Second, in part because of improvements in regional jet technology,
legacy airlines have increasingly outsourced routes to lower-wage, lower-cost regional airlines.
They do this sometimes by subcontracting routes, and other times by maintaining wholly
owned but legally distinct regional subsidiaries. In either case, a central advantage is the
ability to exclude regional airlines workers from enjoying the wages and benefits of the airline
11major’s employees (Forbes and Lederman, 2010).
3.1 Employment and Wages for Direct and Outsourced Airline
Workers
When airlines outsource ramp or passenger service work to specialist aviation contractors,
that activity leaves a trace in data collected by the Bureau of Labor Statistics: it appears
as a fall in employment in the airline industry, and a rise in employment in the support
activities for the airline industry. The best data on employment and wages by industry are
contained in the Bureau of Labor Statistics’ Quarterly Census of Employment and Wages
(QCEW).4 The QCEW classifies workers according to the industries of the companies that
employ them, using the North American Industrial Classification System (NAICS). Figure
1 presents national employment totals for the NAICS industries “Air Transportation” and
“Support Activities for Air Transportation” from 2001 to 2018, as well as the total for both
industries combined. Air Transportation encompasses what we would consider the airline
industry, including cargo and charter airlines. Support Activities for Air Transportation
includes companies that provide specialized services to the air transportation industry, such
as airport operations and servicing and maintaining aircraft.
Companies in the support for air transportation industry, such as Air Serv and Menzies,
are contractors performing services outsourced by airlines and airport authorities, so employ-
ment in this industry is a rough measure of the extent of outsourcing. However, “support
activities” is likely to undercount outsourced aviation workers, because some of the com-
panies providing services to airlines are not classified in the “support activities” industry.
For example, outsourced janitors employed by a janitorial services company like ABM or
security guards employed by a security company like G2 will show up in the janitorial or
security industries, respectively, not the support activities for air transportation industry.
4
https://www.bls.gov/cew/#databases; I used the data viewer to pull wages for workers in the specified
NAICS industries, private employers only, national annual averages.
12Nonetheless it provides a “good enough” rough measure of outsourced aviation jobs. I use
only data from private employers, excluding public agencies.
Figure 1 plots employment in Air Transportation and Support Activities for Air Trans-
portation from 2001 to 2018, along with the combined total of both industries.
Figure 1: Airline Industry Employment (Private Employers)
Source: QCEW, https://www.bls.gov/cew/#databases
The plotted data show a U-shape curve for direct airline employment and a steady upward
trend for outsourced employment. Direct airline employment fell dramatically from 20001
to 2010, a period that contained two recessions, 9/11, and a series of bankruptcies and
mergers. Since 2010, airline industry employment has recovered somewhat, but is still well
below its 2001 level. Meanwhile,outsourced aviation services employment has grown since
2001, both in absolute terms and as a percentage of the total employment of both industries.
13Outsourced services accounted for nineteen percent of total aviation-related employment in
2001, and grew to thirty percent by 2018. It looks like airlines have been turning increasingly
to outsourcing since 2001.
The QCEW also contains average wage data. As these are averages of all workers within
an industry, it should be kept in mind that they contain the wages of top executives as
well as those of production workers. Figure 2 plots the average annual real weekly wages
(in 2018 dollars) of workers in the Air Transportation and Support for Air Transportation
industries, compared to the average across all industries. I also plot weekly wages in the
“Support for Airport Operations” industry, which is a component of the larger Support
for Air Transportation industry consisting of activities like transporting disabled passengers
within airports and handling baggage. (See Appendix A for a complete breakdown of aviation
NAICS industries).
14Figure 2: Airline Industry Real Wage
Source: QCEW, https://www.bls.gov/cew/#databases
The data show a stark dichotomy between direct airline industry wages and those in the
outsourced service industries. Unlike outsourced airline services, the level of direct airline
industry wages is consistently well above the average wage across all industries. Also unlike
the outsourced industries, direct airline industry wages, despite a difficult first decade, have
risen over time. Wages are up twenty-one percent over their 2001 level in real terms. On
the other hand, outsourced airline industry wages, like wages across the broader economy,
are largely stagnant since 2001. Worse, wages for workers in the other airport operations
category are actually down twelve percent in real terms relative to 2001.
153.2 Employment and Wages in Aviation-Related Occupations
According to the QCEW data, direct employment in the airline industry has been falling
while outsourced employment has been growing. At the same time, direct employee wages
have been rising while outsourced employee wages have been stagnant. In the abstract, this
presents a puzzle: other things equal wages and employment within an industry should grow
or fall together, in line with the demand for the output of that industry.
Workplace fissuring is one possible answer. If airlines keep the high-profit activities
like flying the planes in-house, while outsourcing the low-profit activities, like cleaning the
planes between flights and handling baggage, to outside companies, this would serve to
suppress wages for the workers who have been outsourced. Now that they are outside the
boundaries of the larger firm, they are excluded from internal job ladders, wages and benefits
commensurate with the unionized workforces of the primary firm, and access to shares of
the oligopoly profits earned in particular by legacy carriers.
For those workers who are not outsourced and remain at the primary firm, the effect
would depend on their circumstances: for highly trained workers left behind at the primary
firm, the exclusion of less-trained workers, easily outsourced workers could mean even more
resources for them to share (think Google or Microsoft). Alternatively, for easily outsourced,
lower-trained workers, the threat of outsourcing could discipline the wage demands of those
workers remaining at the primary firm (think Amazon’s use of temps).
To better understand these two effects, we need to look at the occupational mix in the
direct and outsourced industries: which jobs were outsourced, which stayed in-house, and
what are the wages in each? We know from Figure 2 that direct airline industry wages have
risen while outsourced airline industry wages have fallen. Have direct airline industry wages
risen because wages increased for all airline employees, or has the occupational mix within
the industry changed such that lower-trained workers were outsourced to low-wage contrac-
tors, leaving only highly trained, high-wage workers remaining in the airline industry? As
mentioned earlier, Goldschmidt and Schmieder (2015) find that when large German manu-
16facturing firms outsource activities (like janitorial or food service) to third party contractors,
the manufacturing firm continue to rise, but the wages of outsourced workers do not.
The Occupational Employment Statistics (OES), which contain data on employment
and wages for occupations within industries, can allow us to examine this question.5 While
there are important limitations to OES data that make it inappropriate to compare trends
over time the way we did with QCEW data, OES data are good enough for comparing two
discrete points a few years apart.6 Table 1 compares employment and wages for several
occupations within the Air Transportation and Support for Air Transportation Industries,
using snapshots from the years 2008 and 2018. My analysis uses annual wages because
weekly wages are not available for flight attendants or pilots in OES data.
5
https://www.bls.gov/oes/tables.htm; I pulled 2018 and 2008 occupation-by-industry data. I rely as a
starting point on the methodology in Dietz et al. (2013).
6
https://www.bls.gov/oes/oes ques.htm, F1.
17Table 1: Number of workers, average hourly real wages (2018 dollars), and share outsourced for selected occupations
No. workers, Avg Hrly Real Wage
direct and Avg Hrly Real Wage Pct weighted across direct &
outsourced Direct Outsourced Outsourced outsourced industries
Occupation 2008 2018 2008 2018 2008 2018 2008 2018 2008 2018 Pct change
Pilots and Co-Pilots 64,100 73,700 144,000 173,000 NA NA 0% 0% 144,000 173,000 20%
Flight Attendants 97,400 115,400 46,000 57,000 NA NA 0% 0% 46,000 57,000 24%
Bellhops & Baggage Porters 16,000 8,700 36,000 27,000 22,000 25,000 54% 96% 28,440 25,080 -12%
Transportation Attendants
8,000 8,000 30,000 31,000 23,000 26,000 64% 96% 25,520 26,200 3%
(Except Flight Attendants)
Cleaners of Vehicles
4,500 12,400 31,000 49,000 27,000 28,000 78% 63% 27,880 35,770 28%
& Equipment
Laborers & Freight, Stock
26,800 59,100 32,000 42,000 28,000 32,000 51% 32% 29,960 38,800 30%
and Material Movers
Cargo & Freight Agents 21,900 16,600 44,000 45,000 30,000 37,000 26% 57% 40,360 40,440 0%
Reservation & Transportation
18
110,300 80,600 40,000 47,000 31,000 34,000 5% 17% 39,550 44,790 13%
Ticket Agents
Customer service reps 15,000 22,100 36,000 48,000 35,000 33,000 30% 97% 35,700 33,450 -6%Bellhops and baggage handlers, transportation agents and cargo and freight agents, and
customer service representatives, have all been heavily outsourced during the years 2008 to
2018, and all have experienced slow or even negative wage growth. As these occupations
are outside the high-profit, “core competency” of flying people and cargo from Point A to
Point B, this seems consistent with Weil’s story of workplace fissuring. Still more striking, the
occupations that have had the most wage growth, such as cleaners of vehicles and equipment,
and laborers, stock and material movers, appear to have experienced net insourcing rather
than outsourcing during this period. This suggests an answer to why wages have diverged
between direct and outsourced employees: it looks as if outsourcing has constrained the
wages of workers in occupations susceptible to outsourcing, while leaving the workers in
occupations insulated from outsourcing with relatively higher wage growth.
Figure 3 plots the relationship between change in percentage of workers outsourced, that
is, P ercentage Outsourced2018 − P ercentage Outsourced2008 , against the percent change
in annual real wages, that is, (W ages2018 − W ages2008 ) / W ages2008 at both ends of this
ten-year period.
19Figure 3: Relationship of Outsourcing to Wage Growth, 2008 to 2018
Source: OES, https://www.bls.gov/oes/tables.htm
There appears to be an almost linear negative relationship: the more outsourced an
occupational category, the lower the wages. It is easy to imagine a straight line running
through the middle of the points. To look at the strength of the correlation, I run a simple
univariate regression on this small number of points. The regression yields a highly significant
correlation coefficient of -0.512. The interpretation of this number is that the slope of the
regression line through the points in the scatterplot is -0.512. Put another way, a ten
percentage point increase in percent outsourced is associated with a fall in wages of 5.12
percentage points.7
This finding should be taken with a grain of salt, since, in addition to the tiny sample
7
Regression table is presented in Table 3 in Appendix B.
20size, I have not controlled for the characteristics of these workers (such as their education,
gender, age, or race) or their industries (such as capital intensity or unionization), and those
underlying characteristics may be driving the observed correlations. Nonetheless with the
data points we have, there appears to be a negative relationship between outsourcing and
wages.
OES data also allow us to look at the distribution of wages for occupations within the air
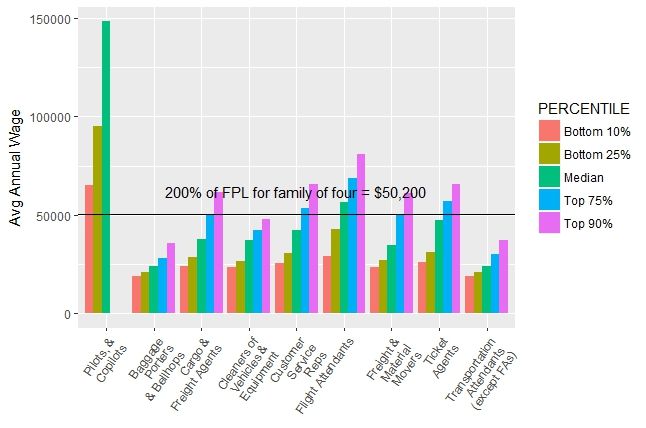
transportation and support for air transportation industries.8 Figure 4 presents these data,
and compares the wage distributions to 200 percent of the Federal Poverty Line (FPL) for a
family of four.9
Figure 4: Distribution of Airline Industry (Direct and Outsourced) Occupational Wages
Source: OES, https://www.bls.gov/oes/tables.htm
8
Once again, I am indebted to Dietz et al. (2013) for the methodology here.
9
https://aspe.hhs.gov/2018-poverty-guidelines
21The top ten percent of pilot and co-pilot wages is missing from the chart because it is
missing form the OES data. Several occupations in the airline industries, including baggage
porters and bellhops, cleaners of vehicles and equipment, and transportation attendants, are
completely below the line. That is, even the top ten percent of earners still earn less than
200% of the FPL. However, even the higher-paid occupations, like flight attendants, include
low-wage workers. The bottom 25% of flight attendants earn below 200% of the federal
poverty line.
4 Outsourcing of the Second Kind: Outsourcing Flights
to Regional Airlines
The airline industry is not only affected by the outsourcing of jobs like baggage handling to
low-wage specialist contractors. Even within the core business of flying airplanes, the major
airlines (the so-called “legacy carriers”) outsource a portion of their flights to lower-wage
airlines known as “regionals.” While there was once a major quality difference between
regionals and legacy carriers, due to the regionals’ specialization in shorter, lower-traffic
routes and use of noisy, uncomfortable turboprop aircraft, the introduction of regional jets
in the 1990s has given legacy carriers the technology to outsource more flights to regional
airlines. Technology is not the only factor affecting the use of regionals, however: pilot and
flight attendant unions negotiate the amount of flights that a legacy carrier can outsource to
regionals under “scope clauses.” Since the main advantage of regional airlines is their lower
labor costs relative to legacy carriers, this may be a concern as contracts become amendable
in 2019 and further changes to scope clauses become possible (Forbes and Lederman, 2005).
It can be difficult for customers to tell the difference between flying on a plane operated
by the legacy airline and one operated by a regional. No tickets are sold under the regional’s
own name or code, and the regional’s aircraft have the legacy carrier’s logo and colors painted
on them. The regional’s flight attendants wear the legacy carrier’s uniform, and usually the
22regional’s schedule is controlled by the legacy carrier. The use of regional flights is a bit like
business arrangements like franchising, which allow large corporations to minutely control the
operations of legally “independent” smaller firms in a manner equivalent to if they actually
directly employed the workers and owned the assets of the smaller company, but without
many of the legal risks, costs, and responsibilities that accompany full legal integration.
For example, just as franchised McDonald’s employees do not have rights under labor law
against McDonald’s corporation, regional airline employees do not have rights against the
legacy carriers that really control their working lives (Callaci, 2018a,b).
4.1 Legacy, Regional, and LCC Employment and Wages
Neither QCEW nor OES data allow us to compare regional airlines to legacy carriers, since
both are part of the Air Transportation NAICS industry and are averaged together in BLS
statistics. Fortunately, the Department of Transportation collects labor, financial, and op-
erational data on each airline as part of its Form 41 reporting requirements. By merging
various data series (or “schedules”) from Form 41 and assigning each airline to its category,
we can compare legacy, regional, and LCC carriers to each other and over time, across a
wide range of characteristics. For more detail on compiling and wrangling Form 41 data, see
Appendix C. Table 5 in Appendix C contains the list of carriers included in the analysis. I
focus on the years 1997-2017.
Unfortunately, two regional airlines, Piedmont Airlines (a wholly-owned subsidairy of
American Airlines) and Commutair (an independent regional), do not file Form 41 data
and are completely missing from the data. While Commutair is rather small (900 employ-
ees), Piedmont is not, employing 8,000 workers.10 This makes Piedmont the third-largest
regional airline by employment in 2017 according to Form 41 data, behind Envoy and Sky-
West (10,000 FTE employees each) and ahead of ExpressJet (6,000 employees). Piedmont’s
workforce would amount to a full thirteen percent of regional airline employment were Pied-
10
http://piedmont-airlines.com/Our-Company/What-We-Do; http://www.flycommutair.com/aboutus/
23mont included with the other airlines that are present in Form 41. The fact that Piedmont is
missing means that the estimates for aggregate employment in the next section will be lower
than the true value. However, because Piedmont’s pay scales have been similar to those of
its peers, the inclusion of Piedmont should not affect the direction of the trends we observe
and analyze below.11
Another problem with the regional data is we cannot be completely certain we are cap-
turing the universe of regional carriers in a given year, due to frequent merger activity, airline
name changes, and the scarcity of historical data. Thus we cannot be completely confident
that aggregate employment figures are accurate, particularly in early years, since this may
reflect airlines that are missing from the data. For example, SkyWest does not appear in the
Form 41 data under its current code until 2004.
4.2 Full Time Equivalent Employment Across All Labor Group-
ings
Using the March full time equivalent (FTE) employment figures from Form 41’s Schedule P-
1(a), we can examine employment trends by carrier type. Figure 5 displays legacy, regional,
and LCC FTE employment over the years 1997-2017. These are domestic plus international
FTE employment numbers, since Schedule P-1(a) is not broken down by operating region.
11
The fact of Piedmont pay scale similarity to other regional airlines was confirmed by Joe Burns of
AFA-CWA.
24Figure 5: Employment by Airline Type, 1997-2017
Source: DOT Form 41 Schedule P-1(a)
Plotting both data series in the same graph allows us to compare absolute employment
numbers (with the caveat that Piedmont and CommutAir are missing from the regional data,
and at least SkyWest is missing prior to 2004). Legacy carrier FTE employment suffered a
steep decline after 9/11 and the 2001 financial crisis, as the industry shed 150,000 FTE work-
ers. LCC FTE employment, meanwhile, shows a rise at a similar rate to regionals. Ignoring
the 1998 dip for LCCs and Regionals, which likely reflects a data error, we can see some
trends clearly. Legacy carrier employment fell rapidly from 2001 to 2008, but has remained
stable since then. Regional and LCC employment have risen steadily during the same period.
This latter development likely reflects two trends: first, LCCs have steadily taken market
share from the legacy carriers. Second, legacy airlines have increased their reliance on re-
25gional jets. Two factors have enabled this trend. First, the introduction in the late 1990s
and early 2000s of 70-plus-seat regional jets like the Bombardier CRJ900 and Embraer 175,
which are much closer substitutes for mainline jets than earlier regional aircraft, made it
possible for legacy carriers to outsource more flights to lower-cost regional airlines. Second,
while pilots initially resisted the substitution of cheaper regional flights (with lower pilot
salaries) for legacy flights, they relaxed their stance during the economic trauma following
9/11. These factors have dramatically increased the ability of legacy carriers to outsource
routes to regional airlines.
While Figure 5 shows us the absolute numbers, it can be hard to see trends clearly when
all types of airline are on the same graph, because regional and LCC FTE employment is
so much lower than legacy carrier FTE employment. Figure 6 allows us to look at regional
and LCC employment trends more closely.
26Figure 6: Employment by Airline Type, Separate Scales
(a) Legacy
(b) Regional and LCC
Source: DOT Form 41 Schedule P-1(a)
In Figure 6, we can see more clearly that regional and LCC carrier employment have
actually been exploding.
Legacy airlines have a choice when replacing mainline flights with regional flights: they
can contract with an “independent” regional airline (albeit still minutely controlled in the
ways discussed earlier) or use a wholly-owned subsidiary to make regional flights. The
27conventional wisdom is that labor costs are lower at independent regionals, but that wholly-
owned regionals give legacy carriers greater control over last-minute schedule changes or
adverse weather events (Forbes and Lederman, 2005). To these two considerations, Joe
Burns of AFA-CWA has suggested a third: ownership of a regional airline provides a more
reliable pipeline of pilots to legacy carriers. Figure 7 plots employment at wholly-owned
subsidiary and contract regional airlines.
Figure 7: Regional Airline Employment by Ownership Status
Source: DOT Form 41 Schedule P-1(a), Regional Airline Association
Ownership information for regional airlines is difficult to come by, especially prior to
2008.12 Moreover, Commutair and Piedmont, the latter a wholly-owned subsidiary of Amer-
ican Airlines, are missing from the data altogether. As a result, Figure 7 should not be
12
See Appendix C for more information on the coding of ownership status for regional airlines
28understood to do anything other than outline broad trends, and is less reliable prior to 2004
(when SkyWest first appears in the data). To overcome some of the jerkiness of the data and
make the trends visible, I plot the three-year moving average rather than the raw data series,
a simple smoothing technique where each year’s observation is averaged with the preceding
and the following year. Wholly-owned and contracted airlines are increasing at about the
same rate, suggesting that growing reliance on regional flights affects both types of regional
airline equally. Regarding the levels of employment at the two types of airline, adding Pied-
mont’s 8,000 employees to the wholly-owned subsidiary line in the last year would put it
above the level of independent regionals.
4.3 Employment by Labor Grouping
While Schedule P-1(a) contains measures of employment by airline, it does not break down
employment by labor group. For that kind of breakdown, we need Schedule P-10, which
contains annual employee figures by labor group and region. In this section I exclude in-
ternational operations to try to get a better apples-to-apples comparison of regional, LCC
and legacy carriers. “Pilots and Co-Pilots” in Schedule P-10 contains the following job cat-
egories: captain, check pilot, chief pilot, copilot, pilot, reserve pilot, and test pilot. Figure 8
displays domestic employment totals for this labor group over time, by type of airline.
29Figure 8: Pilot and Co-Pilot Employment by Airline Type
Source: DOT Form 41, Schedule P-10
There is a strong downward trend in legacy pilot employment, coupled with a strong
upward trend in regional pilot employment. This suggests that the growth in regional em-
ployment is closely related to, and perhaps comes at the expense of, the decline in legacy
carrier employment.13 While in 1997 almost all pilots in the data were legacy carrier pilots
(more than 35,000 legacy pilots vs. less than 5,000 regional or LCC pilots), now there are
just over 25,000 legacy pilots compared to over 15,000 regional airline pilots, and just under
that many LCC pilots. Regional pilot employment stabilzied at thirty-eight percent around
2007.
13
While the leap in regional pilot employment appears to mirror the steep decline in legacy employment
from 1997 to 2005, a portion of the leap in legacy employment is likely due to SkyWest appearing in the
data for the first time in 2004.
30Meanwhile, the flight attendant category in Schedule P-10, Passenger/General Services
and Administration, contains the following job categories: cabin attendant (cargo), cabin
attendant (passenger), hostess, purser, steward, and stewardess. The reader will note that
this is a broader category than just flight attendants. I plot Passenger/General Services and
Administration employment in Figure 9.
Figure 9: Flight Attendant Employment by Airline Type
Source: DOT Form 41, Schedule P-10
While the mirror image does not come through as clearly as it does for pilots, nontheless
we see the same broad trend: regional flight attendant employment grows rapidly as a
proportion of regional + legacy flight attendant employment after 9/11. A key difference
that might explain the lack of a clearer mirror image is the different staffing ratios of flight
attendants to pilots in the smaller regional jets vs. the larger aicraft used by legacy and
31LCC carriers.
The employment trends for other relevant employment groups—General Aircraft and
Traffic Handling, Passenger Handling, and Cargo Handling—are presented in Figure 10.
32Figure 10: Employment by Airline Type, Other Labor Groups
(a) Aircraft Handling
(b) Passenger Handling
(c) Cargo Handling
33The specific job groupings contained in these Schedule P-10 employee count categories,
as well as their counterpart labor cost measures in Schedule P-6, are, presented in Table 2.14
The trend in general aircraft and traffic handling, panel (a), and passenger handling, panel
(b), has, as with pilots and FAs, been growth in regional and decline in legacy employment.
As with pilots and flight attendants, there was a period of rapid growth until 2007, after
which regional employment stabilized. This suggests the outsourcing of work to regional
airlines. Finally, cargo handling employment has undergone a dramatic collapse at legacy
carriers, while regionals and LCCs never had much cargo handling employment to begin with.
This is consistent with cargo handling activities being outsourced to third party contractors.
Another way to look at the extent of outsourcing ground and passenger service workers
is compare labor costs for this category as a percentage of airline operating revenues over
time. By calculating labor costs as percentage of revenue, we measure not just the absolute
decline in employment, but the decline relative to the airline’s resources. Figure 11 contains
those figures.
14
Matching these two schedules together will be important later in calculating average salaries by labor
group.
34Table 2: Schedule P-6 and Schedule P-10 detailed labor groupings
Job Categories Schedule P-6 Schedule P-10
Analyst–procedures Aircraft & Traffic Handling All
Clerk Aircraft & Traffic Handling All
Rates clerk Aircraft & Traffic Handling All
Stenographer Aircraft & Traffic Handling All
Tariff specialist Aircraft & Traffic Handling All
Typist Aircraft & Traffic Handling All
Secretary Aircraft & Traffic Handling All
Control tower operator Aircraft & Traffic Handling Aircraft Control
Crew scheduler Aircraft & Traffic Handling Aircraft Control
Draftsman–flight control Aircraft & Traffic Handling Aircraft Control
Flight director Aircraft & Traffic Handling Aircraft Control
Flight dispatcher Aircraft & Traffic Handling Aircraft Control
Flight regulations supervisor Aircraft & Traffic Handling Aircraft Control
Flight specifications supervisor Aircraft & Traffic Handling Aircraft Control
Meteorologist Aircraft & Traffic Handling Aircraft Control
Baggage clerk Aircraft & Traffic Handling Cargo Handling
Baggage handler Aircraft & Traffic Handling Cargo Handling
Cargo clerk Aircraft & Traffic Handling Cargo Handling
Cargo handler Aircraft & Traffic Handling Cargo Handling
Express agent Aircraft & Traffic Handling Cargo Handling
Freight agent Aircraft & Traffic Handling Cargo Handling
Mail handling clerk Aircraft & Traffic Handling Cargo Handling
Porter–baggage Aircraft & Traffic Handling Cargo Handling
Waybill clerk Aircraft & Traffic Handling Cargo handling
Cleaner–aircraft Aircraft & Traffic Handling General Aircraft and Traffic Handling
Mechanic–line service Aircraft & Traffic Handling General Aircraft and Traffic Handling
Refreshing crew Aircraft & Traffic Handling General Aircraft and Traffic Handling
Regional manager Aircraft & Traffic Handling General Aircraft and Traffic Handling
Station manager Aircraft & Traffic Handling General Aircraft and Traffic Handling
Cashier–ticket office Aircraft & Traffic Handling Passenger Handling
Chauffeur–passenger vehicles Aircraft & Traffic Handling Passenger Handling
Counterman–airport Aircraft & Traffic Handling Passenger Handling
Counter ticket salesman–city Aircraft & Traffic Handling Passenger Handling
Doorman–passenger Aircraft & Traffic Handling Passenger Handling
Gateman Aircraft & Traffic Handling Passenger Handling
Passenger ramp agent Aircraft & Traffic Handling Passenger Handling
Passenger sales ticketing clerk Aircraft & Traffic Handling Passenger Handling
Reservations clerk Aircraft & Traffic Handling Passenger Handling
Reservations manager Aircraft & Traffic Handling Passenger Handling
35Figure 11: Ground and Passenger Service Labor Costs as Percentage of Operating Revenue
Source: DOT Form 41, Schedules P-1.2 and P-6
For ground and passenger services salaries, I use the Aircraft & Traffic Handling figures
from Schedule P-6, which, as can be discerned from Table 2, includes salaries paid to the
Aircraft Control, Cargo Handling, General Aircraft and Traffic Handling, and Passenger
Handling categories. Operating revenues are reported in Schedule P-1.2. What we see is a
steep decline in labor costs across all types of airlines, but especially so for legacy carriers.
This decline in labor costs reflects increased outsourcing, wage cuts for this group of workers,
or both.
364.4 Annual Salaries by Labor Group
Form 41 data allows us to compare annual salaries for certain labor groups across type of
airline.15 We can estimate average pilot salaries as follows. Once again, these are all domestic
figures only, excluding international. PILOT FLY OPS from Schedule P-5.2 contains the
cost of salaries paid to pilots for each airline.16 Dividing this by PILOTS COPILOTS (the
number of pilots from Schedule P-10, which luckily exactly matches the specific job categories
in Schedule P-5.2) for each airline, and taking the average for each type of airline (legacy,
regional, and LCC), we get average pilot salaries for each type of airline. The results,
after adjusting for inflation, removing one extremely implausible observation, and applying
a three-year moving average, are plotted in Figure 12.17
15
Unlike employment levels, which are sums over types of airlines, salaries are averages over each type.
Thus the absence of Piedmont, Commutair, and SkyWest prior to 2004, assuming their wage schedules are
not radically different from peer airlines, is much less meaningful here than it was in the employment totals.
16
More specifically, it contains the salaries of captains, check pilots, chief pilots, copilots, pilots, reserve
pilots, and test pilots
17
The extremely implausible observation was regional pilot salaries increasing over 200 percent from 2013
to 2014, to a level above legacy pilots, and falling by almost the same amount from 2014 to 2015. As this
is almost certainly an error, I simply removed the 2014 observation. The plot prior to outlier removal and
application of the moving average is Figure 17 in Appendix D.1.
37Figure 12: Average Domestic Pilot Real Salaries by Airline Type
Source: DOT Form 41, Schedules P-5.2 and P-10
It is important to keep in mind that these are averages, and pilot pay scales are scaled
to the type of aircraft they fly. The mix of aircraft is therefore a factor in average pilot
salaries, even within an airline type. We can see that clearly LCC pilots have experienced
the strongest wage growth since 1997, with real salaries up fifty percent since 1997. Legacy
pilot salaries show a U-shape, with average salaries declining rather precipitously from 2003
to 2006, but recovering strongly from 2007 to 2017. Regional pilot salaries, meanwhile, are
virtually unchanged, hovering around $75,000 in 2018 dollars for the entire period. The labor
cost advantage of regionals, due to the smaller jets and pilot pay scales, remains very large.
We also might be interested in whether average salaries differ between wholly-owned
and independent regional airlines. While the conventional wisdom is that wholly-owned
38subsidiaries have higher wages than independents, we might want to check that against
Form 41 data. Figure 12 presents unsmoothed average real salaries within the regional
category by ownership status.
Figure 13: Average Domestic Regional Pilot Salaries by Ownership Status
Source: DOT Form 41, Schedules P-5.2 and P-10
There is no discernible difference between the two types of airline. While the average
salaries for wholly-owned airlines swings around more than those for independents, that
likely reflects data quality issues rather than true underlying swings in the wage. Over a
20-year period, the two seem to move together in a common trend.
It is also possible to calculate a rough measure of average flight attendant salaries through
the following formula:
39SALARIES F LIGHT − P ILOT F LY OP S
AV G F A SALARY =
P ASS GEN SV C ADM IN
SALARIES FLIGHT from Schedule P-6 includes salaries for flight attendants and pi-
lots.18 PILOT FLY OPS is the same variable we used to calculate average pilot salaries.19
The denominator, PASS GEN SVC ADMIN, from Schedule P-10, as we saw above, is (roughly)
the number of flight attendants. I then do the same as I did for pilots and take the mean
salary by year for each type of airline. Unfortunately, the quality of these flight attendant
salary estimates, particularly for regional airlines, appears to be lower than that for the pilot
salary estimates. There are several huge swings in the time series plots that likely reflect
errors in the data. The plot below charts the data after the removal of several implausible
observations and the application of a 3-year moving average.20
18
Specfically, it includes the following employee groups: captain, check pilot, chief pilot, copilot, pilot,
reserve pilot, test pilot, flight attendants, communications officer, engineering officer, and navigation officer.
19
Put another way,PILOT FLY OPS reports all of the job categories from SALARIES FLIGHT except
Flight attendants, Communications officer, Engineering Officer, and Navigation Officer.
20
The pre-smoothing chart is Figure 18, presented along with a description of the smoothing process in
Appendix D.2.
40Figure 14: Average Flight Attendant Real Salaries by Airline Type
Source: DOT Form 41, Schedules P-5.2, 6, and P-10
Like pilots, flight attendant salaries depend in part on the type of aircraft on which they
work. This in turn influences the wage gap between legacy carriers and regional airlines.
However, unlike the case for pilots, the skill level and work burdens required of flight at-
tendants are not radically different between the larger aircraft used by legacy carriers and
smaller regional jets. Thus there the justification for paying regional and legacy carrier flight
attendants differently is weaker.
While there is a fair bit of movement between 1997 and 2017, throughout the period a
large gap is evident between legacy and regional airlines: legacy FAs made about $20,000
more per year than their regional counterparts in 2018 dollars in both 1997 and 2017. Re-
gional FA wages, in fact, are still behind 1997 legacy FA wages in nominal (not inflation-
41adjusted) terms. The moving averages of both regional and legacy airline FA salaries are
essentially flat in real terms over this twenty-year period, although estimated legacy flight
attendant salaries rose dramatically in the final three years of the data, a trend muted some-
what by the use of the moving average: $45,000 in 2015, $49,000 in 2016, and $54,000 in
2017. If this trend is real and continues, legacy FAs could be pulling ahead, while regional
FAs have not yet shown industry-wide improvements. As the legacy airline market has con-
solidated into just a handful of airlines, they may be sharing their newfound oligopoly profits
with their shrinking base of in-house employees, while excluding workers at regionals from
sharing in those gains.
Figure 15: Average Regional Flight Attendant Real Salaries by Ownership
Source: DOT Form 41, Schedules P-5.2, 6, and P-10
As with pilot salaries, there is no discernible difference by ownership status, especially
42in the later years. (The data for the later years is also more reliable, as well have a larger
sample of airlines in those years. See Table 5 in Appendix C for information about which
airlines are in the data for which years.)
Finally, this report is also concerned with ground and passenger service workers. Unlike
flight attendants, ground and passenger service workers have been affected not just by the
growth of regionals, but also by outsourcing to third-party contractors. This complicates
the analysis, since once these workers are off the airline payroll we can no longer track their
salaries using Form 41 data. Nonetheless, it is possible to develop some rough estimates
of the salaries of ground and passenger service workers who remain directly employed by
airlines. This adds to our analysis of OES data earlier in this report by allowing us to
examine salaries by type of airline.
Once again I include domestic US operations only. I sum Aircraft and Traffic Handling
Personnel labor costs (P-6) over quarters so each observation is an airline-year pair. Table 2
shows the specific occupations included in this category from Schedule P-6. SALARIES TRAFFIC
is the amount spent on salaries for Aircraft and Traffic Handling Personnel (Schedule P-6),
the narrowest category including ground and passenger service workers. By matching the
labor categories in Schedules P-6 and P-10 to each other (see Table 2 above), we can calcu-
late average salaries for workers in the General Aircraft and Traffic Handling labor group.
The formula is as follows:
AV G T RAF F IC SALARIES = SALARIES T RAF F IC/(GEN ARCF T T RAF HAN DLIN G+
P ASSEN GER HAN DLIN G + CARGO HAN DLIN G + AIRCRAF T CON T ROL)
SALARIES TRAFFIC is the Aircraft and Traffic Handling Personnel figure from Sched-
ule P-6, and GEN ARCFT TRAF HANDLING, PASSENGER HANDLING, CARGO HANDLING,
and AIRCRAFT CONTROL are the employee counts from Schedule P-10. Figure 14 dis-
plays the time series of these salaries over time.
43Figure 16: Average Annual Salaries, Ground and Passenger Service Workers
Source: DOT Form 41, Schedules P-6 and P-10
The implausible observation removal process, along with the pre-smoothing time series
plots, are contained in Appendix D.3. What we can see after the smoothing process is a
dramatic fall in legacy salaries after 9/11, albeit with a partial recovery beginning in 2011.
Regional salaries trend downward throughout the period. The gap has narrowed between
legacy and regional wages, but only because legacy wages have fallen so far. This is consistent
with the analysis of OES wage and employment data as well as of Form 41 employment data
earlier in this report: employment of these worker groups has fallen at legacy carriers, in
part due to outsourcing to third-party contractors, and that process of outsourcing has been
correlated with wage declines for those workers, including those still remaining as direct
airline employees.
44You can also read