FIVE-YEAR FOCUS Immediate actions to tackle congestion April 2018 - Infrastructure Victoria
←
→
Page content transcription
If your browser does not render page correctly, please read the page content below
FIVE-YEAR FOCUS Immediate actions to tackle congestion April 2018

About this paper
Infrastructure Victoria is an independent
advisory body with three main functions:
•   prepare a 30-year infrastructure strategy for Victoria, updated every
    three to five years
•   provide written advice to government on specific infrastructure matters
•   publish original research on infrastructure-related issues.

Our Managing Transport Demand research program is looking at ways to get
the most out of the transport system. It is building on work undertaken for
the 30-year infrastructure strategy, which included a recommendation that
a transport network pricing scheme be implemented in 5-15 years.
This paper outlines measures that can be implemented in the next five years
to improve travel time and reliability on Melbourne’s transport network and
reduce the impacts of congestion.
Our research has used a new approach to transport modelling – the Melbourne
Activity-Based Model – to provide new insights into travel demand patterns
and movement. The use of this model is a significant first for Australia.
We have also undertaken community research to explore people’s travel
behaviours and attitudes towards driving in the peak period.

                                                                              3
Fast facts
       What the future looks like:                                      The opportunities:
       •   There will be an estimated 3.5 million extra trips daily     •   Melbourne’s public transport system is estimated
           across Melbourne’s transport network in 2030.                    to take 540,000 cars off the road in peak periods
                                                                            every day.
       •   Cars are likely to still account for 70% of trips in 2030.
                                                                        •   Early bird train fares shift around 2,600 people
       •   By 2030, time spent on congested roads across
                                                                            from the morning peak every weekday.
           Melbourne will increase by 20%.
                                                                        •   Off-peak fares could shift around 3,000 people
                                                                            from car to public transport.
       What people told us:
                                                                        •   Off peak fares could also shift around 3,000 people
       •   1 in 4 of our surveyed peak period drivers                       out of the peak, equivalent to more than three
           said they could change their time of travel.                     train-loads of people.
       •   1 in 3 of our surveyed peak period drivers                   •   The existing car parking levy is estimated to have
           said they could change their mode of travel.                     removed around 3,900 vehicles from the road
                                                                            every morning.
       •   Only 17% of survey respondents who regularly
           drive during peak pay for parking.                           •   Buses only account for 16% of public transport trips.
       •   People who said they sometimes chose not                     •   40% of the bus network is considered to be
           to drive cited parking as being the number                       underperforming.
           one reason.
                                                                        •   After an overhaul of the bus network in Brimbank,
                                                                            patronage grew by 10% within the first six months.
                                                                        •   The introduction of SmartBus services to areas
                                                                            such as Doncaster and Rowville saw a 70% increase
                                                                            in patronage in the first two years, and steady growth
                                                                            over the past decade.
                                                                        •   High quality cycling infrastructure can accommodate
                                                                            4,600 cyclists per hour.

4   Infrastructure Victoria FIVE-YEAR FOCUS – IMMEDIATE ACTIONS TO TACKLE CONGESTION
Executive summary
Delivering an efficient transport system in a growing city
is no easy task. As Melbourne grows, so too does the challenge
of providing a transport network that allows people to move
around easily.

People moving around the city to get to work,                Our community research has indicated that a third
appointments and activities supports the thriving economy    of people who drive during peak periods could use
and vibrant culture that Melbourne is known for, but also    a different mode, while a quarter could travel at
puts enormous pressure on the transport network.             a different time. Most of our recommendations
                                                             aim to encourage these people to travel differently.
Easing this pressure must be a priority if Melbourne
is to maintain its appeal and liveability.                   Improved bus services aim to give people a good
                                                             alternative to driving, off-peak fares provide an incentive
Melbourne’s roads increasingly struggle to cope with
                                                             to travel at a different time and expanding the car parking
growing demand. Road congestion is forecast to get
                                                             levy helps to discourage people from driving in areas well
worse over the next 15 years and on some parts of
                                                             served by public transport. All have significant potential
the network, increases in travel times and declines
                                                             to shift how and when people travel.
in reliability will be significant.
                                                             Other recommendations encourage government
Not all locations will experience congestion to the same
                                                             to think differently about how it invests in and manages
extent, so we have focussed on where the issues are
                                                             the transport network.
expected to be felt the most.
                                                             Establishing a transparent public transport fare-setting
Current initiatives which seek to improve the performance
                                                             regime is important to ensure the effectiveness of fares
of the road network – including major investments in road
                                                             in achieving clearly defined objectives that can be
and rail projects – must be complemented by additional
                                                             measured. Victoria lags behind other states in its
measures that manage rather than accommodate demand.
                                                             approach to setting fares and remedying this could
In Victoria’s 30-year infrastructure strategy, we said a     deliver network wide benefits.
comprehensive and fair transport network pricing regime
                                                             Better allocation of road space to prioritise efficient
would be the most efficient and effective way of managing
                                                             movement is essential to manage competing interests
congestion and should be implemented in 5-15 years.
                                                             for limited road space.
There are actions that can be taken in the next five years
to improve the performance of Melbourne’s roads in           Targeted active transport investments could also help
advance of this.                                             ease pressure on roads and public transport for short
                                                             trips into inner Melbourne and key employment areas
We have developed a package of recommendations
                                                             in peak periods.
which are practical, low cost, could be delivered quickly
and build on existing measures that have proven effective.   Our analysis also indicates there are parts of Melbourne
                                                             where travelling by private vehicle is the most efficient
These include expanding off-peak fares on the metropolitan
                                                             way for people to get around. In some of these locations
public transport network, overhauling Melbourne’s bus
                                                             we recommend initiatives to improve road connectivity
network, and expanding and increasing the car
                                                             to ensure these car trips occur as efficiently as possible.
parking levy.
                                                             Together, our recommendations provide practical actions
We know that for many people, driving is the only option.
                                                             for government to give people more travel choice and
But our recommendations aim to make other transport
                                                             reduce the impacts of increasing road travel times
modes more attractive to those who can travel in
                                                             and declining reliability on people’s daily lives.
other ways.

                                                                                                                           5
Recommendations
    Shifting demand                                                Better use of existing
                                                                   infrastructure
    1. Expand off-peak fares on the
        metropolitan public transport                              4. O
                                                                       verhaul existing bus services,
        network                                                       expanding successful routes
      a. Introduce a small difference between peak and                and replacing poor performing
         off-peak fares as part of the regular planned fare           routes with low cost,
         rise in January 2019, and adjust this annually               customer-responsive services
         to balance peak and off-peak travel
                                                                      a. Undertake a systematic review of all poor-
                                                                         performing networks to identify opportunities
    2. E
        xpand and increase the car                                      to reprioritise services
       parking levy
                                                                      b. Introduce innovative public transport services
      a. Expand the Category 2 levy area to include                      such as on-demand bus and ride sharing
         Richmond, South Yarra, Windsor and Prahran
                                                                      c. Establish arrangements for demand responsive
      b. Establish revenue sharing arrangements                          and ride sharing services to integrate them
         with each local council covered by the levy                     into the public transport mix

      c. Regularly review and increase the levy
         to reflect increasing congestion                          5. Establish a transparent
                                                                       fare-setting regime
    3. Maximise opportunities to                                     a. Set clear policy objectives to guide the setting
        encourage travel behaviour                                       of public transport fares, focussed on efficiency
        change during disruptions                                        and equity
        to the transport network                                      b. Align public transport fare setting with the approach
      a. Increase bus services on Doncaster bus routes                   in the Victorian Cost Recovery Guidelines
         and maintain bus priority along the Eastern Freeway
         during North East Link construction disruptions           6. Better allocate road space to
                                                                       prioritise efficiency on identified
                                                                       movement corridors
                                                                      a. Identify a priority list of road space allocation
                                                                         initiatives to be delivered over the next five years
                                                                      b. Ensure the list of priority initiatives is based on the
                                                                         Movement and Place Framework and focuses on
                                                                         congested movement corridors with competing
                                                                         uses, such as roads in the City of Yarra and
                                                                         City of Stonnington

6     Infrastructure Victoria FIVE-YEAR FOCUS – IMMEDIATE ACTIONS TO TACKLE CONGESTION
Invest in new networks                                     9. Improve road connectivity
and services                                                   on parts of the network where
                                                               private vehicle use works best
7. Increase investment to introduce                         a. Identify and prioritise investment to improve road
   additional bus services in areas                             connectivity to dispersed employment centres,
   of high demand                                               such as Dandenong South, Laverton and the
                                                                Melbourne Airport area
  a. Introduce a more direct and frequent shuttle
     bus service between Parkville and Victoria Park
     Station in Abbotsford
  b. Provide additional bus services to access the
     Monash and La Trobe National Employment
     and Innovation Clusters, beginning with:
     i. Wellington and Blackburn Roads in Monash
     ii. Services between the Hurstbridge and Mernda
         rail corridors in La Trobe

8. P
    rioritise active transport
   investments to high potential areas
  a. Prioritise investment, which could be partly funded
     from the proposed changes to the car parking levy,
     in the following locations:
     i. Trips to inner Melbourne and Parkville from
       • Richmond
       • Brunswick, Brunswick East and Brunswick
         West through Carlton
       • South Yarra, Prahran, Windsor and Toorak
     i. Trips to the Monash NEIC from Clayton,
        Springvale, Oakleigh and Huntingdale
     ii. Trips to the La Trobe NEIC from Preston,
         Reservoir and Heidelberg West

                                                                                                                     7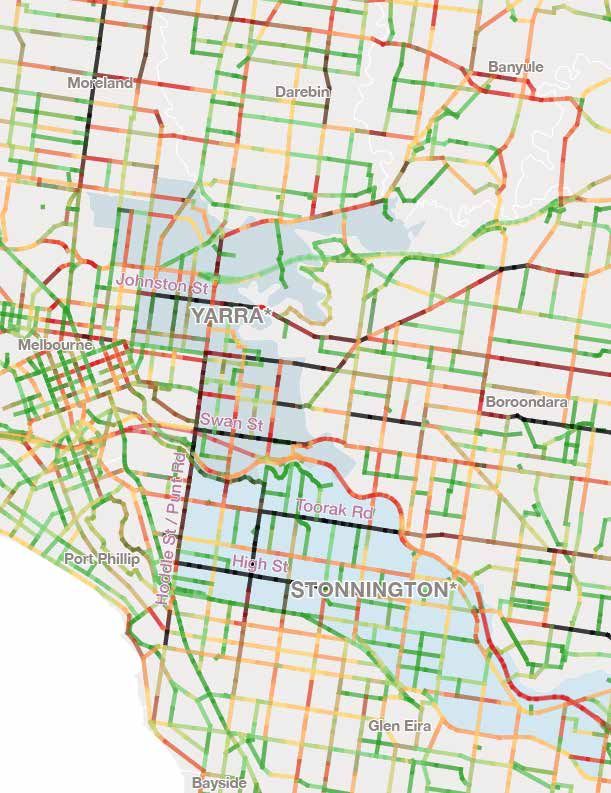
Contents
Fast facts                                                                    4

Executive summary                                                             5

Recommendations                                                               6

1. About our research                                                       10

2. Transport demand and network performance between 2015 and 2030           12

3. What government can do to manage transport demand                        22

4. Shifting demand                                                          28

5. Better use of existing infrastructure                                    36

6. Invest in new assets and services                                        50

7. Implementation of recommendations                                        60

Bibliography                                                                 62

Glossary                                                                     64

Appendix A – Analysis of key focus areas                                     67

Appendix B – Effectiveness of the congestion levy                            72

Appendix C – Recommendations in Victoria’s 30-year infrastructure strategy   74

                                                                                  9
1. About our research
     Being able to move easily                                      As Melbourne grows, the demands placed on this network
                                                                    will increase. At the same time, technology is enabling
     around Melbourne to access                                     a step change in the way transport services are delivered
     jobs, education, services and                                  to the community. The coming decades present both great
     leisure activities is a key element                            challenges and opportunities for Victoria’s transport system.

     of Melbourne’s appeal and                                      Infrastructure Victoria’s Managing Transport Demand
                                                                    research program is examining ways to tackle this
     liveability. Victoria’s economy                                challenge. The research is building on the work undertaken
     is also reliant on an efficient                                for Victoria’s 30-year infrastructure strategy, which included
     and effective transport network                                a recommendation for transport network pricing to be
                                                                    implemented within 15 years in order to best manage
     to support industry and                                        demand. Our subsequent discussion paper The road
     business activity.                                             ahead explored different road pricing regimes that could
                                                                    be implemented in Melbourne. It highlighted the work that
                                                                    needs to be undertaken and the issues that need to be
                                                                    addressed before any recommendation on a preferred
                                                                    pricing regime can be made. This work is ongoing and
                                                                    will be a feature of the updated 30-year strategy in 2019.
                                                                    The Victorian Government’s 2017 Victorian Infrastructure
                                                                    Plan committed to exploring demand management options
                                                                    as part of long-term integrated transport planning. With
                                                                    this in mind, our research program includes identifying
                                                                    ways that demand for transport in Melbourne could
                                                                    be more effectively managed.
                                                                    Effective demand management requires a holistic
                                                                    examination of the transport network. It cannot be
                                                                    focussed on one mode or one type of intervention.
                                                                    Rather, a range of interventions that allow different
                                                                    transport services to complement each other
                                                                    is required.

10     Infrastructure Victoria FIVE-YEAR FOCUS – IMMEDIATE ACTIONS TO TACKLE CONGESTION
This paper explores a number of alternatives to manage MABM is intended to complement existing strategic
demand. It uses the framework presented in the 30-year transport models used by the Victorian Government.
strategy which focussed on three approaches to better MABM is well suited to understanding policy changes
manage the network and is consistent with our guiding that could alter how people use the transport network.
principle to consider non-build solutions first: MABM also provides a better understanding of impacts
on transport users, such as whether lower socio-economic
• shifting demand for infrastructure by providing
incentives to lower demand, or spread demand groups are likely to benefit from changes to the
more evenly, across different modes and different transport network.
times of day We have used the model to understand how people travel
• enabling better use of existing infrastructure by now, and forecast how people are likely to travel in 2030,
improving governance and coordination, utilising and the impacts of this on the transport network.
technology and ensuring efficient maintenance
• increasing investment in new assets or services
where this is proven to be needed, and once Community research
demand management and better use strategies
are exhausted or are not feasible. We have also undertaken community research to explore
people’s travel behaviours and attitudes towards driving
The focus of this research is on metropolitan Melbourne. in the peak period. We wanted to better understand
This does not mean there are no transport demand the impacts of road congestion for regular drivers and
challenges in regional Victoria. The issues in less identify some of the current causes of frustration and the
populated areas, however, are likely to require more willingness to shift to another mode of transport. The
targeted solutions, which we address in the 30-year research provides us with an indicative snapshot of today’s
strategy. Similarly we have not specifically focussed on perceptions of congestion and real day-to-day experiences
freight movements, but the measures proposed will deliver on the roads, picking up on matters that are not captured
benefits for freight by improving road performance overall. in strategic transport models, such as incidents, weather
effects and road works.
Our research uses a new transport model for Melbourne
to demonstrate how travel demand will grow and The community research offers some compelling results
change over the next 15 years. This technical work is and highlights where there are opportunities to change
supported by community research, which explored the people’s behaviour or make travel options more appealing.
attitudes and behaviours of peak period drivers. Using
this data, we considered the opportunities available to MABM results and information from the community
government over the next five years to manage growing research were combined with in-house research and
transport demand. analysis to determine a range of actions government
could take in the next five years to help manage
Melbourne’s growing transport demand. Diagrams,
Development of the Melbourne
tables, figures and maps used throughout this report
Activity-Based Model are all based on this Infrastructure Victoria analysis,
unless otherwise stated.
The 30-year strategy recommended government improve
its modelling tools to better assist long-term strategic
For more technical information about the model or
transport planning. The development of the Melbourne
to see the full results of the community research,
Activity-Based Model (MABM) with KPMG and Arup is a
visit infrastructurevictoria.com.au.
key step towards this. The Managing Transport Demand
program is the first research of its kind to use the model.
112. T
ransport demand and
network performance
between 2015 and 2030
Our research provides new The level of demand on the transport network can have
significant impacts on the performance of the transport
insights into how Melburnians system and how efficiently people and goods can move.
are predicted to use roads
As demand on the transport network grows, the
and public transport in 2030. performance of the network changes. These changes
manifest in a number of ways: trip times increase, delays
grow, speeds decline and reliability problems emerge.
Drivers of transport demand
By 2030, the population of metropolitan Melbourne
is estimated to grow from 4.5 million people in 2015
to almost six million people. Employment is also
expected to grow significantly over the same period,
with an additional 400,000 workers expected by 2030,
increasing the number of daily trips to work in
metropolitan Melbourne to just over two million.
The distribution of this population and employment is
not predicted to be even. Approximately two-thirds of
the population increase is expected to occur in the existing
growth corridors in Melbourne’s outer south east, north
and west, as well as the inner metro region (Figure 1).
However over three-quarters of the projected increase
in employment is forecast to occur in the inner and
middle suburbs of Melbourne (Figure 2).
The distribution of population and employment growth
presents a significant transport challenge for Melbourne.
More people are projected to live in the outer suburbs,
with many needing to travel long distances, often at the
same times, to access jobs.
Aside from changes to population, demographics
and employment, and its spatial distribution, demand
is influenced by the supply and management of the road
network and the provision of alternative modes of transport.
12 Infrastructure Victoria FIVE-YEAR FOCUS – IMMEDIATE ACTIONS TO TACKLE CONGESTIONFigure 1 Change in population 2015-2030
MID NORTHERN
OUTER NORTH WEST
Population Growth
1- 500
OUTER NORTHERN 500 - 1000
1000 - 1500
1500- 2000
OUTER EASTERN 2000 - 2500
2500 - 3000
OUTER WESTERN 3000 - 3500
MID EASTERN 3500 - 4000
4000 - 4500
4500 - 5000
5000 +
INNER METRO MID
MID WESTERN SOUTH
EAST
INNER SOUTH EAST
SOUTHERN
Source: KPMG/Arup (2017),
Travel demand and movement
patterns report. Based on
Victoria in Future
Figure 2 Change in employment 2015-2030
MID NORTHERN
OUTER NORTH WEST Employment Growth
1- 500
500 - 1000
OUTER NORTHERN 1000 - 1500
1500- 2000
2000 - 2500
OUTER EASTERN 2500 - 3000
3000 - 3500
OUTER WESTERN 3500 - 4000
MID EASTERN 4000 - 4500
4500 - 5000
5000 +
INNER METRO MID
MID WESTERN SOUTH
EAST
INNER SOUTH EAST SOUTHERN
Source: KPMG/Arup (2017),
Travel demand and movement
Figure X: X
patterns report. Based on the
Victorian Government’s Small
Area Land Use Projections
13To get a picture of how the current and planned transport network is likely to respond to growing demand, we have
used MABM to model travel across Melbourne in 2015 and then again in 2030. For this network-wide picture, the
modelling divides Melbourne into 11 sub-regions and then grouped these regions into inner, middle and outer bands,
as shown in Figure 3 below.
Figure 3 Sub-regions of Greater Melbourne – Coverage of the Melbourne Activity-Based Model
OUTER NORTH WEST
Macedon
Sunbury
Mernda
OUTER NORTHERN
Melton
Warburton
MID NORTHERN
OUTER WESTERN OUTER EASTERN
CBD Box Hill
MID WESTERN
MID EASTERN
Werribee
Dandenong
INNER METRO
MID SOUTH EAST
Pakenham
INNER SOUTH EAST
Region Groups
Frankston SOUTHERN
Inner
Middle
Outer
REPORTING REGIONS
Source: KPMG/Arup (2017), Travel
demand and movement patterns report
MABM demonstrates how people respond to changing transport constraints by changing their behaviour, and the resulting
impact of this on the transport network.
In line with Victorian Government population forecasts1, MABM predicts an increase in trips by 2030 of 3.5 million, rising
from over 11.5 million trips in 2015 to nearly 15 million trips in 2030. This growth in trips will put significant extra pressure
on Melbourne’s transport network, in particular because it will not be evenly spread (as we can see in Figure 4). There is an
estimated increase in daily vehicle kilometres travelled of around 25% by 2030, with particular corridors being in the south
east and north west of the city.
1 Victoria in Future, see https://www.planning.vic.gov.au/land-use-and-population-research/victoria-in-future-2016.
14 Infrastructure Victoria FIVE-YEAR FOCUS – IMMEDIATE ACTIONS TO TACKLE CONGESTIONFigure 4 Daily car trip (driver or passenger) growth 2015-2030
MID NORTHERN
OUTER NORTH WEST
OUTER NORTHERN Trip Growth
1000 - 2000
OUTER EASTERN
2000 - 3000
3000 - 4000
MID EASTERN 4000- 5000
OUTER WESTERN 5000 - 6000
6000 - 7000
7000 - 8000
8000 - 9000
INNER METRO 9000 - 10000
MID WESTERN 10000 +
MID
INNER SOUTH EAST SOUTHERN
SOUTH
EAST
Source: KPMG/Arup (2017),
Travel demand and movement
patterns report
Measuring congestion The majority of respondents in our community research
reported experiencing congestion regularly, with their
When thinking about how to measure congestion for descriptions principally defining congestion as slow
this report, we wanted to understand what matters most or stopped traffic. Around 85% of respondents said
to people and how it affects them. congestion had worsened in the last five years, and
We looked at Austroads’ examination of the ‘acceptable the most common behavioural response was to allow
level of congestion’ in its Congestion and Reliability extra time. Respondents indicated that they preferred
Review2, as well as our community research results a predictable journey time that takes longer, rather than
to get a picture of what matters to people. an unpredictable journey time that is usually quicker.
Austroads finds that while different road users travel Taken together, the Austroads analysis and community
differently – commuters, commercial and freight users views suggest that the two most important indicators
require access at different times, with different economic of transport congestion are travel time and reliability.
costs and benefits – reliability is a particular concern for all Travel time is a measure of the total time that it takes
users. However, the definition of ‘acceptable’ congestion to complete a journey, while reliability is a measure
is subjective and driven by a range of factors including of how dependable travel time is.
not just travel time and reliability, but also less customer-
focussed factors such as the productivity of road assets
and efficient levels of road supply.
2 Austroads (2016), Congestion and Reliability Review.
15How will the transport network Two key findings emerge from this comparison:
perform in different regions • In the outer northern, southern and outer western
suburbs, trip distances fall as the growing population
of Melbourne? leads to the provision of more local jobs and services,
and investments in the road network provide more
direct links. Despite the reduction in trip distances,
Travel time deterioration trip times increase, reflecting increasing road
There will be more trips in 2030 and they will be on average demand within these areas.
longer than in 2015. The impacts of this will be different • In the middle areas of Melbourne (including the
in different parts of Melbourne (see Figure 5 below). This inner south east), trip distances are relatively stable;
is due to a number of factors including infrastructure however, trip times increase markedly. These are areas
where the road network is largely fixed with little scope
provision and changes in travel patterns.
for increased capacity. These areas represent the
most significant decline in performance between
now and 2030.
Figure 5 Average daily private vehicle trips by origin, 2015 to 2030
2015 2030
30
Outer Northern
Outer Western
25
Inner Metro
Time (minutes)
Mid Northern
20 Mid Western
Southern
Mid South East
Mid Eastern
Inner South East Source: KPMG/Arup (2017),
Travel demand and movement
15
patterns report
6 8 10 12 14
Distance (km)
16 Infrastructure Victoria FIVE-YEAR FOCUS – IMMEDIATE ACTIONS TO TACKLE CONGESTIONReliability Across the network, the hours spent travelling on roads
exceeding this benchmark increase between 2015 and
Melbourne’s roads will become less reliable in coming 2030. It is most pronounced during the morning and
years. Reliability indicates how dependable and consistent evening peak periods.
travel times are along a particular stretch of road at
a particular time of the day. Deterioration in reliability is felt most significantly in outer
areas where there is a 36% increase in hours spent travelling
As a road approaches capacity, reliability deteriorates.
on roads exceeding the benchmark (see Figure 6).
This is because roads have a finite capacity depending on
a number of factors including number of lanes, speed limit,
Beyond the two key measures of congestion, MABM also
intersection frequency and geometry. As traffic volumes
provides insights on how the peak period is spreading and
on a road near its capacity, traffic flow slows and driver
on the impact of increasing demand on public transport
behaviours start to change – resulting in increasing travel
system. This is the key strength of MABM – it can show
times and reduced travel time reliability.
how people might shift their time and mode of travel.
In our analysis we use a 70% capacity threshold as
a benchmark3 for when traffic flow and speeds start
to be significantly impacted.
Figure 6 Hours travelled on roads at or above 70% capacity during the morning peak period
2015 2030
Middle 20% increase
Outer 36% increase
Inner 24% increase
Source: KPMG/Arup (2017),
Travel demand and movement
patterns report
0 60,000 120,000 180,000
Hours travelled on roads at or above 70% capacity
during the morning peak
3 We have used a volume-to-capacity benchmark to measure reliability
based on the New Zealand Transport Authority (NZTA) Economic
Evaluation Manual method using modelled volume-to-capacity
ratios for Melbourne.
17Peak periods
For many Melburnians, travel times are relatively fixed. As demand for travel on roads grows to 2030, people are
Work and school start and end times tend to be relatively predicted to respond by changing their times of departure
uniform across Melbourne. This results in two large peak to avoid the peak periods at both ends of the day, in effect
periods, in the morning and evening. The morning peak widening the peak periods. For example, some people
period tends to be more concentrated than the evening travelling from the outer suburbs during the morning peak
peak period, as the finishing times of activities tend period are predicted to leave up to 45 minutes earlier
to be more variable than the start times. than they do today in order to avoid the heaviest traffic.
It is during these peak periods that the impacts of This behaviour change results in longer peak conditions
increasing transport demand on changes in travel (compared to 2015) by around five hours on an average
time and reliability are most evident. weekday in Melbourne’s outer suburbs (Figure 7).
However, if not for the spreading of the peak period,
anticipated travel time and reliability deterioration
would be significantly worse.
Figure 7 Peak spreading across the outer regions in 2015 and 2030
2015 Peak Period 2030 Peak Period
180,000
160,000
140,000
Vehicle Hours Travelled
120,000
100,000
80,000
60,000
2030
40,000 2015
20,000
0 2 4 6 8 10 12 14 16 18 20 22
Time of Day
Source: KPMG/Arup (2017), Travel demand and movement patterns report
18 Infrastructure Victoria FIVE-YEAR FOCUS – IMMEDIATE ACTIONS TO TACKLE CONGESTIONPublic transport impacts
Melbourne’s public transport network is expected to experience increased demand between 2015 and 2030. MABM
predicts a 76% increase in public transport trips across Melbourne, or 878,000 additional public transport trips each day.
Public transport’s share of motorised transport is forecast to increase from 10% to 14% (Figure 8).
Figure 8 Public transport and private vehicle mode share, 2015-2030
2015 90% 10%
Private vehicle
Public transport
2030 86% 14%
Source: KPMG/Arup (2017),
Travel demand and movement
patterns report
0% 50% 100%
Mode Share %
The most significant growth in public transport share occurs in the peak periods (see Figure 9). For trips departing
in the morning peak hours (7.00am – 9.00am), the share of public transport as a proportion of motorised travel
is projected to increase from 12% to 17%.
Despite higher service frequencies across many areas of Melbourne compared with today, this large increase in
demand puts significant pressure on the public transport network. By 2030, some of the key rail groups – Clifton Hill,
Caulfield and Northern groups – will be at or over capacity for a longer time during the morning peak period.
Figure 9 Change in public transport mode share (motorised travel)
2015 2030
14%
6am – 7am
18%
Time of departure
12%
7am – 9am
17%
7%
9am – 10am
10%
Source: KPMG/Arup (2017),
Travel demand and movement
0 5 10 15 20 patterns report
Mode share %
19Our five-year focus We analysed changes in travel times and reliability for trips
to the CBD and all of the NEICs in the morning peak. We
Many of the key actions available to government in identified key priority movements that would benefit from
seeking to address network-wide problems are long term. action in the short term using the following criteria:
In particular, network pricing, significant shifts in land use
(to bring jobs and homes closer together) or major uplifts • trips to the CBD and NEICs that occur in significant
in public transport capacity are measures that could have volumes and that:
network-wide benefits, but could also take many years -- require travel through areas with significant
to fully deliver. road network reliability issues
-- demonstrate average travel time deterioration
The focus of this report is to consider the opportunities of more than 10% out to 2030.
available to government over the next five years. This
requires going beyond network-wide analysis to a more The key priority movements identified are shown in Table 1.
detailed examination of travel times and reliability by Appendix A provides detailed discussion of our analysis.
place of travel destination.
Table 1 Priority movements in the short term
To identify short-term opportunities we have focussed
on targeted problem areas that have a significant potential Destination Trip origin by local government area
for demand management in the short term. These are
areas that experience a large number of trips combined Darebin, Moonee Valley, Moreland,
CBD
with poor or significantly declining road performance, Stonnington and Yarra.
as measured by travel times and reliability. Hume, Moonee Valley, Moreland,
La Trobe NEIC
Stonnington, Whittlesea and Yarra.
On this basis, we have focussed on trips to the Melbourne
central business district4 (CBD) and National Employment Bayside, Boroondara, Glen Eira,
and Innovations Clusters5 (NEICs) in the morning peak Monash NEIC Manningham, Maroondah, Stonnington
and Whitehorse.
period. More than a third of morning peak trips have
either the CBD or a NEIC as their destination. In general,
Parkville NEIC Darebin and Moreland.
travel times and reliability to these destinations are
deteriorating and will continue to worsen. However the
story is not uniform and there are different challenges Parts of Melbourne’s transport network with lower trip
across different areas. volumes than the CBD and NEICs, such as metropolitan
Access to the CBD and NEICs from some parts of activity centres and local networks, will also experience
Melbourne is set to significantly decline by 2030, even issues with travel time and reliability. However, due to
in areas which are presently performing well. Some areas the lower trip volumes going to these areas compared
are already experiencing significant travel time and reliability to the CBD and NEICs, they have not been the focus of
impacts and are not expected to see an improvement this analysis. Some of the actions government can target
by 2030. In other areas, due to significant infrastructure towards the CBD and the NEICs will also have benefits
investments, travel times and reliability to the CBD for these areas. We will also be looking more closely at
and NEICs are expected to improve by 2030. local network issues when updating Victoria’s 30-year
infrastructure strategy.
4 In our MABM analysis, we used an expanded CBD which includes the
Hoddle Grid, Docklands and the northern part of Southbank. This is
in recognition of the broader functioning of the city beyond the grid.
5 There are seven National Employment and Innovation Clusters
(NEICs) identified in Plan Melbourne.
20 Infrastructure Victoria FIVE-YEAR FOCUS – IMMEDIATE ACTIONS TO TACKLE CONGESTION21
3.	What government
         can do to manage
         transport demand
     There are a range of measures in place to help manage                               Public transport delivers significant benefits to the wider
     demand across Melbourne’s transport network.                                        economy, including lower road congestion which constitutes
                                                                                         a significant proportion of the external benefits of public
                                                                                         transport.7 Key new public transport projects helping to shift
     Current measures to manage                                                          demand away from roads include new high capacity trains,
     Melbourne’s transport demand                                                        new rail line upgrades and the Melbourne Metro project.
                                                                                         According to the Bureau of Infrastructure, Transport and
     Investment in networks and services
                                                                                         Regional Economics, road congestion in 2015 across all
     Direct investment in more transport infrastructure and                              roads in Melbourne cost $4.6 billion.8 This means that
     services is currently the dominant means of responding                              if the public transport network did not exist, these
     to transport demand in Victoria.                                                    congestion costs could be far worse.910

     Public transport                                                                    We examined the external benefits of public transport for
                                                                                         Victoria in 2016 as a way of assessing the value that public
     A key part of the current efforts to manage demand                                  transport brings to the wider community (Box 1).
     is the provision of public transport which provides an
     alternative to road travel. Infrastructure Victoria analysis,
     based on average car occupancy in 2016, shows that
     at peak times in 2016, Melbourne’s public transport
     system removed around 540,000 vehicles from the road.6

         BOX 1: EXTERNAL BENEFITS OF PUBLIC TRANSPORT FOR VICTORIA
         We estimated the external benefits of public transport for Victoria by adopting an approach used by the NSW Independent
         Pricing and Regulatory Tribunal (IPART)9 in its determination of maximum public transport fares for Sydney.
         Using public transport leads to lower road congestion and lower pollution than if the trips were made by private vehicles.
         The methodology attempts to quantify external benefits of public transport as a way to measure the value that public
         transport brings to the wider community. IPART used this approach in NSW to determine what an appropriate public
         subsidy level should be for public transport – that is, how much should users pay and how much should be paid from
         general government revenue.
         To estimate the external benefits of public transport for Victoria, we undertook demand modelling using the Victorian
         Integrated Transport Model (VITM) to see how people might respond to changes in public transport fares. We then
         estimated the economic benefits of a change in public transport fares based upon how many people would shift
         from driving to public transport. Key external benefits quantified include:
         •   Reduced travel time                                               •    Reduced pollution
         •   Reduced vehicle operating costs                                   •    Increased health benefits

         This gives us an indication of the value of public transport to the Victorian community using standard economic techniques.
         Our indicative analysis suggests that the external benefits of public transport could be up to $2.5 billion in 2016.10

     6   This figure is based on an estimate of the number of public transport users in the peak period and a car occupancy rate of 1.38 in 2016.
     7   External benefits are benefits that accrue to people other than the individual using public transport – as a result of someone taking a trip on public transport
         rather than by car. For example, a benefit of public transport is reduced cars on the road that can result in increased safety for those driving.
     8   Bureau of Infrastructure, Transport and Regional Economics (2015), Information sheet 74: Traffic and congestion cost trends for Australian capital cities.
     9   The NSW Independent Pricing and Regulatory Tribunal provides independent regulatory advice and decisions to protect and promote the ongoing interests
         of consumers, taxpayers and citizens of NSW.
     10 The estimate is sensitive to different values of externalities. Depending on the rates assumed, the estimated benefit can range from $1.5 billion to $2.5 billion.

22       Infrastructure Victoria FIVE-YEAR FOCUS – IMMEDIATE ACTIONS TO TACKLE CONGESTION
Roads At the same time the Victorian Government entered
Victoria has an extensive network of tollways, freeways, into a Memorandum of Understanding with the City of
highways, arterials and local roads. A number of key Melbourne for a lump sum annual payment of $5 million
new projects that will help accommodate growing from the proceeds of the levy, with the funds to be spent
demand include: in accordance with the council’s transport strategy.
• North East Link – this project will connect the In 2014 the levy was expanded to cover both short and
Eastern Freeway and the M80 Ring Road. long stay non-exempt parking spaces and increased from
• West Gate Tunnel – this project will provide an $950 to $1,300. In 2015, an additional levy area was
alternative route from the West Gate Freeway to the added to the north and south of the city (category 2 levy)
CBD, including direct links to the Port of Melbourne. which was set at $950. The lump sum annual payment
• Outer Suburban Arterial Roads Program – this to the City of Melbourne was also increased to $7 million.
program includes a combination of duplication and A number of exemptions apply including residential
widening works to high-priority western arterial roads.
parking, hospital visitor parking, disabled parking and
loading bays. Exemptions also include parking at the
Parking charges Melbourne Zoo, temporary public parking at Yarra Park
and Melbourne and Olympic Parks and land owned
Car parking charges imposed by private companies, local by the Abbotsford Convent Foundation.
government and the Victorian Government increase the cost
of travel by car. Parking costs provide a disincentive to use Analysis shows that the levy has been successful
private vehicles and are therefore a key lever for government in reducing the supply of leviable car parking spaces
in managing demand. Analysis by the Grattan Institute found in affected areas, and it is correlated with a reduction
that Melbourne’s car parking costs were significantly lower in private vehicle mode share for trips in the CBD (see
than comparable cities such as Sydney11, and so using Appendix B). Between 2015 and 2017, there has been
parking costs to better manage transport demand likely a 2% reduction in the number of leviable car parking
represents a particular opportunity for Melbourne. spaces in category 1 zones, and a 9% reduction of
spaces in category 2 zones. This is estimated to be
In 2006, the Victorian Government introduced a around 3,900 vehicles off the road in the morning peak
“congestion levy” (the levy) on non-exempt long stay period in 2017 compared to 2015. By way of comparison,
car spaces in the Melbourne CBD. It was intended two lanes of freeway would need to be built to accommodate
to reduce traffic congestion in central Melbourne by an additional 3,900 peak period vehicles on the road
increasing the cost of driving and therefore encouraging network. The recent widening of CityLink effectively added
more motorists to regularly use public transport.12 an extra lane in each direction, with an estimated cost
of nearly $1.3 billion.
The levy is currently indexed annually in line with the
consumer price index.
11 In its report, Stuck in traffic? Road congestion in Sydney and Melbourne
the Grattan Institute found that Melbourne’s CBD has 15% more
commercial car spaces than Sydney and that parking is cheaper. For
instance, the Grattan Institute found that all day early bird parking in
Melbourne costs an average of $17.74 per day compared with $27.74
in Sydney. State government levies are also cheaper in Melbourne
compared to Sydney at $1,380 per year compared to $2,390 in Sydney.
12 The second reading speech for the Congestion Levy Act 2005 states
that the levy will provide an incentive for those currently commuting by
car to and from the city during peak hours to look at other options, such
as car pooling, public transport and walking.
23Public transport fares Land use planning
Given the important role played by public transport The strategic land use settings put in place by government
in managing transport demand, it follows that a major – such as in Plan Melbourne – also influence demand for
lever for government is the price or fare charged for the transport network, albeit mostly in the longer term
public transport. as Melbourne grows and changes in line with strategic
settings. For example, a land use planning strategy that
Fares manage demand by altering the price of public
aims to locate jobs and services close to where people live
transport relative to alternative modes, as well as the price
may reduce demand for transport because people will have
of travel on public transport at different times of the day.
less distance to travel to get to their destination. Some of
Currently in Melbourne, there are two fare features that
the land use settings in Plan Melbourne that may ultimately
could be viewed as particular demand management tools:
reduce demand for travel across the city include:
• Early bird train travel – introduced in March 2008,
• supporting new housing in activity centres and other
early bird train travel provides free travel on Melbourne
places that offer good access to jobs, services and
metropolitan train services if passengers touch their
public transport
myki on and off before 7.15am on a weekday. It is
estimated to have encouraged between 2,000 and • locating schools and other regional facilities near
2,600 passengers to shift from the peak to pre-peak existing public transport
travel period.13 • facilitating investment in Melbourne’s outer areas
• Peak/off-peak pricing on V/Line – peak fares apply to increase local access to employment.
to any myki journey where the customer touches off
in Zone 1 before 9.00am on weekdays or touches on
in Zone 1 between 4.00pm and 6.00pm on weekdays.
Opportunities for better
All other journeys including travel on public holidays demand management
and weekends are covered by an off-peak fare; the
discount for off-peak travel is 30%. Analysis of future transport demand forecasts from MABM
suggests the Victorian Government will need to take
additional action in the short term in order to minimise
Road regulation
predicted increases in travel times and declines in reliability
Government can also influence transport demand through in particular parts of the network.
the way it manages the use of Victoria’s road network with In developing recommendations to government, the
measures such as road rules, clearways, priority lanes for decision-making framework developed by Infrastructure
public transport and allocation of reserved freeway lanes Victoria to support Victoria’s 30-year infrastructure strategy
for high occupancy vehicles. A range of such measures can usefully be applied to managing transport demand.
is in place across Melbourne, with a mixture of state Box 2 outlines the framework.
and local government jurisdiction.
13 As cited in Currie (2011), Design and impact of a scheme to spread
peak rail demand using pre-peak fares.
24 Infrastructure Victoria FIVE-YEAR FOCUS – IMMEDIATE ACTIONS TO TACKLE CONGESTIONBOX 2: A DECISION-MAKING FRAMEWORK FOR MANAGING TRANSPORT DEMAND
The major categories of potential government action to manage demand, in order of preference, are:
1. Shifting demand
Changing behaviours to shift demand can help relieve pressure on the transport network. These solutions are
most needed where infrastructure use is heavy at different times of the day or across particular parts of the network,
but much lower at other times or locations. In other words, to rationalise our use of infrastructure to its highest value.
Rather than building something new and providing additional capacity during peak periods and locations, these
options seek to shift demand either by spreading it more evenly, reducing it overall or moving to another mode
of transport where there is capacity.
Tools that are available to provide incentives or disincentives for how people use infrastructure include:
• pricing to influence decision making, for example, road pricing or public transport fares
• providing better information to help people make informed choices, such as real-time information across
the entire transport network to help people plan their journey
• long-term strategic planning settings establishing guidelines for where people live and work.
2. Better use of existing infrastructure
There are many opportunities to use existing transport infrastructure in better, more efficient ways. Most of the
infrastructure we will have in the future exists now. This means we need to be smart about how we operate
and maintain our existing infrastructure to ensure it lasts and is responsive to changing needs.
This can be achieved through:
• better coordination, regulation and governance processes so services can be delivered efficiently
• technological innovations to adapt to changing service delivery models
• regulatory changes that enable or prohibit certain choices, such as road rules
• refurbishment, modifications or whole-of-life maintenance that improves the operation and efficiency
of the infrastructure.
3. Invest in new networks and services
Building new infrastructure is appropriate in areas of demonstrated under supply where net benefit can be proven,
and when shifting demand and better use solutions have been exhausted or found not to be viable. Examples include
extending the rail network to high growth areas, providing new bus services or improving road connectivity.
This broad approach is supported by the Victorian Auditor-General’s 2013 audit on Managing Traffic Congestion,
which noted that:
“…the state’s approach to congestion management remains dominated by
expensive supply-side initiatives focussed on increasing capacity with little
evident attention to demand management alternatives…there is a pressing
need to explore more fiscally sustainable strategies that leverage demand
management to tackle Melbourne’s growing congestion.”
25Measures that reduce demand by shifting it towards other Because our focus is on short term actions, we have
modes or times of the day, or by increasing supply, will prioritised measures which are low cost and practical
eventually lose effectiveness as new demand for road travel to implement over the next five years. We emphasise
emerges as capacity increases over time (via ‘induced’ opportunities in Melbourne’s public transport system
or ‘generated’ demand). See Box 3. Infrastructure Victoria and car parking costs. A comprehensive and efficient
recommends network pricing as the best long-term public transport system is essential to effectively manage
solution. However the measures proposed in this report transport demand going forward, including if and when
will deliver interim improvements in targeted areas, and network pricing is introduced. Where good public transport
more enduring travel time savings and reliability benefits is in place, increased parking costs can mirror the impact
for those people who opt to shift their time or mode of direct pricing and deliver significant reductions in car
of travel. Our community research indicates this could trips. We also identify opportunities for reform in the areas
be up to a third of Melbourne’s peak travellers. of active transport, behaviour change and the regulation
and management of roads.
BOX 3: ROAD SUPPLY AND INDUCED DEMAND
Most measures that divert demand away from existing roads, either by building new roads or creating capacity on the
road network by people switching to public transport, will not permanently reduce congestion. Eventually these measures
lose their effectiveness as new demand is generated through trips diverted from other times or modes, and new trips are
generated as travel times improve. There is a wide body of literature that discusses these effects e.g. see the Victorian
Transport Policy Institute analysis at vtpi.org/gentraf.pdf.
This does not mean that any new roads or public transport investments cannot have an impact on congestion at the
network level. The development of a complete and efficient road and public transport network is a pre-requisite for
a well-functioning city. Where there are demonstrated gaps in a city’s network (such as the North East Link), these
should be filled and can have an enduring positive impact on overall transport system performance.
Due to induced demand, however, continued expansion of the transport network is unlikely to deliver reasonable travel
times and reliability within reasonable cost. In the long term, a comprehensive and fair transport network pricing regime
could directly target demand at its source and deliver permanent reductions in demand, while optimising the network.
26 Infrastructure Victoria FIVE-YEAR FOCUS – IMMEDIATE ACTIONS TO TACKLE CONGESTION27
4. Shifting demand

     RECOMMENDATIONS                                                Off-peak public transport fares
     1. EXPAND OFF-PEAK FARES ON THE                               Public transport fares directly impact the way people
         METROPOLITAN PUBLIC TRANSPORT NETWORK                      choose to use the system. We have identified some short-
                                                                    term opportunities with fares to both encourage mode shift
      Introduce a small difference between peak and
                                                                    from private vehicles and to better manage demand during
      off-peak fares as part of the regular planned fare            peak times on the public transport network. In the longer
      rise in January 2019, and adjust this annually                term, there will be a need for a comprehensive review of
      to balance peak and off-peak travel                           the way that public transport fares are set and structured
                                                                    to support efficient outcomes across the whole of the
     2. EXPAND AND INCREASE THE CAR PARKING LEVY                   transport system.
      Expand the Category 2 levy area to include                    Differential peak and off-peak pricing is about having
      Richmond, South Yarra, Windsor and Prahran                    a different price for travel in the peak compared to the
                                                                    off-peak. It has the potential to shift demand both across
      Establish revenue sharing arrangements
                                                                    the day and modes directly and indirectly – directly by
      with each local council covered by the levy                   encouraging time-flexible trips outside of peak times and
      Regularly review and increase the levy to reflect             indirectly by freeing up capacity during the peak period
      increasing congestion                                         to support mode shift from away from private vehicles.
                                                                    Its potential effectiveness is even greater when combined
     3. MAXIMISE OPPORTUNITIES TO ENCOURAGE                        with other time and mode shift recommendations.
         TRAVEL BEHAVIOUR CHANGE DURING                             In Melbourne, around 60% of public transport travel
         DISRUPTIONS TO THE TRANSPORT NETWORK                       in 2016 occurred at peak times, equivalent to around
                                                                    one million peak boardings across all public transport
      Increase bus services on Doncaster bus
                                                                    modes. The trends are similar across all public transport
      routes and maintain bus priority along the                    modes (Figure 10) suggesting there is ample capacity
      Eastern Freeway during North East Link                        or underutilisation of the system in off-peak travel periods.
      construction disruptions

28     Infrastructure Victoria FIVE-YEAR FOCUS – IMMEDIATE ACTIONS TO TACKLE CONGESTION
Figure 10 Melbourne’s public transport travel profile across an average weekday in 2016
Tram Bus Train
120,000
100,000
80,000
Boardings
60,000
40,000
20,000
0
1 2 3 4 5 6 7 8 9 10 11 12 13 14 15 16 17 18 19 20 21 22 23 24 Source: Public Transport Victoria
Time of day
There is currently limited use of fares-based demand management on Melbourne’s public transport network. There
is no equivalent to the train ‘early bird’ product on metropolitan trams or buses, and there is no off-peak equivalent
in the afternoon. This is in contrast to V/Line, which has off-peak fares available at various parts of the day.
Peak and off-peak pricing is widely used across the world. Box 4 provides some examples.141516
BOX 4: NATIONAL AND INTERNATIONAL EXPERIENCE WITH OFF-PEAK
PUBLIC TRANSPORT FARES
Off-peak public transport fare regimes are widely used across the world in cities such as Singapore,
Berlin, London, Los Angeles, Sydney, Tokyo, Vancouver and Washington DC.
In 2013, Singapore’s Land Transport Authority trialled free and discounted travel on its mass rapid transit (MRT)
rail network for trips before the morning peak. Commuters had to end their journey before 7.45am for a free trip,
with a 50% discount for commuters exiting between 7.45am and 8.00am. After one year, the Authority reported
a 7% shift of trips out of the morning peak (8.00am-9.00am), with the ratio of trips in morning peak (8.00am-9.00am)
to pre-peak (7.00am-8.00am) falling from 2.7 to 2.1.14 This approach was recently changed. Now any trips which
are initiated before 7.45am on the MRT or light rapid transit networks will receive a 50% discount. This is yet to be
evaluated but the Authority is targeting a larger number of commuters (estimated at 300,000 or 10% of all rail
commuters in Singapore) who would never have considered completing a trip before 8.00am, but now have
the option of starting a trip before this time.15
An alternative approach is to apply a peak period surcharge, as is the case for London’s rail travel. Peak fares apply
Monday to Friday (not on public holidays) between 6.30am and 9.30am and between 4.00pm and 7.00pm.16
14 Singapore Land Transport Authority (2014), Extension of Free Pre-Peak Travel by One Year – media release from 9 May 2014.
15 Tan, S and Abdullah, Z (2017), Cheaper MRT rides for pre-peak weekday travel, article in the Strait times – published online on 31 October 2017.
16 See Transport for London’s website for more information, www.tfl.gov.uk/fares-and-payments/fares/peak-and-off-peak-times.
29We used MABM to test a scenario where there was This would enable data to be collected on the
a price difference between time periods by lowering responsiveness of travellers to the change which
off-peak fares (Box 5). could then be used to inform annual price adjustments.
The modelling showed that lowering off-peak fares would The introduction of differential peak and off-peak fares
result in both time and mode shift (to public transport). will be more effective in managing transport demand
This suggests introducing a difference between peak if teamed with increases in car parking charges.
and off-peak fares could help to manage transport Our community research has indicated that a third
demand. The size of the difference would likely need of people who drive during peak could use a different
to be adjusted over time to reflect the response of mode. The implementation of these two recommendations
Melbourne’s travellers to price changes. could provide a powerful prompt to people to change
their travel behaviour.
As a first step towards shifting
demand using the metropolitan
public transport system, Government
should introduce a small difference
between peak and off-peak fares
as part of the regular planned
fare rise in January 2019.
30BOX 5: INDICATIVE IMPACTS OF INTRODUCING A PEAK/OFF-PEAK
FARE DIFFERENCE
Infrastructure Victoria commissioned KPMG to model the potential impact of differential peak and off-peak fares
in MABM, testing a $0.50 difference between peak and off-peak average fares (equivalent to a reduction in average
fare per trip from $2.58 to $2.09 outside of peak periods).
The modelling showed that this could result in an extra 3,000 public
transport trips, equivalent to around 2,200 cars off the road. At the
same time, the modelling showed that it could shift around 3,000 trips
from peak to outside the peak periods, which is equivalent to more
than three train-loads of people.
As shown in Figure 11, a reduction in fares outside of peak periods results in an approximate reduction in peak period
public transport trips by around 0.5% to 1.5% on average as some users shift to off-peak travel. The modelling also
shows that some car users may also switch to using public transport, increasing the use of public transport services
across the day.
Indicative Infrastructure Victoria analysis suggests that this scenario could result in a revenue loss of around $70 million
to $80 million per annum.17 A revenue neutral outcome could be achieved by increasing peak fares to offset reductions
in off-peak fare revenue.
Figure 11 Change in public transport trips after lowering off-peak fares
Peak Periods
4%
Percentage change in public transport trips
3%
2%
1%
0%
-1%
-2%
5 6 7 8 9 10 11 12 13 14 15 16 17 18 19 20
Time of day
Source: KPMG
17
17 The change in fare revenue is based on a combination of patronage changes as a result of the different average fares in the peak and outside peak time
periods, as well as a result of the change in the fare prices itself. A 2015-16 network average fare, taking into account concessions and fare evasion, was
used in the analysis. A 20% lower fare was applied to the lower outside peak time periods fare scenario. This was annualised using a factor of 242 days
for peak periods and 357 days for off-peak periods.
31You can also read