Five Years of Whale Presence in the SOCAL Range Complex 2013-2017
←
→
Page content transcription
If your browser does not render page correctly, please read the page content below
Five Years of Whale Presence in the
SOCAL Range Complex 2013-2017
Simone Baumann-Pickering, Ally C. Rice, Jennifer S. Trickey,
John A. Hildebrand, Sean M. Wiggins, Ana Širović
Marine Physical Laboratory
Scripps Institution of Oceanography
University of California San Diego
La Jolla, CA 92037
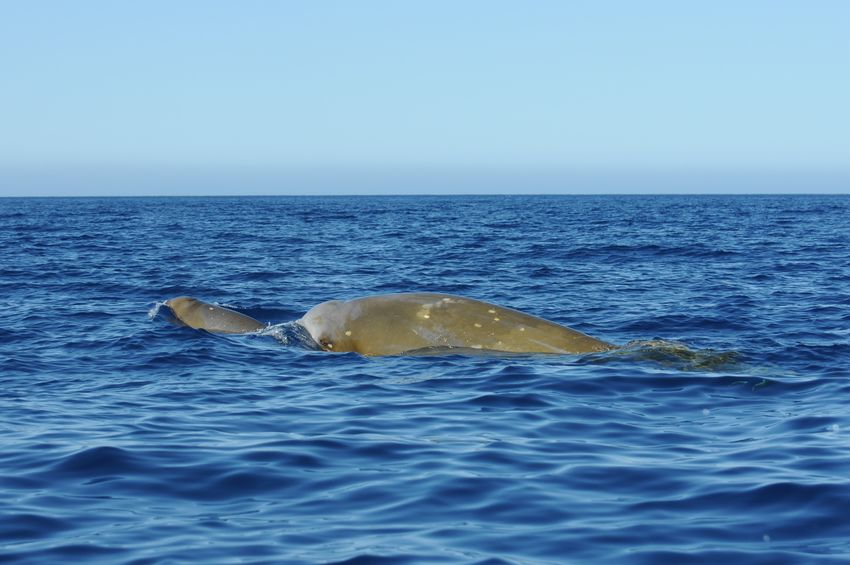
Cuvier’s beaked whales, Photo by Jennifer Trickey
MPL TECHNICAL MEMORANDUM #626
July 2018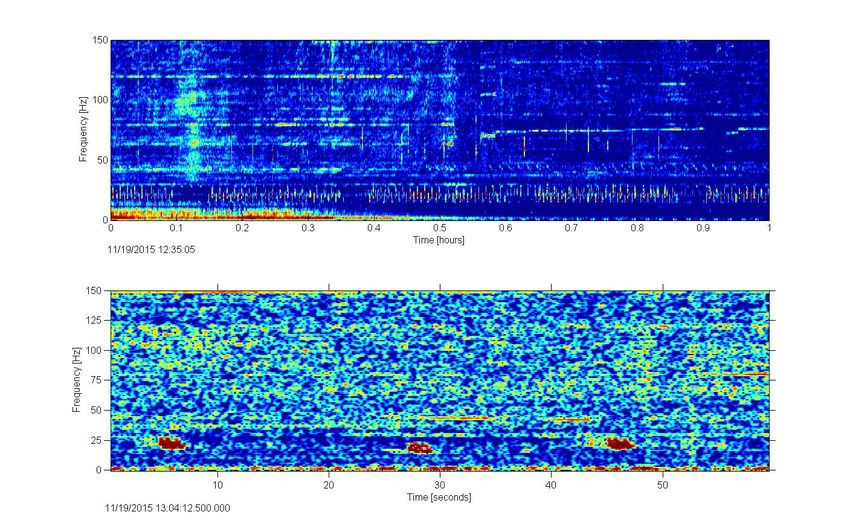
Suggested Citation:

Baumann-Pickering, S., Rice, A.C., Trickey, J.S., Hildebrand, J.A., Wiggins, S.M., and Širović, A.
     (2018) “Five Years of Whale Presence in the SOCAL Range Complex 2013-2017,” Marine
     Physical Laboratory, Scripps Institution of Oceanography, University of California San
     Diego, La Jolla, CA, MPL Technical Memorandum #626 under Cooperative Ecosystems
     Study Unit Cooperative Agreement N62473-17-2-0014 for U.S. Navy, U.S. Pacific Fleet,
     Pearl Harbor, HI.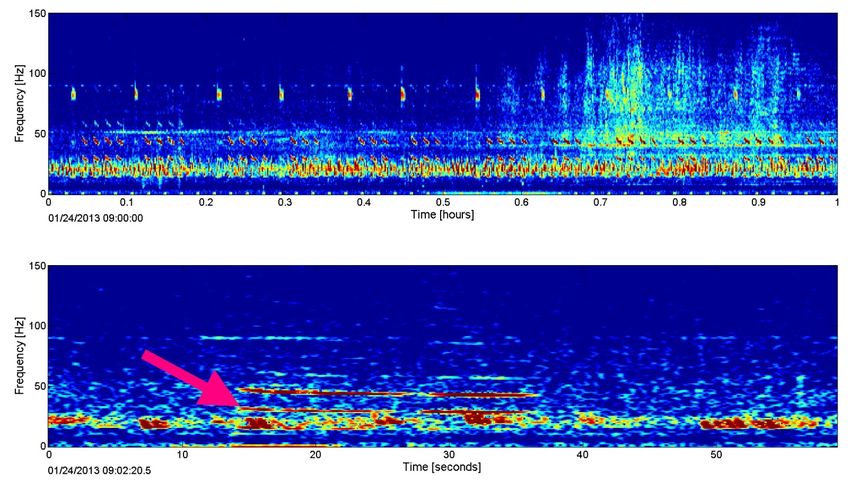
Table of Contents

Executive Summary ........................................................................................................................ 1
Project Background ......................................................................................................................... 2
Methods .......................................................................................................................................... 5
  Passive Acoustic Monitoring Recorders ....................................................................................... 5
  Data Collected ............................................................................................................................. 5
  Data Analysis .............................................................................................................................. 6
    Blue Whales ............................................................................................................................. 6
    Fin Whales ............................................................................................................................... 8
    Beaked Whales ...................................................................................................................... 10
Results .......................................................................................................................................... 13
  Mysticetes ................................................................................................................................. 13
    Blue Whales ........................................................................................................................... 13
    Fin Whales ............................................................................................................................. 13
  Beaked Whales .......................................................................................................................... 15
    Cuvier’s Beaked Whales ........................................................................................................ 15
    BW43 .................................................................................................................................... 15
Conclusions ................................................................................................................................... 18
References..................................................................................................................................... 20

                                                                                                                                                    i
List of Tables
Table 1. SOCAL Range Complex acoustic monitoring since January 2013...................................... 4
Table 2. Site P acoustic monitoring since January 2014. .................................................................. 4
Table 3: Summary of Cuvier’s beaked whale and BW43 FM pulse detections since 2013. ............ 15

List of Figures
Figure 1. SOCAL Range Complex with acoustic recorder site locations and bathymetric map......... 3
Figure 2. Blue whale B calls in Long-term Spectral Average (LTSA) and an individual call recorded
at site N. .......................................................................................................................................... 7
Figure 3. Blue whale D calls from site H in the analyst verification stage of the detector. ................ 8
Figure 4. Fin whale 20 Hz calls in an LTSA and spectrogram recorded at site P. ............................. 9
Figure 5. Echolocation sequence of Cuvier’s beaked whale in an LTSA, example FM pulse in a
spectrogram, and corresponding time series recorded at site N. ..................................................... 11
Figure 6. Echolocation sequence of BW43 in an LTSA, example FM pulse in a spectrogram and
corresponding time series recorded at site N. ................................................................................. 12
Figure 7. Weekly presence of NE Pacific blue whale B calls, NE Pacific blue whale D calls, and fin
whale 20 Hz acoustic index between January 2013 and June 2017 at sites H, M, N and P.............. 14
Figure 8. Weekly average daily detections in minutes of Cuvier’s beaked whale and BW43 FM
pulses between January 2013 and June 2017 at sites H, M, and N. ................................................. 16
Figure 9. Cuvier’s beaked whale FM pulses in one-minute bins at sites H, M, and N.. ................... 17
Figure 10. BW43 FM pulses in five-minute bins at sites H and N. ................................................. 18

                                                                                                                                                     ii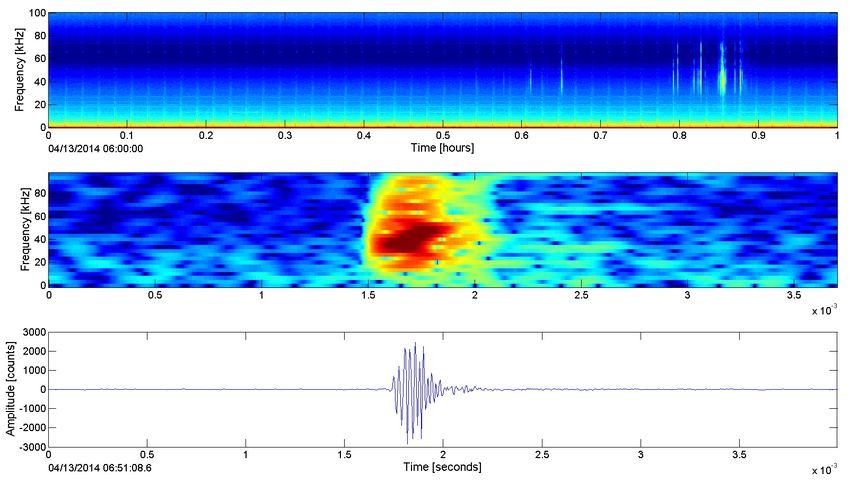
Executive Summary

Passive acoustic monitoring was conducted in the Navy’s Southern California Range Complex from
January 2013 to June 2017 to detect marine mammal sounds. High-frequency Acoustic Recording
Packages (HARPs) recorded sounds between 10 Hz and 100 kHz at four locations: west of San
Clemente Island (1,000 m depth, site H), south of San Clemente Island (1200 m depth, site N),
northwest of San Clemente Island (900 m depth, site M) and west of La Jolla, California (500 m
depth, site P).

While a typical southern California marine mammal assemblage is consistently detected in these
recordings (Hildebrand et al., 2012), only occurrence of acoustic signals from a select sub-set of
species including blue whales, fin whales, and beaked whales were analyzed for this report.

Data analysis was performed using automated computer algorithms. Calls of two baleen whale
species were detected: blue whale B calls and D calls, and fin whale 20 Hz calls. Both species were
present at all sites but call detections and the fin whale acoustic index representative of 20 Hz calls
were highest at sites H and N, sites that also had the largest detection range. Blue whale B call
detections peaked from September to December and very few B calls were detected after January.
Blue whale D calls peaked in May and June. The fin whale acoustic index was highest from
October to April.

Frequency-modulated (FM) echolocation pulses from Cuvier’s beaked whales were regularly
detected at sites H, M, and N but were most common at site H. Detections were highest in spring
and fall with a low in summer. Site H had particularly high numbers of detections in spring of 2016.
There was an additional beaked whale-like FM pulse type, BW43, possibly produced by Perrin’s
beaked whale (Baumann-Pickering et al., 2014), that was detected infrequently during winter at site
N and rarely at site H. No other beaked whale signal types were detected, and there were no beaked
whale detections at site P.

                                                                                                      1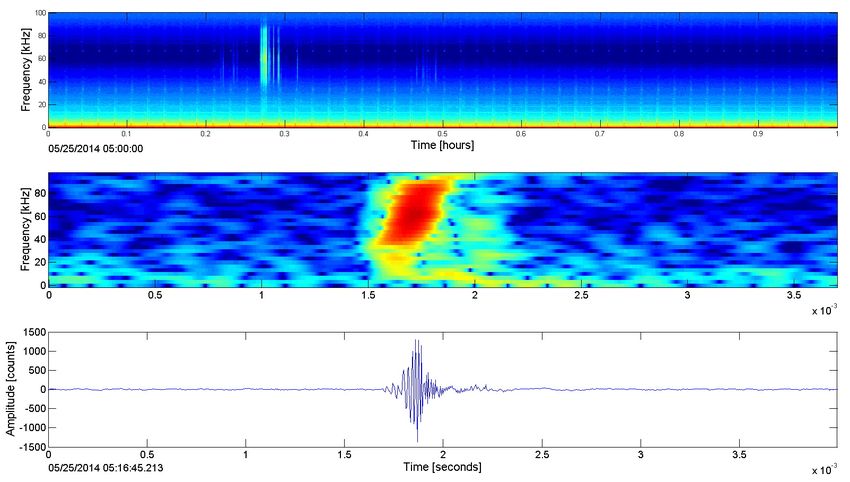
Project Background

The Navy’s Southern California (SOCAL) Range Complex is located in the Southern California
Bight and the adjacent deep waters to the west. This region has a highly productive marine
ecosystem due to the southward flowing California Current, and associated coastal current system.
A diverse array of marine mammals is found here, including baleen whales, beaked whales and
other toothed whales and pinnipeds.

In January 2009, an acoustic monitoring effort was initiated within the SOCAL Range Complex
with support from the U.S. Pacific Fleet. The goal of this effort was to characterize the vocalizations
of marine mammal species present in the area, determine their seasonal presence, and evaluate the
potential for impact from naval training. In this current effort, the goal was to explore the seasonal
presence of a subset of species of particular interest, including blue and fin whales, as well as
beaked whales, over the last five years of monitoring effort.

This report documents the analysis of data recorded by High-frequency Acoustic Recording
Packages (HARPs) that were deployed at four sites within the SOCAL Range Complex and
collected data between January 2013 and June 2017. Three of the four recording sites surround San
Clemente Island, site H to the west, site M to the northwest and site N to the south and one is west
of La Jolla, California (site P; Figure 1). Analysis of data included recordings from sites H and N
collected from January 2013 through June 2017 (Table 1), recordings at site M from January 2013
through February 2015, and site P recordings from January 2014 through May 2017 (
Table 2).

                                                                                                     2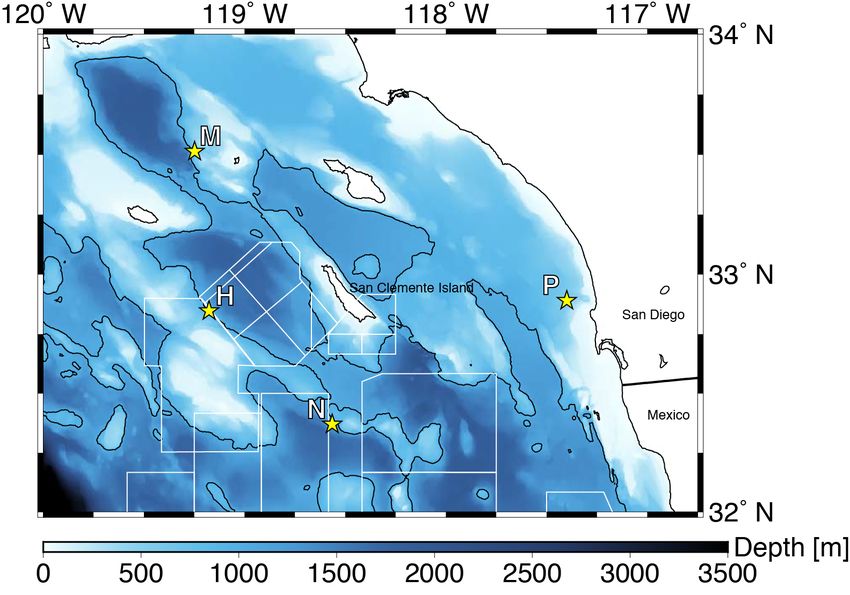
Figure 1. SOCAL Range Complex with acoustic recorder site locations and bathymetric map.
Acoustic recorder locations are shown as yellow stars at sites H, M, N and P. White polygons are Navy
operational areas. Black contours are coastlines and 1000 m depth. Darker colors are deeper.

                                                                                                    3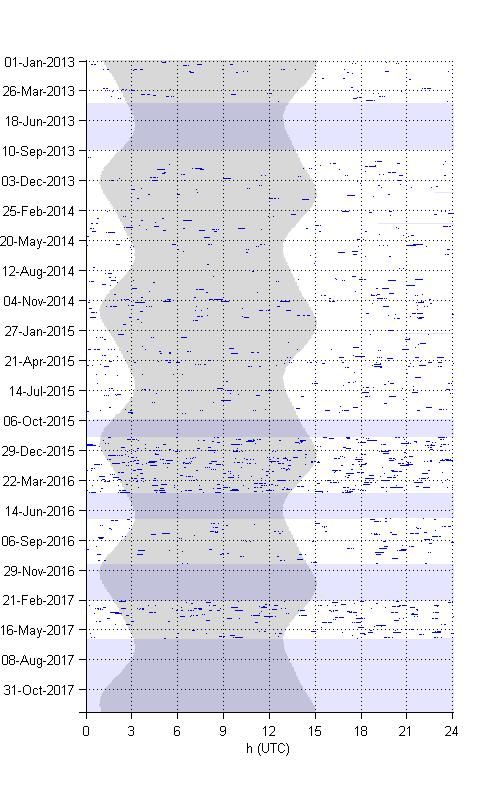
Table 1. SOCAL Range Complex acoustic monitoring since January 2013.
Dates in italics were only used for high frequency analysis.
Deployment        Site H                         Site M           #           Site N
  Name       Monitoring Period   # Hours    Monitoring Period   Hours    Monitoring Period   # Hours
                12/21/12 –                     12/20/12 –
SOCAL 48                          3140                          3041     12/20/12 – 5/1/13    3155
                  4/30/13                      4/25/2013
SOCAL 49             -              -       4/30/13 – 9/5/13    3057     5/2/13 – 9/11/13     3156
SOCAL 50     9/10/13 – 1/6/14     2843       9/9/13 – 1/6/14    2852             -              -
SOCAL 51     1/7/14 – 4/3/14      2082       1/6/14 – 4/4/14    2110     1/7/14 – 2/16/14      956
SOCAL 52     4/4/14 – 7/30/14     2814      4/4/14 – 5/29/14    1324     4/4/14 – 7/30/14     2817
SOCAL 53         7/30/14 –
                                  2340      7/30/14 – 11/3/14   2319     7/30/14 – 11/5/14    2342
                  11/5/14
SOCAL 54     11/5/14 – 2/4/15     2198      11/4/14 – 2/5/15    2233      11/4/14 -2/5/15     2196
SOCAL 55     2/5/15 – 6/1/15      2800             -              -       2/5/15 – 2/23/15     433
SOCAL 56     6/2/15 – 10/3/15     2952             -              -       6/2/15 – 10/3/15    2966
SOCAL 57                                                                      10/3/15 –
                     -                 -            -             -                           1168
                                                                              11/21/15
SOCAL 58    11/21/15 –                                                       11/21/15 –
                                  3734              -             -                           3578
             4/25/16                                                           4/18/16
SOCAL 59 7/6/16 – 11/9/16         3011              -              -      7/7/16 – 11/8/16    2999
SOCAL 60         -                  -               -              -     11/9/16 – 2/21/17    2457
SOCAL 61 2/22/17 – 6/6/17         2518              -              -      2/21/17 – 6/7/17    2528
  Totals                          30432                         16936                         30751
                                 (1268.0                        (705.7                       (1281.3
                                  days)                         days)                         days)

Table 2. Site P acoustic monitoring since January 2014.

  Deployment            Site P
    Name           Monitoring Period         # Hours
    LJ 23       1/25/2014 – 3/4/2014           936
    LJ 26       3/6/2014 – 6/27/2014           2711
    LJ 31         6/2/15 – 9/18/15             2593
    LJ 32        9/25/15 – 10/19/15            574
    LJ 33       10/20/15 – 11/20/15            747
    LJ 34         11/20/15 – 3/1/16            2448
    LJ 35         4/9/16 – 8/10/16             2971
    LJ 36        8/12/16 – 10/26/16            1803
    LJ 37                 -                      -
    LJ 38                 -                      -
    LJ 39         2/14/17 – 5/24/17            2377
                                              71160
    Total
                                           (715.0 days)

                                                                                                     4
Methods
Passive Acoustic Monitoring Recorders
High-frequency Acoustic Recording Packages (HARPs; Wiggins and Hildebrand, 2007) have been
used to record marine mammal, ambient, and anthropogenic sounds in the SOCAL Range Complex.
HARPs are autonomous, battery-operated instruments capable of recording underwater sounds from
10 Hz to 100 kHz continuously over long periods (up to ~1 year) to provide a comprehensive time
series of the marine soundscape. HARPs are configurable into standard large oceanographic-style
moorings, medium or small moorings, and seafloor mounted instrument frames, all of which use a
releasable ballast-weight anchor to secure the instrument to the sea floor until planned recovery. A
combination of these configurations was used in the SOCAL Range Complex, and was chosen
depending on deployment and site requirements.
To capture underwater sounds, HARPs use hydrophones tethered and buoyed approximately 10 –
30 m above the seafloor. The hydrophones typically used were constructed with two channels, one
for low-frequency sounds (2 kHz) with
different lead-zirconium-titanate (PZT) ceramic elements and different preamplifier, filter, and
signal conditioning electronics for each channel. Each hydrophone’s electronic circuit board was
calibrated in the laboratory at Scripps Institution of Oceanography and representative data loggers
with complete hydrophones were full-system calibrated at the U.S. Navy’s Transducer Evaluation
Center in San Diego, CA to provide the full-band frequency response of the system so that accurate
sound pressure levels can be measured from the recordings.
Acoustic data were recorded to an array of standard laptop computer style 2.5” hard disk drives in a
compressed format. Upon instrument recovery, used batteries and disk drives were removed and
replaced with new batteries and empty disk drives along with a new ballast-weight anchor to ready
the HARP for the next deployment.

Data Collected
Acoustic recordings have been collected at three offshore sites within the SOCAL Range Complex
since January 2013 (Table 1) and one off La Jolla, CA since January 2014 (
Table 2) using HARPs sampling at 200 kHz. The sites are designated site H (32° 56.76N, 119°
10.57W, depth 1,000 m), site M (33° 30.58N, 119° 15.28W, depth 900 m), site N (32° 22.21N, 118°
33.85W, depth 1,200 m), and site P (32° 53.40N, 117° 24.006W, depth 500 m).
Site H yielded data from January 1, 2013 to June 6, 2017. Site M yielded data from January 1, 2013
to February 5, 2015. Site N yielded data from January 1, 2013 to June 7, 2017. Data recording
occurred at site P from January 25, 2014 to May 24, 2017. The recordings at these four sites varied
in data quality over the monitoring period described here. Specifics about data quality have been
described in previous annual reports (Debich et al., 2015a; Debich et al., 2015b; Širović et al.,
2016; Rice et al., 2017; Rice et al., 2018). For all four sites, a total of 95,279 hours, covering 3,970
days of acoustic data were recorded in the deployments analyzed in this report.

                                                                                                      5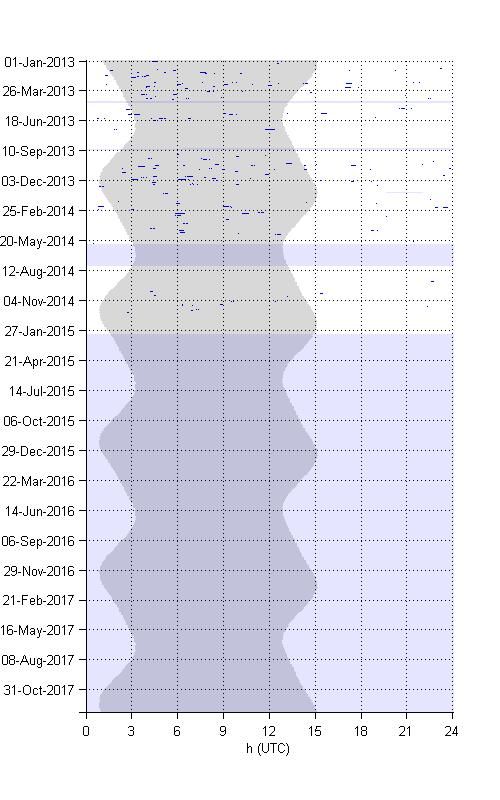
Data Analysis
Recording over a broad frequency range of 10 Hz to 100 kHz allows detection of baleen whales
(mysticetes) and toothed whales (odontocetes). All analyses were conducted using appropriate
automated detectors for whale sound sources. Analysis was focused on the following species: blue
whales (Balaenoptera musculus), fin whales (B. physalus), and Cuvier’s beaked whales (Ziphius
cavirostris). In addition, the data were screened for signals from Blainville’s (Mesoplodon
densirostris) and Stejneger’s (M. stejnegeri) beaked whales, as well as for FM pulse types known as
BW40, BW43, and BW70, which may belong to Hubbs’ (M. carlhubbsi), Perrin’s (M. perrini), and
pygmy beaked whales (M.peruvianus), respectively (Baumann-Pickering et al., 2014). Individual
blue whale B calls, D calls, and beaked whale echolocation clicks were detected automatically using
computer algorithms. Presence of fin whale 20 Hz calls was detected using an energy detection
method and is reported as a daily average, termed the ‘fin whale acoustic index’ (Širović et al.,
2015). Details of all automatic detection methods are described below.
In this report we summarize results of the acoustic analysis on data collected between January 2013
and June 2017 at sites H, M, N, and P. We also discuss seasonal occurrence, interannual variability,
and relative abundance of calls for different species that were consistently identified in the data.

Blue Whales
Blue whales produce a variety of calls worldwide (McDonald et al., 2006). Calls recorded in the
eastern North Pacific include the Northeast Pacific blue whale B call (Figure 2) and the D call
(Figure 3). Northeast Pacific blue whale B calls are geographically distinct and potentially
associated with mating functions (McDonald et al., 2006; Oleson et al., 2007). They are low-
frequency (fundamental frequency  10 s) calls that are often regularly
repeated. D calls are downswept in frequency (approximately 100-40 Hz) with a duration of several
seconds. These calls are similar worldwide and are assocaited with feeding animals; they may be
produced as call-counter call between multiple animals (Oleson et al., 2007).

Northeast Pacific blue whale B calls
Blue whale B calls (Figure 4) were detected automatically using spectrogram correlation (Mellinger
and Clark, 1997). The detection kernel was based on frequency and temporal characteristics
measured from 30 calls recorded in the data set, each call separated by at least 24 hours. The kernel
was comprised of four segments, three 1.5 s and one 5.5 s long, for a total duration of 10 s. Since
blue whale calls change over time (McDonald et al., 2009; Širović, 2016), separate kernels were
measured for summer and fall periods (see details in previous reports by Debich et al., 2015a;
Debich et al., 2015b; Širović et al., 2016; Rice et al., 2017; Rice et al., 2018). As example of this
change, the fall 2012 kernel was defined as sweeping from 46.8 to 45.8 Hz; 45.8 to 45.1 Hz, 45.1 to
44.9 Hz, and 44.9 to 44.3 Hz, whereas the fall 2016 kernel was defined as 46.0 to 45.4 Hz; 45.4 to
44.7 Hz, 44.7 to 44.1 Hz, and 44.1 to 43 Hz. The kernel bandwidth was 2 Hz. Total numbers of
detections are reported for this call type.

                                                                                                    6
Figure 2. Blue whale B calls in Long-term Spectral Average (LTSA; top) and an individual call shown
in a spectrogram (bottom) recorded at site N.
7Blue whale D calls
Blue whale D calls (Figure 3) were detected using an automatic algorithm based on the generalized
power law (Helble et al., 2012). This algorithm was adapted for the detection of D calls by
modifying detection parameters that included the frequency space over which the detector operates.
A trained analyst subsequently verified the detections (Figure 3).
Figure 3. Blue whale D calls from site H in the analyst verification stage of the detector.
Green along the bottom evaluation line indicates true detections and red indicates false detections.
Fin Whales
Fin whales produce short (~ 1 s duration), low-frequency calls. The most common is a frequency
downsweep from 30-15 Hz called the 20 Hz call, although they also produced a higher frequency
version called 40 Hz calls (Watkins, 1981). 20 Hz calls can occur at regular intervals as song
(Thompson et al., 1992), or irregularly as call counter-calls among multiple, traveling animals
(McDonald et al., 1995).
Fin whale 20 Hz calls
Fin whale 20 Hz calls (Figure 4) were detected automatically using an energy detection method
(Širović et al., 2015). The method uses a difference in acoustic energy between signal and noise,
calculated from a long-term spectral average (LTSA) calculated over 5 s with 1 Hz frequency
resolution. The frequency at 22 Hz was used as the signal frequency, while noise was calculated as
the average energy between 10 and 34 Hz. The resulting ratio is termed ‘fin whale acoustic index’
and is reported as a daily average score. All calculations were performed on a logarithmic scale.
8Figure 4. Fin whale 20 Hz calls in an LTSA (top) and spectrogram (bottom) recorded at site P.
9Beaked Whales
Beaked whales found in the Southern California Bight include Baird’s (Berardius bairdii),
Cuvier’s, Blainville’s, Stejneger’s, Hubbs’, Perrin’s, and pygmy beaked whales (Jefferson et al.,
2008; Jefferson et al., 2015).
Beaked whales can be identified acoustically by their echolocation signals (Baumann-Pickering et
al., 2014). These signals are frequency-modulated (FM) upswept pulses, which appear to be species
specific and are distinguishable by their spectral and temporal features. Identifiable signals are
known for Baird’s, Blainville’s, Cuvier’s, and likely Stejneger’s beaked whales (Baumann-
Pickering et al., 2013b).
Other beaked whale signals detected in the Southern California Bight include FM pulses known as
BW40, BW43, and BW70, which may belong to Hubbs’, Perrin’s, and pygmy beaked whales,
respectively (Baumann-Pickering et al., 2013a; Baumann-Pickering et al., 2014). Only Cuvier’s and
BW43 signals were detected during this recording period at the respective sites and their signals are
described below in more detail.
Beaked whale FM pulses were detected with an automated method. This automated effort was for
all identifiable signals found in Southern California except for those produced by Baird’s beaked
whales because they produce a signal with a lower frequency content than is typical of other beaked
whales and therefore are not reliably identified by the detector used. After all echolocation signals
were identified with a Teager Kaiser energy detector (Soldevilla et al., 2008; Roch et al., 2011b), an
expert system discriminated between delphinid clicks and beaked whale FM pulses.
A decision about presence or absence of beaked whale signals was based on detections within a 75
second segment. Only segments with more than seven detections were used in further analysis. All
echolocation signals with a peak and center frequency below 32 and 25 kHz, respectively, a
duration less than 355 µs, and a sweep rate of less than 23 kHz/ms were deleted. If more than 13%
of all initially detected echolocation signals remained after applying these criteria, the segment was
classified to have beaked whale FM pulses. This threshold was chosen to obtain the best balance
between missed and false detections. A third classification step, based on computer assisted manual
decisions by a trained analyst, labeled the automatically detected segments to pulse type and
rejected false detections (Baumann-Pickering et al., 2013a). The rate of missed segments was
approximately 5%, varying slightly between deployments. The start and end of each segment
containing beaked whale signals was logged and their durations were added to estimate cumulative
weekly presence.
10Cuvier’s Beaked Whales
Cuvier’s beaked whale echolocation signals are well differentiated from other species’ acoustic
signals as polycyclic, with a characteristic FM pulse upsweep, peak frequency around 40 kHz, and
uniform inter-pulse interval of about 0.4 – 0.5 s (Johnson et al., 2004; Zimmer et al., 2005). An
additional feature that helps with the identification of Cuvier’s FM pulses is that they have
characteristic spectral peaks around 17 and 23 kHz (Figure 5).
Figure 5. Echolocation sequence of Cuvier’s beaked whale in an LTSA (top) and example FM pulse
in a spectrogram (middle) and corresponding time series (bottom) recorded at site N.
11BW43
The BW43 FM pulse type has yet to be positively linked to a specific species. These FM pulses are
distinguishable from other species’ signals by their peak frequency around 43 kHz and uniform
inter-pulse interval around 0.2 s (Baumann-Pickering et al., 2013a) (Figure 6). A candidate species
for producing this FM pulse type may be Perrin’s beaked whale (Baumann-Pickering et al., 2014).
Figure 6. Echolocation sequence of BW43 in an LTSA (top) and example FM pulse in a spectrogram
(middle) and corresponding time series (bottom) recorded at site N.
12Results
The results of the seasonal occurrence and relative abundance of marine mammal acoustic signals at
sites H, M, N, and P from January 2013 through June 2017 are summarized below.
Mysticetes
Blue and fin whale calls recorded between January 2013 and June 2017 were detected using
automated methods. Details of each species’ presence at multiple sites are given below.
Blue Whales
Blue whale calls were detected at all sites and were most prevalent during the summer and fall.
• Northeast (NE) Pacific blue whale B calls were typically detected from summer through late
winter with a peak in November. (Figure 7).
• Site P had substantially higher numbers of NE Pacific blue whale B calls than sites H and N
in summer and fall of 2014; however, in the years 2015-2017 these numbers decreased
substantially (Figure 7). Interestingly, the detection range at site P was the lowest across
sites (Širović et al., 2015) meaning that site P had the highest density of blue whale B calls.
• Sites H and N had relatively stable numbers of NE Pacific blue whale B calls across all
recording years; detections at site M were low in 2013.
• NE Pacific D call detections occurred between March and December but were highest from
May through June at all sites (Figure 7).
• There was a strong increase in NE Pacific D call detections at sites H and N in 2017 while
there was nearly a complete lack of detections at site P during that time. D call detections
peaked at site P in 2015 (Figure 7).
• There was no clear diel pattern in any blue whale calls at any site (Debich et al., 2015a;
Debich et al., 2015b; Širović et al., 2016; Rice et al., 2017; Rice et al., 2018).
Fin Whales
Fin whales were detected through most of the recordings at all sites. Only 20 Hz calls were
analyzed for this report.
• Fin whale acoustic index (representative of 20 Hz calls) peaked in late fall or early winter at
all sites and it was typically low during the summer months.
• Across years, highest level of the acoustic index occurred in the winter of 2013/2014 and
2016/2017. It was generally low in the winter of 2015/2016 (Figure 7).
• Highest values of fin whale acoustic index were measured at site H, the site with
intermediate size of the overall detection area (Širović et al., 2015).
13Figure 7. Weekly presence of A) NE Pacific blue whale B calls (note the different vertical axis scale for
site P), B) NE Pacific blue whale D calls, and C) Fin whale 20 Hz acoustic index between January 2013
and June 2017 at sites H, M, N and P. Gray dots represent percent of effort per week in weeks with
less than 100% recording effort, and gray shading represents periods with no effort. Where gray dots
or shading are absent, full recording effort occurred for the entire week.
14Beaked Whales
Cuvier’s beaked whales were detected throughout the recording period. The FM pulse type, BW43,
possibly produced by Perrin’s beaked whales (Baumann-Pickering et al., 2014) was detected only
occasionally. No other beaked whale species were detected during this recording period. More
details of each species’ presence at the four sites are given below.
Cuvier’s Beaked Whales
Cuvier’s beaked whale was the most commonly detected beaked whale in the SOCAL Range
Complex.
• Cuvier’s beaked whale FM pulses were detected most commonly at site H and less
commonly at sites M and N (Figure 8, Table 3). There were no detections at site P.
• Detections were highest during fall through spring with a summer dip in presence (Figure 8).
• There was no discernable diel pattern for Cuvier’s beaked whale detections (Figure 9).
BW43
Overall, there were very few detections of BW43 FM pulses.
• BW43 FM pulses were most regularly detected at site N and to a lesser degree at site H.
There were no detections at sites M and P (Figure 8, Table 3).
• BW43 FM pulses occurred during late fall through spring months, with a similar dip in
presence during the summer as Cuvier’s beaked whales.
• There may be a weak diel pattern for BW43 detections, with more detections at night, but
more acoustic encounters are needed to confirm if this is a persistent pattern (Figure 10).
Table 3: Summary of Cuvier’s beaked whale and BW43 FM pulse detections since 2013.
Cuvier's beaked whale BW43 - possible Perrin's beaked whale
times (min)
times (min)
times (min)
times (min)
detections
detections
Days with
Days with
detections
Days with
Days with
detections
detection
detection
detection
detection
Average
Average
Effort
Total
Total
daily
daily
Days
(%)
(%)
Site
H 1268 28,450 941 74 22.4 56 5Figure 8. Weekly average daily detections in minutes of A) Cuvier’s beaked whale and B) BW43 FM
pulses between January 2013 and June 2017 at sites H, M, and N. There were no detections of either
signal type at site P, and no detections of the BW43 signal type at site M.
Gray dots represent percent of effort per week in weeks with less than 100% recording effort, and
gray shading represents periods with no effort. Where gray dots or shading are absent, full recording
effort occurred for the entire week.
16Site H Site M
Site N
Figure 9. Cuvier’s beaked whale FM pulses, indicated by blue dots, in one-minute bins at sites H, M,
and N. There were no detections at site P. Grey vertical shading represents nighttime and horizontal
blue shading are periods without recording effort.
17Site H Site N
Figure 10. BW43 FM pulses, indicated by blue dots, in five-minute bins at sites H and N. There
were no detections at sites M and P.
Effort markings are described in Figure 9.
Conclusions
Blue whales, fin whales and Cuvier’s beaked whales were all commonly detected across the
SOCAL Range Complex. The BW43 signal type, possibly originating from Perrin’s beaked
whales, occurred infrequently. There was a clear seasonality in the occurrence of all detected
calls, but a difference in their peak occurrence. Blue whales were generally present during the
summer and fall. Fin whales were found in the area year-round, but their 20 Hz calls peaked
during late fall and winter at all sites and were generally low during the summer months. Fin
whale 40 Hz calls were not analyzed for this report but previous annual reporting from 2009-
2014 (Hildebrand et al., 2010a; 2010b; 2011; 2012; Kerosky et al., 2013; Debich et al., 2015b)
has documented consistent fin whale 40 Hz call presence year-round, with peaks during May and
June (in early reports they are referred to as 50 Hz calls). Combined call analysis shows fin
whales appear across SOCAL year-round (Širović et al., 2013). While both beaked whale signals
were also detected year-round, highest acoustic activity occurred during fall through spring with
a summer dip. Across the five years monitored here, there was some indication of lower baleen
whale calling in 2015, which was the peak period of anomaly in the North Pacific Ocean known
as “the blob,” but this was not true across all sites as high numbers of D calls were detected at
site P. At the same time, highest detections of the BW43 signal type was noted at site N and to a
lesser degree at site H. Blue whale calls had the highest density at site P, and fin whale 20 Hz
18calls were most common at site H, where Cuvier’s beaked whale signals were also detected most
frequently.
19References
Baumann-Pickering, S., McDonald, M. A., Simonis, A. E., Solsona Berga, A., Merkens, K. P.
B., Oleson, E. M., Roch, M. A., Wiggins, S. M., Rankin, S., Yack, T. M., and
Hildebrand, J. A. (2013a). "Species-specific beaked whale echolocation signals," Journal
of the Acoustical Society of America 134, 2293-2301.
Baumann-Pickering, S., Simonis, A. E., Roch, M. A., McDonald, M. A., Solsona Berga, A.,
Oleson, E. M., Wiggins, S. M., Brownell, J., Robert, L., and Hildebrand, J. A. (2014).
"Spatio-temporal patterns of beaked whale echolocation signals in the North Pacific,"
PLOS One, e86072.
Baumann-Pickering, S., Simonis, A. E., Wiggins, S. M., Brownell, R. L., and Hildebrand, J. A.
(2013b). "Aleutian Islands beaked whale echolocation signals," Mar. Mamm. Sci. 29,
221-227.
Debich, A. J., Baumann-Pickering, A., Širović, A., Hildebrand, J. A., Herbert, S. T., Johnson, S.
C., Rice, A. C., Trickey, J. S., and Wiggins, S. M. (2015a). "Passive Acoustic Monitoring
for Marine Mammals in the SOCAL Range Complex January - July 2014," Marine
Physical Laboratory, Scripps Institution of Oceanography, (La Jolla, CA), p. 43.
Debich, A. J., Baumann-Pickering, S., Širović, A., Hildebrand, J. A., Alldredge, A. L., Gottlieb,
R. S., Herbert, S. T., Johnson, S. C., Rice, A. C., Roche, L. K., Theyre, B. J., Trickey, J.
S., Varga, L. M., and Wiggins, S. M. (2015b). "Passive Acoustic Monitoring for Marine
Mammals in the SOCAL Naval Training Area Dec 2012 - Jan 2014," Marine Physical
Laboratory, Scripps Institution of Oceanography, (La Jolla, CA), p. 96.
Helble, T. A., Ierley, G. R., D'Spain, G. L., Roch, M. A., and Hildebrand, J. A. (2012). "A
generalized power-law detection algorithm for humpback whale vocalizations," Journal
of the Acoustical Society of America 131, 2682-2699.
Hildebrand, J. A. (2009). "Anthropogenic and natural sources of ambient noise in the ocean,"
Marine Ecology Progress Series 395, 5-20.
Hildebrand, J. A., Baumann-Pcikering, S., Širović, A., Buccowich, J., Debich, A., Johnson, S.,
Kerosky, S., Roche, L., Berga, A. S., and Wiggins, S. M. (2012). "Passive Acoustic
Monitoring for Marine Mammals in the SOCAL Naval Training Area 2011-2012,"
Marine Physical Laboratory, Scripps Institution of Oceanography, (La Jolla, CA).
Hildebrand, J. A., Baumann-Pickering, S., Širović, A., Bassett, H., Cummins, A., Kerosky, S.,
Roche, L., Simonis, A., Wiggins, S. M. (2011). "Passive Acoustic Monitoring for Marine
Mammals in the SOCAL Naval Training Area 2010-2011," Marine Physical Laboratory
Technical Memo 531A. Scripps Institution of Oceanography, (La Jolla, CA).
Hildebrand, J., Bassett, H., Baumann, S., Campbell, G., Cummins, A., Kerosky, S., Melcon, M.,
Merkens, K., Munger, L., Roch, M., Roche, L., Simonis, A., Wiggins, S. (2010a). "High
Frequency Acoustic Recording Package Annual Data Summary Report March 11, 2009 –
March 25, 2010 SOCAL Site M." Marine Physical Laboratory. Scripps Institution of
Oceanography, (La Jolla, CA).
Hildebrand, J., Bassett, H., Baumann, S., Campbell, G., Cummins, A., Kerosky, S., Melcon, M.,
Merkens, K., Munger, L., Roch, M., Roche, L., Simonis, A., Wiggins, S. (2010b). "High
Frequency Acoustic Recording Package Annual Data Summary Report March 14, 2009 –
March 26, 2010 SOCAL Site N." Marine Physical Laboratory. Scripps Institution of
Oceanography, (La Jolla, CA).
20Jefferson, T. A., Webber, M. A., and Pitman, L. (2015). "Marine Mammals of the World: A
Comprehensive Guide to their Identification (2nd Ed). (Academic Press)."
Jefferson, T. A., Webber, M. A., and Pitman, R. L. (2008). "Marine Mammals of the World: A
Comprehensive Guide to their Identification (Academic Press)."
Johnson, M., Madsen, P. T., Zimmer, W. M. X., Aguilar de Soto, N., and Tyack, P. L. (2004).
"Beaked whales echolocate on prey," Proceedings of the Royal Society B: Biological
Sciences 271, S383-S386.
Kerosky, S. M., Baumann-Pickering, S., Širović, A., Buccowich, J. S., Debich, A. J., Gentes, Z.,
Gottlieb, R. S., Johnson, S. C., Roche, L. K., Thayre, B., Wakefield, L., Wiggins, S. M.,
and Hildebrand, J. A. (2013). "Passive Acoustic Monitoring for Marine Mammals in the
SOCAL Range Complex during 2012," Marine Physical Laboratory, Scripps Institution
of Oceanography, (La Jolla, CA), p. 72.
McDonald, M. A., Hildebrand, J. A., and Mesnick, S. (2009). "Worldwide decline in tonal
frequencies of blue whale song," Endangered Species Research 9, 13-21.
McDonald, M. A., Hildebrand, J. A., and Webb, S. C. (1995). "Blue and fin whales observed on
a seafloor array in the Northeast Pacific," J. Acoust. Soc. Am. 98, 712-721.
McDonald, M. A., Hildebrand, J. A., Wiggins, S. M., and Ross, D. (2008). "A 50 year
comparison of ambient noises near San Clemente Island: A bathymetrically complex
coastal region off Southern California," Journal of the Acoustical Society of America
124, 1985-1992.
McDonald, M. A., Mesnick, S. L., and Hildebrand, J. A. (2006). "Biogeographic characterisation
of blue whale song worldwide: using song to identify populations," Journal of Cetacean
Research and Management 8, 55-65.
Mellinger, D. K., and Clark, C. W. (1997). "Methods of automatic detection of mysticete
sounds," Marine and Freshwater Behaviour and Physiology 29, 163-181.
Oleson, E. M., Calambokidis, J., Burgess, W. C., McDonald, M. A., LeDuc, C. A., and
Hildebrand, J. A. (2007). "Behavioral context of call production by eastern North Pacific
blue whales," Mar. Ecol. Prog. Ser. 330, 269-284.
Rice, A. C., Baumann-Pickering, S., Širović, A., Hildebrand, J. A., Debich, A. J., Meyer-
Lobbecke, A., Thayre, B. J., Trickey, J. A., and Wiggins, S. M. (2017). "Passive Acoustic
Monitoring for Marine Mammals in the SOCAL Range Complex June 2015 - April
2016," Marine Physical Laboratory, Scripps Institution of Oceanography, University of
California San Diego, La Jolla, CA, MPL Technical Memorandum #610 under
Cooperative Ecosystems Study Unit Cooperative Agreement N62473-16-2-0012 for U.S.
Navy Pacific Fleet, Pearl Harbor, HI, p. 36.
Rice, A. C., Baumann-Pickering, S., Širović, A., Hildebrand, J. A., Rafter, M., Thayre, B. J.,
Trickey, J. S., and Wiggins, S. M. (2018). " Passive Acoustic Monitoring for Marine
Mammals in the SOCAL Range Complex April 2016 - June 2017," Marine Physical
Laboratory, Scripps Institution of Oceanography, University of California San Diego, La
Jolla, CA, MPL Technical Memorandum #618 under Cooperative Ecosystems Study
Unit Cooperative Agreement N62473-17-2-0014 for U.S. Navy Pacific Fleet, Pearl
Harbor, HI, p. 45.
Roch, M. A., Brandes, T. S., Patel, B., Barkley, Y., Baumann-Pickering, S., and Soldevilla, M. S.
(2011a). "Automated extraction of odontocete whistle contours," Journal of the
Acoustical Society of America 130, 2212-2223.
21Roch, M. A., Klinch, H., Baumann-Pickering, S., Mellinger, D. K., Qui, S., Soldevilla, M. S.,
and Hildebrand, J. A. (2011b). "Classification of echolocation clicks from odontocetes in
the Southern California Bight," Journal of the Acoustical Society of America 129, 467-
475.
Širović, A. (2016). "Variability in the performance of the spectrogram correlation detector for
North-east Pacific blue whale calls," Bioacoustics 25, 145-160.
Širović, A., Baumann-Pickering, S., Hildebrand, J. A., Debich, A. J., Herbert, S. T., Meyer-
Lobbecke, A., Rice, A., Thayre, B., Trickey, J. S., Wiggins, S. M., and Roch, M. A.
(2016). "Passive acoustic monitoring for marine mammals int he SOCAL Range
Complex July 2014 - May 2015," Marine Physical Laboratory, Scripps Institution of
Oceanography, (La Jolla, CA), p. 39.
Širović, A., Rice, A., Chou, E., Hildebrand, J. A., Wiggins, S. M., and Roch, M. A. (2015).
"Seven years of blue and fin whale call abundance in the Southern California Bight,"
Endangered Species Research 28, 61-76.
Širović, A., Williams, L. N., Kerosky, S. M., Wiggins, S. M., Hildebrand, J. A. (2013).
"Temporal separation of two fin whale call types across the eastern North Pacific,"
Marine Biology, 160, 47-57.
Soldevilla, M. S., Henderson, E. E., Campbell, G. S., Wiggins, S. M., Hildebrand, J. A., and
Roch, M. (2008). "Classification of Risso's and Pacific white-sided dolphins using
spectral properties of echolocation clicks," Journal of the Acoustical Society of America
124, 609-624.
Thompson, P. O., Findley, L. T., and Vidal, O. (1992). "20-Hz pulses and other vocalizations of
fin whales, Balaenoptera physalus, in the Gulf of California, Mexico," Journal of the
Acoustical Society of America 92, 3051-3057.
Watkins, W. A. (1981). "Activities and underwater sounds of fin whales," Scientific Reports of
the Whale Research Institute 33, 83-117.
Wiggins, S. M. (2015). "Methods for quantifying mid-frequency active sonar in the SOCAL
Range Complex," Marine Physical Laboratory Technical Memorandum 553, Scripps
Institution of Oceanography, University of California San Diego, La Jolla, CA.
Wiggins, S. M., and Hildebrand, J. A. (2007). "High-frequency acoustic recording package
(HARP) for broadband, long-term marine mammal monitoring," in International
Symposium on Underwater Technology 2007 and International Workshop on Scientific
Use of Submarine Cables and Related Technologies 2007 (Institute of Electrical and
Electronics Engineers, Tokyo, Japan), pp. 551-557.
Zimmer, W. M. X., Johnson, M. P., Madsen, P. T., and Tyack, P. L. (2005). "Echolocation clicks
of free-ranging Cuvier's beaked whales (Ziphius cavirostris)," Journal of the Acoustical
Society of America 117, 3919-3927.
22You can also read