Flickering candle flames and their collective behavior - Nature
←
→
Page content transcription
If your browser does not render page correctly, please read the page content below
www.nature.com/scientificreports
OPEN Flickering candle flames and their
collective behavior
Attila Gergely1, Bulcsú Sándor1, Csaba Paizs2, Robert Tötös2 & Zoltán Néda1*
Oscillation and collective behavior of diffusion flames is a fascinating phenomena. Considering candle
bundles with different sizes in variable oxygen concentration, the flickering dynamics of the flames
are experimentally and theoretically investigated. Trends for the flickering frequency as a function
of the candle number in the bundle and oxygen concentration is revealed for various topologies
of the candles packing. The collective behavior of the flames as a function of their separation
distance is studied by measuring an appropriate synchronization order parameter and through the
common oscillation frequency. In agreement with previous results we find a discontinuous phase
transition between an in-phase synchronized state at small separation distance and a counter-phase
synchronized state at larger separation distances. A previously used dynamical model is modified in
order to accommodate our experimental findings.
Oscillation of diffusion flames is an intriguing phenomena, known for a long t ime1. Controlling these instabili-
ties are important in applications where one needs to stabilize the flame. Many studies have been conducted to
investigate the effect of various parameters on the oscillation frequency and to explain the cause of the oscilla-
tion. It has been shown that the oscillation frequency scales as a power law with the nozzle diameter2, external
pressure3, and gravitational acceleration4 (centrifuge experiments). Early studies suggested that the oscillation
frequency does not depend on the fuel outflow velocity, however, measurements for a wider ranges observed a
power law dependence for this as w ell5. In order to explain the observed oscillations, either an approach based on
hydrodynamic instabilities6 or a dynamical system approach based on the mechanism of the chemical reaction
on the surface of the flame7 was considered.
Recently this problem returned in the focus of researchers and a number of s tudies7–13 have been published
on the oscillation of candle flames by considering different setups. Beside the oscillation of the candle flames,
the collective behavior of an ensemble of oscillating flames close enough to each other was also i nvestigated7,10.
For short distances between the oscillating flames in-phase synchronization and for larger distances anti-phase
synchronization was observed. By further increasing the distance between the oscillating flames their flickering
becomes uncorrelated. Synchronization was observed recently also for methane diffusion fl ames14.
In the present work, we reconsider both experimentally and theoretically the oscillation of the candle flames
and their collective behavior. We report on experimental results that lead to modifications in the original model
proposed by Kitahata et al.7. More precisely, in the case of bundles with different topologies we examine the effect
of the bundle size on the oscillation frequency in a much wider range than in the previous s tudies12, and we
examine the effect of the oxygen concentration on the oscillation. We reproduce the results known so far for the
synchronization of two b undles7,12 and report inconsistencies with the coupling mechanism proposed e arlier7.
The dynamical system approach presented in the work of Kitahata et al.7 is revised by changing the equations so
that they lead to realistic trends as a function of the system parameters both for the oscillation of the flame in
one candle bundle and for their collective behaviour as a function of the separation distance.
The rest of the paper is organized in the following manner. First, we present the dynamical model used previ-
ously to understand the oscillation of candle flames and their collective behavior. We describe our experimental
methods and results arguing for the need of revised dynamical equations. A modified dynamical model is then
offered that allows a good understanding of the observed oscillation and synchronization phenomena in agree-
ment with the experimental results. Finally, we summarize our findings and discuss on the applicability of the
results.
1
Department of Physics, Babeş-Bolyai University, Kogălniceanu street nr. 1, 400084 Cluj‑Napoca,
Romania. 2Biocatalysis and Biotransformation Research Centre, Faculty of Chemistry and Chemical Engineering,
Babeş-Bolyai University, Arany János street nr. 11, 400029 Cluj‑Napoca, Romania. *email: zneda@phys.ubbcluj.ro
Scientific Reports | (2020) 10:21305 | https://doi.org/10.1038/s41598-020-78229-x 1
Vol.:(0123456789)
www.nature.com/scientificreports/
Modeling framework for candle flame oscillation and their collective behavior
We start from the classical dynamical system approach proposed by the Japanese group7. It consists of two cou-
pled first-order differential equations for the main quantities that are considered to be decisive in understanding
the flame’s dynamics: temperature, T, and oxygen concentration, n, in the flame:
dT E
C = ω1 −h · (T − T0 ) + β · n · a · e− RT − σ · T 4
dt
(1)
dn E
= ω2 k · (n0 − n) − a · n · e− RT
dt
The first equation describes the energy conservation: thermal energy of the system is diminished by heat loss
through convection (first term on the right side) and radiation (third term), and it is increased due to heat pro-
duction by burning. The heat production rate depends on a Boltzmann factor governed by a chemical activation
barrier E, it is linearly proportional with the oxygen concentration and the fuel (paraffin) supply rate. We denoted
by C the heat capacity of the system, ω1 is a characteristic time-scale (frequency for the process), h characterizes
the heat conduction, T0 is the external temperature of the environment, β is a proportionality factor, a is the fuel
consumption rate, σ is the heat radiation coefficient and R is the ideal gas constant.
The second equation describes the oxygen balance according to which the amount of oxygen in the flame
increases due to a flux from the exterior governed by a classical transport phenomena with the proportionality
constant k and it is decreased due to oxygen consumption by burning. We denoted by ω2 a characteristic fre-
quency (time-scale) and by n0 the oxygen concentration in the external atmosphere.
By introducing the following non-dimensional parameters,
E
τ = t ω2 k , c=
RT0
T − T0 n
u=c , v=
T0 n0
β c n0 a −c a (2)
au = e , av = e−c
T0 h k
hω σ c T 3
1 0
ε−1 = , σ0 =
C k ω2 C ω2 k
the dynamical equations can be written also in a non-dimensional form:
du 1 uc
u+c
u
4
= −u + au ve − σ0 1 +
dτ ε c
(3)
dv uc
= 1 − v − av ve u+c
dτ
This coupled first-order differential equation system can be numerically integrated, and it’s behavior as a
function of the au, av , ǫ, c and σ0 parameters can be studied. The flame diameter or the number of candles, N, in
the bundle governs the value of the a parameter (and therefore the values of au and av ), which should increase
with the size of the flame. By fixing the ǫ, c and σ0 parameters one can study the behavior of the system in the
au − av parameter plane and identify the region where there is limit cycle, i.e. the flame oscillates. For realistic
parameters (ǫ = 0.001, c = 5.1 and σ0 = 1) the systems behavior is illustrated in Fig. 1. The color code in the
figure illustrates the oscillation frequency of the flame. In the dark blue region the system has a fix point and
no limit-cycle, therefore the flame is stable. Depending thus on the au and av parameters one can observe either
a stable flame or an oscillation. Increasing the flame diameter (or considering candle bundles with more and
more candles) one increases the a parameter and proportionally the values of au and av , going away from the
origin on a straight line trajectory in the au − av parameter space (see Fig. 1). This behavior suggests that flick-
ering (oscillation) starts only after a exceeds a given value, and the oscillation frequency should increase with
increasing the value of a, hence with the number of candles in the bundle. The behavior is similar also for other
ǫ, c and σ0 values.
Kitahata et. al suggested that the in-phase and anti-phase synchronization of two candle bundles can be
understood by coupling the dynamical equations (1) for two systems through the thermal radiation term. For
two identical bundles i = j ∈ {1, 2} separated at distance x the coupling writes as:
dTi ω1 − E σ σ µ 4
= h · (T0 − Ti ) + β · ni · a · e RTi − · Ti4 + T
dt C C C x2 j
(4)
dni − E
= ω2 k · (n0 − ni ) − a · ni · e RTi
dt
The authors a rgue7 that the above coupled system is able to reproduce for increasing separation distance x, the
in-phase and anti-phase synchrony as well. Rewriting equations (4) again in the non-dimensional form and
using the same parameters as in (2) , the authors state that for the parameters ǫ = 0.001, au = av = 3.7, c = 5
and σ0 = 1 for µ/x 2 = 0.5 one gets in-phase synchronization of the flames, while for µ/x 2 = 0.01 anti-phase
synchronization is achieved. Unfortunately one cannot reproduce the results mentioned above for the parameters
Scientific Reports | (2020) 10:21305 | https://doi.org/10.1038/s41598-020-78229-x 2
Vol:.(1234567890)
www.nature.com/scientificreports/
Figure 1. The figure from the left shows with a color-code the frequency of the limit-cycle oscillations in the au,
av parameters space, obtained from equations (3) using the parameters ε = 10−3, c = 5.1, σ0 = 1. In the dark-
blue region there is no limit-cycle. For increasing the number of candles in the bundle (increasing the value
of a) one moves in the direction of a line as indicated in the figure by the black arrow. The figure on the right
of the frequency for the limit-cycle oscillations when the slope ϕ is constant and r
side illustrates the variation
is increasing. Here r = au2 + av2 and ϕ = arctan (av /au ). Depending on the value of ϕ one might not get any
oscillations (ϕ ≥ 0.17 rad for the indicated directions).
Figure 2. Arrangements of the candle bundles used in the experiments. Arrangement (a) is referred to as
a compact arrangement, (b) as a hollow arrangement, (c) is a linear arrangement and (d,e) as a triangular
arrangement. The topologies from (a–d) were used in studying the oscillation frequencies of a single bundle,
while the topologies (d,e) were considered for investigating the collective behavior of the flame from two
bundles.
given in the s tudy7. However, for av = 1 and keeping all the other parameters as mentioned above, one can
reproduce the desired collective behavior although the obtained oscillation frequency will be different from the
one suggested by Kitahata et al. It should be also kept in mind that this model for the fixed parameter sets will
lead to anti-phase sync only for very restricted initial conditions. With other words the basin of attraction for
obtaining the anti-phase synchronization is relatively small.
Although the above presented dynamical model is a simple one and captures the main characteristics of
the investigated phenomena, it proves to be in disagreement with our experimental results presented in the
followings.
Experimental part
Equipments and methods. Since the flame of a single candle usually does not exhibit oscillations, candle
bundles with various sizes and in different topologies were built. We used 8mm diameter and 7cm long candles
arranged in the topologies depicted in Fig. 2. The experiments were performed at room temperature under nor-
mal atmosphere and in different oxygen+nitrogen mixtures as well. For the compact and hollow arrangements,
(a) and (b) respectively, the effect of the bundle size on the oscillation frequency was examined for a wide range
of the candle numbers. The effect of the oxygen concentration was studied qualitatively for a single candle and in
more detail for the triangular arrangement with 3 candles (Fig. 2d). The collective behavior of two bundles was
studied as a function of their distance using the triangular arrangements (Fig. 2d,e) for the bundles.
The oscillations of the candle flames and the emerging collective behavior was studied experimentally both
with a TroubleShooter high-speed camera and with an Atmega 16 chip-based photoresistor device designed by us.
The measurement with the high-speed camera was performed as follows: from 2000 up to 8000 frames were
recorded with 250 fps or 1000 fps of the flickering (as an example see Fig. 3), and then the pixels belonging to
Scientific Reports | (2020) 10:21305 | https://doi.org/10.1038/s41598-020-78229-x 3
Vol.:(0123456789)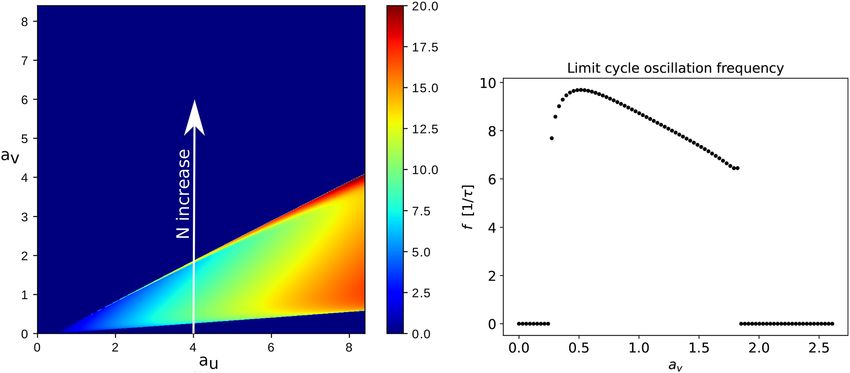
www.nature.com/scientificreports/
Figure 3. Recorded frames with the TroubleShooter high-speed camera and processed with the Otsu method.
(a) Frames for the oscillation of one bundle. (b) Frames for the in-phase synchronized dynamics of two bundles,
and (c) frames for the anti-phase synchronized dynamics of two bundles.
the flame on each frame were identified using the Otsu method15. For a single bundle the time series were con-
structed for the number of pixels identified in the flame, giving a gauge for the flames intensity. For the collective
behavior of two bundles the identified pixels for the flames were first separated in two parts, belonging to each
flame in part, as it is depicted by the red line in the figure.
The Atmega 16 chip is connected to a one-step voltage divider to convert the brightness into a voltage value.
The voltage value is measured by the analog input of the microchip, and the measured result is transmitted to
the computer via asynchronous communication. The sampling frequency is 2 kHz.
For measuring the thermal radiation of the flames we constructed an original device. Our sensor is sche-
matically presented in Fig. 4a,b. The skeleton of the device was 3D printed. The thermal radiation enters in
the detector through a ZnSe window to allow a wide transmission band even in the deep infrared range. Two
sensitive temperature sensors (IC1 and IC2), divided by an isolator glass plate, are placed one after the other
as it is shown in the figure. The incoming radiation produces a temperature gradient in the glass plate, which
equilibrates in time for a constant room temperature. This equilibrium value is proportional with the incoming
radiation flux and it was measured with a sensitive setup. The circuit diagram of the measuring device is shown
on Fig. 4c. It is designed for amplifying the small differences measured by IC1 and IC2 and also to compensate
their manufacturing differences. The device was calibrated in such manner that for zero thermal radiation it gives
no voltage. By using the thermal radiation of a halogen bulb placed at different distances, d, from the detector
we proved that the device gives a linear response of the detected voltage as a function of the intensity of the
thermal radiation. In Fig. 4d we illustrate on a log-log scale the voltage given by the sensor as a function of the
distance from the radiation source, indicating a power-law dependence with exponent roughly 2. Taking into
account that the intensity of the radiation decreases as a function of the distance as 1/d 2, we can conclude that
our sensor is linear in a good approximation.
In order to investigate the role of thermal radiation in the formation of the collective behavior of the candle
bundles’s flames we used also a pulsating radiation source with the same radiation properties as the candle flame.
Scientific Reports | (2020) 10:21305 | https://doi.org/10.1038/s41598-020-78229-x 4
Vol:.(1234567890)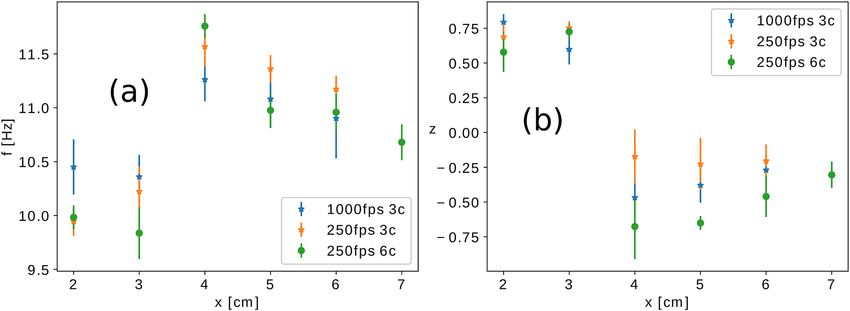
www.nature.com/scientificreports/

                                  Figure 4.  (a) The scheme of thermal radiation measuring equipment. Thermal radiation passes through a zinc
                                  selenide window to the IC1 sensor where it is absorbed. The absorbed heat passes through the glass plate and
                                  the sensor IC2 into the housing of the device, it can be shown that if the incoming thermal radiant energy is
                                  constant, the temperature difference between the sensors is proportional to the incoming thermal power. (b)
                                  A section and a side view of a 3D model of the device. (c) The circuit diagram of the device. The measurement
                                  consists of two steps: we measure the voltage U0 given by the device when the input is covered and also when the
                                  thermal radiation reaches the sensor, U1. The voltage difference U1 − U0 is the measurement result (proportional
                                  to the incoming thermal power). (d) The calibration curve for the thermal radiation measuring device. The
                                  figure illustrates the signal given by the measuring device as a function of the distance measured from a 50 W
                                  halogen bulb. From the linear fit, we learn that the resulting voltage difference is proportional to the inverse of
                                  the square of the distance. Please note the double-logarithmic scale.

Scientific Reports |   (2020) 10:21305 |               https://doi.org/10.1038/s41598-020-78229-x                                                   5

                                                                                                                                              Vol.:(0123456789)
www.nature.com/scientificreports/
Figure 5. Experimental setup for investigating the influence of the oxygen concentration. As “air” we used
synthetic air with the normal mixture of oxygen (21%) and nitrogen (79%).
This was provided by a halogen bulb of 50W which had the same spectra as the one of the candles flame. More
details about this experiment is given in the Supplementary Material, section A.
In the dynamical model proposed in the previous section, one can observe that the oxygen concentration in
the environment is also an important parameter in the non-dimensional au value. For studying also the effect of
the air composition (oxygen concentration) we have constructed yet another experimental device (Fig. 5). As it
is illustrated, we mixed a composition of nitrogen, air and oxygen and by using fine regulators we could provide
for the candle a controlled oxygen concentration. The candle bundle was placed in a tube of 15 cm diameter
and the gas entered below through honeycomb mash to achieve a uniform turbulence-free flow. The top of the
pipe was covered with a fine metal mesh, which allowed the combustion products to escape and prevented the
perturbing effect of the outside airflow.
Experimental results on the oscillation frequency. The experiments were performed at room tem-
perature at normal atmospheric pressure varying also the oxygen concentration. Each experiment was repeated
for at least 5 times, allowing thus to construct error-bars. Movies recorded with the high-speed camera for the
oscillation of a single bundle in normal atmosphere and in controlled oxygen concentration can be consulted
following our YouTube playlists16,17 dedicated to these experiments.
For the arrangements (a), (b) shown in Fig. 2, the oscillation frequency, f, was examined for a wide size
range of candle numbers, N, in the bundle. The measurement results are shown in Fig. 6a–c . For the compact
and circular (hollow) topology a clear decreasing trend of the frequency as a function of the candle number is
observed (Fig. 6a,b, respectively). For the linear arrangement no such monotonic trend is obtained (Fig. 6c).
In this case for a higher number of candles ( N > 11) the flame lost its compactness and therefore the oscilla-
tion frequency becomes ambiguous and we do not present results for such b undles16. Our results outperforms
the measurement from13 by considering much larger bundles and various topologies. These results are in clear
disagreement with the prediction of the dynamical model from (1), which suggests that the frequency should
increase with the bundle size.
The effect of the oxygen concentration, n0, on the oscillation frequency was studied using the device described
in the previous subsection. It was found that in contrast to what happens at normal oxygen concentration, the
flame of a single candle also oscillates with a frequency of 11.54 Hz when the oxygen concentration exceeds
70%. A part of the time series obtained for intensity measurements recorded and processed for the 21% and 70%
oxygen concentration is illustrated in Fig. 7a. While the flame of a single candle at 21% oxygen concentration
shows no periodic oscillation, at 70% oxygen concentration a clear periodicity is detected. The intensity was
measured from the Otsu processed images. First we determined the number of white pixels, wi in each frame
i and determined from these the average value w
. The intensity of the flame for each frame is a relative value,
defined as the ratio wi /( w
).
For the oscillation of a circular bundle containing 14 candles oscillating with a f = 8.05Hz frequency in the
presence of 21% oxygen concentration we found that the oscillation disappears above 90% oxygen concentra-
tion. Figure 7b shows two time series of the recorded intensity for the 14-element bundle at 21% and 90% oxygen
concentrations, illustrating this phenomena. At 90% oxygen concentration one can observe a relatively weak
fluctuation of the flame’s relative intensity, a qualitatively different behaviour from the oscillations observed
for 21% oxygen concentration. Unfortunately for other bundle topology it was not possible to check this trend,
since it would have required much larger number of candles in the bundle and/or higher oxygen concentration.
Scientific Reports | (2020) 10:21305 | https://doi.org/10.1038/s41598-020-78229-x 6
Vol:.(1234567890)www.nature.com/scientificreports/
Figure 6. Frequency of flame flickering as a function of the number of candles, N, for various arrangements of
the candles in the bundle. In (a), a compact arrangement is used for the candles, results are obtained both with
the Atmega32 driven light measuring device and high-speed camera. (b) For the hollow arrangement of the
candles, measured with the light measuring device. (c) For the linear arrangement of the candles, measured with
the high-speed camera.
Figure 7. Time series for the recorded flame intensity (values normalized to the mean) obtained with the high-
speed camera and processed with the Otsu method. (a) A single candle flickering in an atmosphere containing
21% and 70% oxygen concentrations. (b) A bundle with 14 candles in a hollow arrangement at 21% and 90%
oxygen concentrations.
Under such experimental conditions however the combustion would release an uncontrollably large amount of
heat in the tube, becoming potentially dangerous and damaging the experimental setup. This indeed happened
when we increased the oxygen concentration above 95%. The only feasible alternative would have been to use
the linear arrangements. In this case however the size of the tube would limit quickly the bundle size, and for
small bundles again a dangerously high oxygen concentration would be necessary to achieve the same effect.
For different oxygen concentrations and using a triangular arrangement of 3 candles the oscillation fre-
quency was studied with high-speed camera measurements. Before and after the measurements the candle weight
Scientific Reports | (2020) 10:21305 | https://doi.org/10.1038/s41598-020-78229-x 7
Vol.:(0123456789)www.nature.com/scientificreports/
Figure 8. Oscillation frequency and the paraffin consumption rate as a function of oxygen concentration, n0.
Results for a triangular arrangement containing 3 candles.
Flow rate Oscillation frequency (Hz) f
(Hz) σ (f ) (Hz)
200 l/h 9.89 10.31 10.03 10.54 10.19 0.29
400 l/h 10.5 9.9 10.58 10.49 10.36 0.31
Table 1. Influence of the incoming flow rate on the oscillation frequency inside the tube. Results for a bundle
with three candles in triangular arrangement and 21% oxygen concentration. Four different experiments were
conducted at each flow-rate. The average frequency, f
, and the standard deviation, σ (f ), for the observed
frequencies are given in the last two columns of the table.
was also precisely measured and the paraffin consumption rate was estimated. Figure 8 presents the results on
oscillation frequency and the paraffin consumption rate as a function of oxygen concentration. The decreasing
trend of the oscillation frequency and the growing paraffin consumption as a function of the increasing oxygen
concentration was observed. It is interesting to note here that the oscillation frequencies of the flame measured
inside the tube for the normal oxygen concentration of 21% are slightly lower than the values measured for the 3
candle bundles outside the tube (Fig. 6a). This suggests that by limiting the space in which the combustion takes
place will also influence the flickering frequency. We have also checked that the airflow inside the tube does not
modify in a relevant manner the observed oscillation frequencies. Experimental results in case of two different
incoming flow rates (200 l/h and 400l/h) are summarized in Table 1. From here we concluded that by doubling
the flow rate there was no relevant effect on the observed oscillation frequency.
Experimental results on the collective behavior. For triangular arrangements the collective behavior
of two bundles, with both 3 and 6 candles, was studied as function of the separation distance. Movies recorded
with the high-speed camera regarding the collective behavior of the flame of two candle bundles can be con-
sulted on our YouTube playlist18. To quantify synchronization, we use the synchronization parameter z borrowed
from one of our earlier studies19. In Supplementary Material, section B, the calculation of z is detailed. The
value of this order parameter is 1 if the bundles are completely in-phase synchronized and it is − 1 if they are
completely anti-phase synchronized. The oscillation frequency as a function of separation distance is plotted on
Fig. 9a while the measured trend for the synchronization order parameter is presented in Fig. 9b.
It can be observed that for both bundle sizes the transition between the in-phase synchronization and counter-
phase synchronization takes place between a separation distance from 3 to 4 cm. From the value of the measured
z order parameter we conclude that for bigger bundle sizes the counter-phase synchronization becomes more
and more stable.
Scientific Reports | (2020) 10:21305 | https://doi.org/10.1038/s41598-020-78229-x 8
Vol:.(1234567890)www.nature.com/scientificreports/
Figure 9. (a) Oscillation frequency of the triangular arrangement of triangular candle bundles containing 3
and 6 candles (denoted in the legend as 3c and 6c, respectively) as a function of the separation distance x. (b)
Synchronization order-parameter calculated for the oscillations as a function of the separation distance.
Pulsation frequency 9.6 10.11 10.61
z 0.05 0.06 0.02
σ (z) 0.01 0.02 0.01
Table 2. Synchronization order-parameter, z, calculated for the collective behavior of a thermal radiation
source oscillating at different frequencies and a triangular candle bundle containing 3 candles. We also indicate
the value of the standard deviation σ (z), estimated from 3 experiments in each case.
In order to verify the coupling mechanism through thermal radiation proposed by the Kitahata g roup7, we
replaced one candle bundle with a halogen bulb having the same radiation properties. The intensity of the current
passing through the bulb was modulated so that its output radiation power and spectrum became similar to that
of the flame. This radiation source was placed at 2 cm distance from a triangular bundle containing 3 candles,
and for different modulation frequencies of the bulb the collective behavior of the halogen bulb–candle bundle
system was investigated. At such distance in-phase synchronization should be expected. Based on the recorded
time series, the synchronization order-parameter was calculated and the results are presented in Table 2. The
values of z close to 0 suggest no synchronization. In such a view one can thus seriously question the validity of
the coupling through the thermal radiation term in equations (4).
Improved dynamical model
In view of the presented experimental results it is obvious that the dynamical model of Kitahata et al.7 has to be
reconsidered. The new model should successfully reproduces the detected trends in the frequency as a function
of the candle numbers in the bundle and the oxygen concentration. On the other hand a successful model has to
reproduce also the disappearance of the limit cycle for low and high candle numbers and oxygen concentrations
as well. Also, the collective behavior has to be addressed by a realistic coupling and the detected synchronization
order parameter and frequency has to be in agreement with the measured trends.
Instead of Eq. (1) we propose the following dynamical model:
dT E
C ′ · N · b(n0 ) · = ω1 −h′ · N · b(n0 ) · (T − T0 ) + β · n · N · a(n0 ) · e− RT
dt
(5)
dn E
= ω2 k · (n0 − n) − N · a (n0 ) · n · e− RT
dt
We neglected here the thermal radiation term, which was proven to be irrelevant for the collective behavior,
and does not influence the limit cycle behavior either. The main difference relative to the original equations
are the introduction of the N b(n0 ) and N a(n0 ) terms . The N b(n0 ) term describes the volume of the flame as
a function of the candle numbers, N, and oxygen concentration, n0. It is assumed that the volume of the flame
increases linearly as a function of N. The dependence as a function of the used oxygen concentration, n0, should
have a more complicated functional form and this is why we use a general b(n0 ) kernel. Therefore if one denotes
by C ′ the volumetric heat capacity, the left side is the total thermal energy change inside the flame. We assume
that the loss of heat by convection described by the first term on the right side is also governed by N b(N0 ) (this
assumption is definitely more valid for the hollow and linear arrangements). Instead of a constant a term, gov-
erning the fuels supply rate we consider a term depending again on both the candle number in the bundle and
oxygen concentration: N a(n0 ). In the second equation for the dynamics of the n variable the fuel supply rate has
the same dependence. Let us also mention at this point that by taking into account Fick’s law of diffusion, one can
Scientific Reports | (2020) 10:21305 | https://doi.org/10.1038/s41598-020-78229-x 9
Vol.:(0123456789)www.nature.com/scientificreports/
Figure 10. The figure from left shows the frequency of the flame oscillations in the au − av parameter space
illustrated with the color code from the legend. The vertical path suggested by the black line illustrates the path
when one increases the number of candles in the bundle. In the dark blue region there is no limit-cycle and the
system converges to a fix point. The other parameters were chosen as previously: ε = 10−3, c = 5.1. The figure
from right shows the oscillation frequency of the limit cycle on the white line direction in the figure from the
left.
show that in reality k can have also a weak dependence as a function of N, since k ∝ S/V where S is the surface
and V the volume of the flame. Only for the hollow and linear arrangements one would get that S ∝ V , and there-
fore no dependence as a function of N. We will accept in the following this assumption and consider k as fixed.
Before proceeding with these equations we just make a short note on the special case T = T0 and n = n0 ,
which corresponds to a candle that is not burning. Naturally, this has to be a fix point of the system. Both the
original equations (1) and our modified ones (5) has the deficiency that this point will not be an exact fix point.
However, if we assume that the usual flame temperature is much bigger than T0, the Boltzmann factor with the
chemical activation barrier E becomes very low for T0. Therefore, the second terms on the right-hand side of
equations (5) will become negligible relative to the first ones and as a result T = T0 and n = n0 becomes with a
good approximation a fix point. In order to achieve the same situation in the original equations of Kitahata et al.7
one has to add in the equation for the temperature variation the obviously missed +σ T04 term.
Introducing again the non-dimensional parameters from equations (2) with the following modifications
h′ ω1 βc n0 a(n0 ) −c N a(n0 ) −c
ε−1 = ; au = e ; av = e (6)
C ′ k ω2 T0 h′ b(n0 ) k
we get the non-dimensional coupled dynamical equations:
du 1 uc
= −u + au ve u+u
dτ ε
(7)
dv uc
= 1 − v − av ve u+c
dτ
These equations are very similar to the original one, the main differences are however the relation between
the au and av parameters influenced by the number of candles, N, and the oxygen concentration, n0. Also, the last
term due to thermal radiation is neglected. Similarly with the previous system (1), these new coupled dynamical
equations allow for either a limit-cycle or a fix point. For the same parameters as in (1) in the left panel of Fig. 10
we illustrate the frequency dependence in the au − av parameter space. Again, in the dark blue region there is
no limit-cycle, suggesting a stable flame. The form of the non-dimensional parameters au and av from equations
(6) suggest that by increasing the number of candles in the bundle one follows a vertical path in the au − av
parameter space as it is indicated in Fig. 10.
For example in the case of au = 4 we get a region where there is a clear decreasing trend of the oscillation
frequency as a function of av , as it is illustrated in the right panel of Fig. 10. For other au values the behavior is
rather similar, indicating a good agreement with our experimental observations.
The study of the system as a function of the used oxygen concentration n0 is more complicated due to the
unknown a(n0 ) and b(n0 ) kernel functions influencing both the au and av parameters. The a(n0 ) kernel in prin-
ciple can be determined from the results presented in Fig. 8. In experiments we observed that for n0 < 0.17 the
oscillation stops, and for n0 < 0.15 the flame also stops. The results presented in Fig. 10 are in agreement with
these observations. It suggests that there is a stable flame for low av values, as observed in the experiments. Ris-
ing n0 increases both the au and av values. Assuming the b(n0 ) increases in a more substantial manner than a(n0 )
Scientific Reports | (2020) 10:21305 | https://doi.org/10.1038/s41598-020-78229-x 10
Vol:.(1234567890)www.nature.com/scientificreports/
Figure 11. Experimentally and theoretically observed frequency (a), and synchronization order parameter (b),
for the collective behavior of two flames as a function of the separation distance x. For numerical calculations we
used the parameters ε = 10−3, au = 10, av = 2, c = 5.1, γ = 2.52 · 10−3 and the time in numerics was adjusted
to the experimental time-scale by τ = t × 1.9.
we get that there is a possibility that for high n0 values the system has again a fix point instead of the limit-cycle
behavior. This was observed also in experiments for n0 > 0.9 when the oscillation of the flames stopped.
For the collective behavior of two interacting flames we argued experimentally that the coupling through the
thermal radiation is not realistic. Therefore we suggest a novel coupling based on the fact that the oscillation of
each flame creates additional air flux perturbation, increasing the oxygen content around the adjacent flames.
This hypothesis is embedded in the dynamical model by a coupling through the oxygen concentration variation
as indicated in equations (8) for two identical bundles i, j ∈ {1, 2}. The last term in the dynamical equations for
the oxygen concentration in the flames results from a simple argument based on ideal gas expansion and it is
detailed in Supplementary Material, section C. According to this the oxygen concentration in one flame depends
on the temperature change in the other. Any fluctuation in this temperature perturbs the airflow, increasing the
oxygen concentration in the nearby flame and the modulus indicates this symmetry. As detailed in Supplemen-
tary Material, section C, the effect will decrease as the inverse of the square of the distance. Denoting by γ a
proportionality factor, the coupled equation system writes as:
dTi ′ − E
C ′ · b(n0 ) · = ω1 h · b(n0 ) · (T0 − Ti ) + β · a(n0 ) · ni · e RTi
dt
dTj γ (8)
dni − E
= ω2 k · (n0 − ni ) − N · a(n0 ) · ni · e RTi +
dt dt x 2
This new type of coupling reproduces excellently the observed in-phase and counter-phase synchronization
and the frequency of the collective oscillations as function of the separation distance x. Results in this sense
are compared in Fig. 11. For the previously used parameters (ε = 0.001, c = 5.1) and choosing au = 10, av = 2
and γ = 2.52 · 10−3 the theoretical results for the order parameter and the collective frequency are in excellent
agreement if one rescales the time as τ = t × 1.9. The γ parameter governing the distance unit in numerical
calculations was chosen properly, in order to ensure similarity between the collective behavior in the theoreti-
cal and experimental result. The transition region between the in-phase and anti-phase oscillations is clearly
observable in the trends for the frequency and order-parameter. These results give again confidence in the new
model and coupling mechanism.
Discussion and conclusions
The dynamical behavior of diffusion flames is a fascinating phenomena with many aspects still to explore. Here
a specific example was investigated by considering the flame of candle bundles. In agreement with previous
works on this s ystem7–12 we observed experimentally the oscillation of the flames and their collective behav-
ior. Our experimental investigation revealed however further interesting aspects which lead us to modify the
dynamical equations used by Kitahata et al.7. We found that the oscillation frequency of a single candle bundle
decreases with the increasing candle number in the bundle for several arrangement type of the candles. For a
given oxygen concentration in the air, there is both a lower and upper number of candle in the bundle for which
the flame oscillates. Similar results are valid when one changes the oxygen concentration of the air. Increasing
the oxygen concentration will facilitate the appearance of the flickering, and for high enough oxygen concentra-
tion we observed also the flickering of one single candle. In order to explain the observed experimental facts
we have shown that one can modify successfully the dynamical system proposed in7. Similarly, we studied the
synchronized oscillations of two candle bundle flames when they are placed at small distances. In agreement with
previous observations we found in-phase synchronization for short distances and anti-phase synchronization for
larger separation distances. As a function of the separation distance we measured the value of a synchronization
order parameter and the common oscillation frequency. The variation of both quantities suggests a discontinuous
Scientific Reports | (2020) 10:21305 | https://doi.org/10.1038/s41598-020-78229-x 11
Vol.:(0123456789)www.nature.com/scientificreports/
phase-transition at a given distance where the in-phase synchrony changes to the anti-phase synchrony. In order
to accommodate these experimental results in the framework of the dynamical model used for explaining the
oscillation of a single flame, we followed a similar method with Kitahata et al. We first proved that the coupling
mechanism used in7 through a thermal radiation term is unrealistic, and suggested a mechanism via the air
transport. It was found that our coupled system describes excellently all the observed collective phenomena,
including the trends in the synchronization order parameter and common oscillation frequency.
As always, when one reconsiders old and well-studied problems, new aspects of the phenomena are revealed.
This was the case for the present study as well. Surprisingly, we learned that our experiments revealed new and
interesting aspects of this fascinating phenomena. Connecting the oscillation and collective behavior of oscil-
lation of diffusion flames with hydrodynamical instabilities and collective behavior of these would be also an
interesting study in the future. Many pure hydrodynamical experiments reveal similar behavior6, suggesting that
the presence of the flame is not necessary in order to obtain the discussed phenomena. Further experimental
and theoretical studies might bring us closer to a more general understanding. Although such studies are mainly
interesting from the fundamental science perspective, one can also think of many practical applications where
the discussed problems could be relevant: stabilization of flames and hydrodynamic flows, inducing their desired
oscillations either by varying the parameters of the system or by synchronization, controlling many interacting
flames, etc.
Received: 9 October 2020; Accepted: 23 November 2020
References
1. Chamberlin, D. & Rose, A. The flicker of luminous flames. Proc. Symp. Combust. 1–2, 27–32. https://doi.org/10.1016/s1062
-2888(65)80007-7 (1948).
2. Huang, Y., Yan, Y., Lu, G. & Reed, A. On-line flicker measurement of gaseous flames by image processing and spectral analysis.
Meas. Sci. Technol. 10, 726–733. https://doi.org/10.1088/0957-0233/10/8/307 (1999).
3. Durox, D., Yuan, T. & Villermaux, E. The effect of buoyancy on flickering in diffusion flames. Combust. Sci. Technol. 124, 277–294.
https://doi.org/10.1080/00102209708935648 (1997).
4. Durox, D., Yuan, T., Baillot, F. & Most, J. Premixed and diffusion flames in a centrifuge. Combust. Flame 102, 501–511. https://doi.
org/10.1016/0010-2180(95)00051-7 (1995).
5. Zeng, Y. et al. Momentum-dominated methane jet flame at sub-atmospheric pressure. Proced. Eng. 62, 924–931. https://doi.
org/10.1016/j.proeng.2013.08.144 (2013).
6. Yuan, T., Durox, D. & Villermaux, E. An analogue study for flame flickering. Exp. Fluids 17, 337–349. https://doi.org/10.1007/
bf01874414 (1994).
7. Kitahata, H. et al. Oscillation and synchronization in the combustion of candles. J. Phys. Chem. A 113, 8164–8168. https://doi.
org/10.1021/jp901487e (2009).
8. Ghosh, S., Mondal, S., Mondal, T., Mukhopadhyay, A. & Sen, S. Dynamic characterization of candle flame. Int. J. Spray Combust.
Dyn. 2, 267–284. https://doi.org/10.1260/1756-8277.2.3.267 (2010).
9. Forrester, D. M. Arrays of coupled chemical oscillators. Sci. Rep. 5, 16994. https://doi.org/10.1038/srep16994 (2015).
10. Okamoto, K., Kijima, A., Umeno, Y. & Shima, H. Synchronization in flickering of three-coupled candle flames. Sci. Rep. 6, 36145.
https://doi.org/10.1038/srep36145 (2016).
11. Manoj, K., Pawar, S. A. & Sujith, R. I. Experimental evidence of amplitude death and phase-flip bifurcation between in-phase and
anti-phase synchronization. Sci. Rep. 8, 11626. https://doi.org/10.1038/s41598-018-30026-3 (2018).
12. Chen, T., Guo, X., Jia, J. & Xiao, J. Frequency and phase characteristics of candle flame oscillation. Sci. Rep. 9, 342. https://doi.
org/10.1038/s41598-018-36754-w (2019).
13. Yang, T., Xia, X. & Zhang, P. Vortex-dynamical interpretation of anti-phase and in-phase flickering of dual buoyant diffusion
flames. Phys. Rev. Fluids 4, 053202. https://doi.org/10.1103/physrevfluids.4.053202 (2019).
14. Fujisawa, N., Imaizumi, K. & Yamagata, T. Synchronization of dual diffusion flame in co-flow. Exp. Thermal Fluid Sci. 110, 109924.
https://doi.org/10.1016/j.expthermflusci.2019.109924 (2020).
15. FreddyCree. Otsu’s method (2020).
16. Gergely, A. Oscillation of the flame of one candle bundle (2020). https://www.youtube.com/playlist?list=PLamJmxTyiR_0z24T
Xo_ZLWop6NWmcqM65. Accessed 10 Nov 2020.
17. Gergely, A. Effect of oxygen concentration on candle flame oscillation (2020). https://www.youtube.com/playlist?list=PLamJmxTyi
R_0ff7MVK76Ur90D9i4L3C8M. Accessed 10 No 2020.
18. Gergely, A. Candle flame collective oscillation (2020). https://www.youtube.com/playlist?list=PLamJmxTyiR_39EToRagz83yYi-
LdDTrgI. Accessed 10 Nov 2020.
19. Boda, S., Néda, Z., Tyukodi, B. & Tunyagi, A. The rhythm of coupled metronomes. Eur. Phys. J. B 86, 263. https://doi.org/10.1140/
epjb/e2013-31065-9 (2012).
Acknowledgements
The work of Z.N. and B.S. was supported by the UEFISCDI research Grants PN-III-P4-ID-PCCF-2016-0084
and PN-III-P1-1.1-PD-2019-0742. A. G. acknowledges a STAR UBB excellence bursary from the Council for
Research of the Babes-Bolyai University.
Author contributions
Conceptualization by Z.N.; Z.N. , A.G and C.P. conceived the experiments; A.G. and R.T conducted the experi-
ments; Z.N. and B.S. conceived the models; A.G. analysed the results and models; Z.N. and A.G. wrote the first
version of the manuscript. All authors reviewed the manuscript.
Competing interests
The authors declare no competing interests.
Scientific Reports | (2020) 10:21305 | https://doi.org/10.1038/s41598-020-78229-x 12
Vol:.(1234567890)www.nature.com/scientificreports/
Additional information
Supplementary information is available for this paper at https://doi.org/10.1038/s41598-020-78229-x.
Correspondence and requests for materials should be addressed to Z.N.
Reprints and permissions information is available at www.nature.com/reprints.
Publisher’s note Springer Nature remains neutral with regard to jurisdictional claims in published maps and
institutional affiliations.
Open Access This article is licensed under a Creative Commons Attribution 4.0 International
License, which permits use, sharing, adaptation, distribution and reproduction in any medium or
format, as long as you give appropriate credit to the original author(s) and the source, provide a link to the
Creative Commons licence, and indicate if changes were made. The images or other third party material in this
article are included in the article’s Creative Commons licence, unless indicated otherwise in a credit line to the
material. If material is not included in the article’s Creative Commons licence and your intended use is not
permitted by statutory regulation or exceeds the permitted use, you will need to obtain permission directly from
the copyright holder. To view a copy of this licence, visit http://creativecommons.org/licenses/by/4.0/.
© The Author(s) 2020
Scientific Reports | (2020) 10:21305 | https://doi.org/10.1038/s41598-020-78229-x 13
Vol.:(0123456789)You can also read