Flood classifications in Queensland - A best practice guide for local governments
←
→
Page content transcription
If your browser does not render page correctly, please read the page content below
Flood classifications
     in Queensland
 A best practice guide for local governments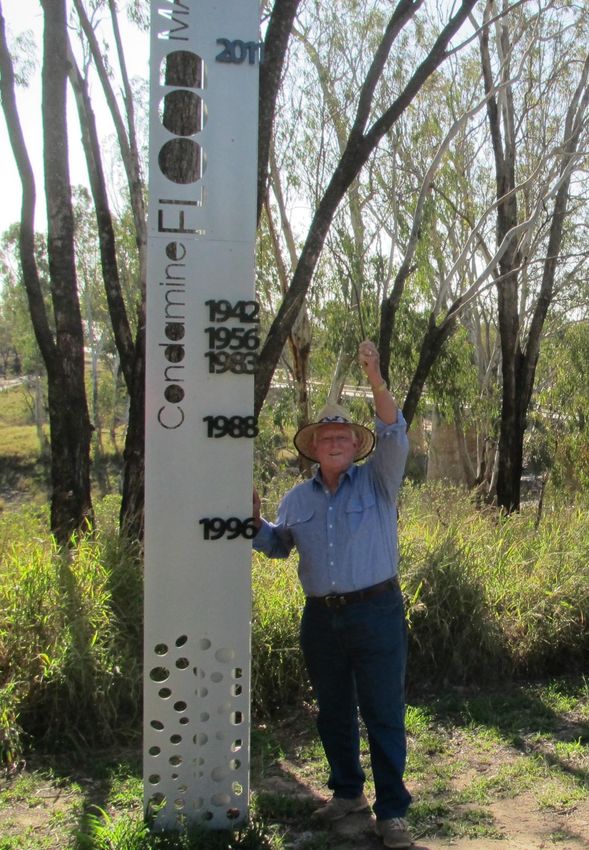
Interpreter
      Document details
      Security classification: Public
      Date of review of security classification: June 2020
      Authority: Queensland Reconstruction Authority
      Document status: Final
      Version: 1.0
                                                                                   The Queensland Government is committed to providing
      QRA Reference: DOC/19/62305
                                                                                   accessible services to Queenslanders from all culturally and
                                                                                   linguistically diverse backgrounds. If you have difficulty in
      Copyright
                                                                                   understanding this publication, you can access the Translating
      This publication is protected by the Copyright Act 1968.
                                                                                   and Interpreting Services via www.qld.gov.au/languages or by
      © The State of Queensland (Queensland Reconstruction
                                                                                   phoning 13 14 50.
      Authority) June 2020.
                                                                                   Disclaimer
      Licence
                                                                                   While every care has been taken in preparing this publication,
                                                                                   the State of Queensland accepts no responsibility for decisions
                                                                                   or actions taken as a result of any data, information, statement
                                                                                   or advice, expressed or implied, contained within. To the best of
      This work is licensed by State of Queensland (Queensland
                                                                                   our knowledge, the content was correct at the time of
      Reconstruction Authority) under a Creative Commons Attribution
                                                                                   publishing.
      (CC BY) 4.0 International licence. To view a copy of this licence,
      visit: www.creativecommons.org/licenses/by/4.0/
                                                                                   Consultation
      In essence, you are free to copy, communicate and adapt this
                                                                                   Developed in consultation with the Bureau of Meteorology.
      publication, as long as you attribute the work to the State of
      Queensland (Queensland Reconstruction Authority).
                                                                                   Copies
                                                                                   Copies of this publication are available on our website at
                                                                                   www.qra.qld.gov.au/flood-classifications
       Image: (cover) Gauge, located at Bedourie,                                  Further copies are available upon request to:
       (below) Flooding, Fitzroy River, Rockhampton, 2011,                         Queensland Reconstruction Authority
       (right) manual gauge, Fitzroy River.                                        PO Box 15428
                                                                                   City East QLD 4002
                                                                                   Phone (07) 3008 7200
                                                                                   info@qra.qld.gov.au
                                                                                   www.qra.qld.gov.au

2 | Flood classifications in Queensland – A best practice guide
                                            step-by-step  guide for
                                                                 for local
                                                                      local governments
                                                                            governments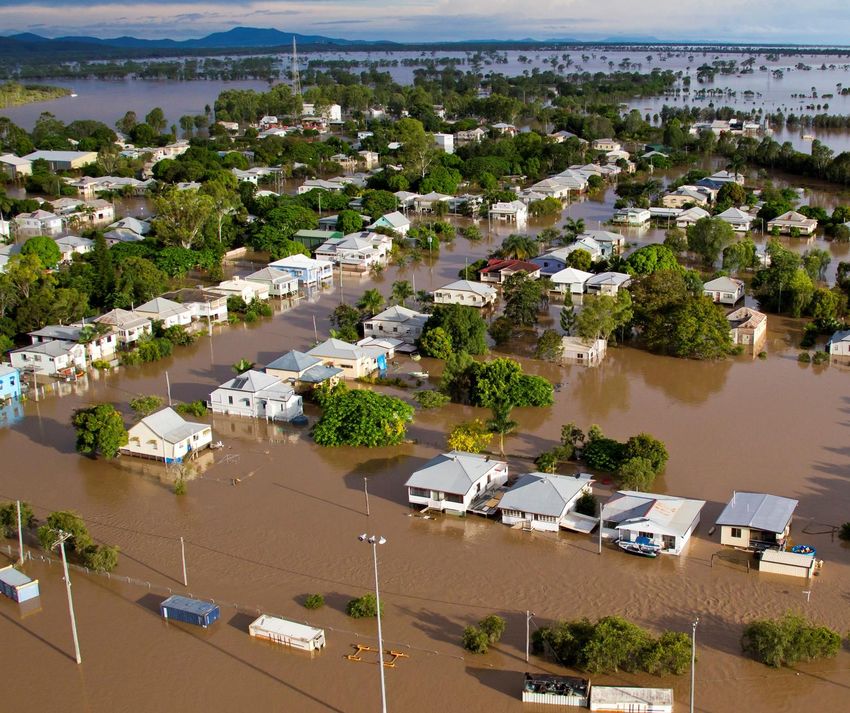
About this guide
Flood classifications in Queensland –                        Audience for this guide
A best practice guide for local governments
                                                             The intended audience for this guide is primarily local
The aim of this guide is to assist Queensland’s local        government authorities, however additional audiences
governments to understand:                                   may include:
• flood classifications                                      • local disaster management groups
• river heights and flood forecasts                          • district disaster management groups
• different types of gauges                                  • emergency and disaster management stakeholders
• flood warnings based on a river height                        and professionals
• how to determine and set flood classifications             • state and federal government agencies
• considerations when reviewing flood                        • experts across the range of natural disasters, hazards
   classifications                                              and risk management
• roles and responsibilities of key stakeholders.            • non-government organisations who have a role in
                                                                prevention, preparedness, response and recovery.
The guide has been developed in consultation with
the Bureau of Meteorology (the Bureau). It clearly           Resilient Queensland
outlines the four steps for local governments to be
able to review flood classifications:                        This guide is an initiative of Resilient Queensland 2018-
1. map community assets                                      2021, and aligns with all four objectives of the
2. relate impacts to a gauge or forecast location            Queensland Strategy for Disaster Resilience:
3. identify impacts and link to a gauge height               1. We understand the potential disaster risks we face
4. consider community education and awareness                2. We work together to better manage disaster risk
     (flood mapping).                                        3. We seek new opportunities to reduce disaster risk
                                                             4. We continually improve how we prepare for, respond
                                                                 to and recover from disasters.

                                                   Flood classifications in Queensland – A best practice guide for local governments   |3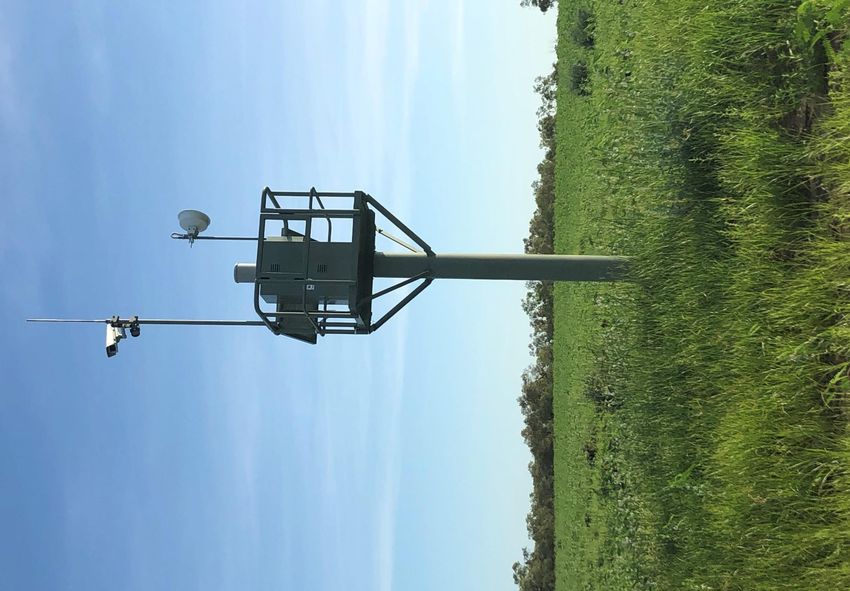
Contents

              About this guide                                                          3
              Understanding floods                                                      5
              Flood Warnings in Queensland: Roles and responsibilities                  6
              Flood classifications                                                     7
              River heights and flood forecasts                                         8
              Gauge types and functions                                                 9
              Describing the Flood Warning Service                                      10
              Setting flood classifications                                             11
              Considerations when reviewing flood classifications                       12
              Initial sources of flood information                                      13
              Step-by-step guide to review flood classifications                        14
                  Step 1. Map community assets                                          15
                  Step 2. Relate impacts to a gauge or forecast location                16
                  Step 3. Identify impacts and link to a gauge height                   17
                  Step 4. Community education and awareness (flood mapping)             22
              Ongoing review of the flood classifications                               25

            Image: Flood Warning Infrastructure Network meeting, Rockhampton.

4 | Flood classifications in Queensland – A best practice guide for local governments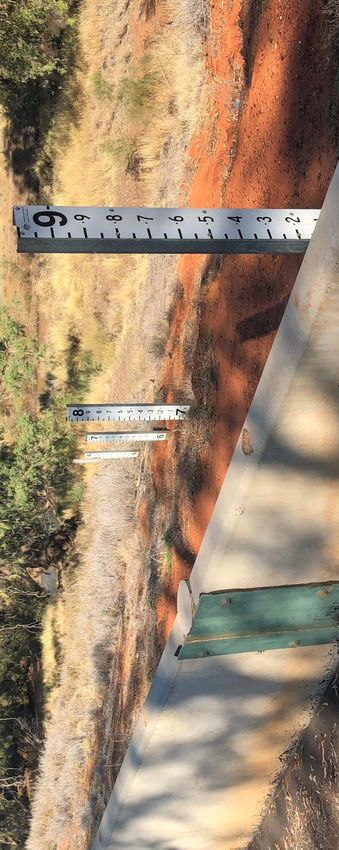
Understanding floods
Floods are a natural part of the Queensland                    Floods impact on both individuals and communities,
landscape. Floods vary greatly in size, extent,                and have social, economic, and environmental
duration and frequency. No flood is the same, and              consequences. The consequences of floods, both
as such floods can have different impacts.                     negative and positive, vary greatly depending on
                                                               the location and extent of flooding, and the
Sudden, heavy and intense rainfall can cause floods            vulnerability and value of the natural and
to quickly rise in the minutes or hours that follow.           constructed environments they affect.
These are known as flash floods and are typically
associated with relatively small catchment areas.              Through data collection and analysis, city
                                                               administrators, hydrologists, engineers and
Floods can occur slowly in large catchment areas,              planners identify and delineate those areas likely to
where rainfall can build up over hours, days or                be exposed to flood waters and where possible
weeks. The runoff from this rainfall may create                mitigate the likely impacts of future floods.
significant floods that inundate large areas of land
for days, weeks or months.                                     Therefore a flood prediction and or warning is of
                                                               little value unless the community understands what
                                                               it means with regards to the likely impact and what
                                                               they need to do in response to their individual
                                                               situation.

                   Channel of a river                            Useful resource

                                                                 The Bureau of Meteorology has published an
                                           Town                  article titled Explainer: what is a flood? (2019) to
                                                                 help us understand floods, what causes floods,
                                                                 and how to know if there’s one on the way.

                                                                 The article also contains educational videos that
                                                                 cover understanding floods, topographic
                                                                 drainage divisions and river regions.

Flood hazard area, for                                           http://media.bom.gov.au/social/blog/2156/exp
 example the 100 year                                            lainer-what-is-a-flood/
           floodplain

                                                                                     Image: (top) Flooding, Fitzroy River, 2011.

                                                  Flood classifications in Queensland – A best practice guide for local governments |   5
Flood warnings in Queensland: Roles and responsibilities
       In Queensland, the effectiveness of the flood warning                     The Service Level Specification (SLS) for Flood
       system depends on the cooperative involvement of the                      Forecasting and Warning Services for Queensland
       Bureau of Meteorology (the Bureau), Queensland                            Version 3.1 (2018) is provided to Queensland by the
       Government agencies and local governments working                         Bureau, in consultation with the Queensland Flood
       with flood-threatened communities.                                        Warning Consultative Committee.

       The roles and responsibilities of all key stakeholders                    The SLS describes the flood forecasting and warning
       involved in the provision of a flood warning service in                   services provided by the Bureau for Queensland and
       Queensland are described in the National                                  is available at
       Arrangements for Flood Forecasting and Warning                            http://www.bom.gov.au/qld/flood/brochures/QLD_S
       (Bureau of Meteorology, 2015) available at                                LS_current.pdf.
       http://www.bom.gov.au/water/floods/document/Natio
       nal_Arrangements_V4.pdf.                                                  Queensland flood forecast locations
                                                                                 The SLS provides Queensland’s full list of forecast
       Coordination of the development and operation of flood                    locations in the SLS (Schedule 2 on p18) which
       warning services in Queensland is via the Queensland                      includes station owners, gauge type, and flood
       Flood Warning Consultative Committee (FWCC), a joint                      classification.
       Commonwealth, state and local government committee
       chaired by the Bureau.

       Local government responsibilities
       The National Arrangements for Flood Forecasting and
       Warning state that in Queensland the establishment of
       flood classification levels rests with local government,
       in consultation with the Bureau.

       These levels are determined by local government,
       based on the Bureau’s standard descriptions of flood
       effects, historical data and relevant local information.
       After councils determine the level and impacts, these
       are used by the Bureau when flood warnings are issued
       for the location.

       Flood classifications can be revised at any time and
       should be reviewed if there have been any changes to
       infrastructure or flood behaviour that impacts a
       community.
                                                                                   Image: (inset) The Service Level Specification and Warning
                                                                                   Services for Queensland – Version 3.1 .
                                                                                   Image: (top) Flinders Highway bridge damage, Monsoon Trough,
       .
                                                                                   2019.

6 | Flood classifications in Queensland – A best practice guide for local governments
Flood classifications
 The Bureau of Meteorology (the Bureau) uses a
 three tiered classification scheme that defines              Useful resource
 flooding as minor, moderate or major at key river
 height stations, known as the river gauge                    Video: The Bureau of Meteorology video titled
 locations. Each classification is defined by the             Understanding Flood Classifications explains
 water level that causes certain impacts upstream             the Minor, Moderate and Major flood
 and downstream of the station. These levels have             classifications, and the difference between
 been determined and described based on                       flood watches and warnings. It is available on
 standard descriptions of flood effects (see                  YouTube at:
 below), historical data and relevant local                   https://www.youtube.com/watch?v=gKDPgp5D
 information.                                                 s9s

 MINOR FLOODING - Causes inconvenience. Low-
 lying areas next to watercourses are inundated.
 Minor roads may be closed and low-level bridges
 submerged. In urban areas inundation may affect
 some backyards and buildings below the floor
 level as well as bicycle and pedestrian paths. In
 rural areas removal of stock and equipment may
 be required.

 MODERATE FLOODING - In addition to the Minor
 flood effects, the area of inundation is more                Useful resource
 substantial. Main traffic routes may be affected.            Manual 21: Flood Warning (2009) from the
 Some buildings may experience water above the                Australian Disaster Resilience Knowledge Hub at
 floor level. Evacuation of flood affected areas              www.knowledge.aidr.org.au (Note: This manual
 may be required. In rural areas removal of stock             was under review at the time of publication) .
 is required.

 MAJOR FLOODING - In addition to the Moderate
 flood effects, extensive rural areas and/or urban
 areas are inundated. Many buildings may be
 affected above the floor level. Properties and
 towns are likely to be isolated and major rail and
 traffic routes closed. Evacuation of flood affected
 areas may be required. Utility services may be
 impacted.

                                                                                      Image: (top) Flooding, Condamine River.

                                                 Flood classifications in Queensland – A best practice guide for local governments   |7
River heights and flood forecasts

         Understanding river heights                                               The Bureau uses hydrological computer models to
                                                                                   determine:
         We can significantly improve the disaster resilience                      • how much rainfall will run off different parts of
         of Queensland communities by increasing our                                  the catchment
         understanding of flood risk, river height levels and                      • how water from different tributaries converges
         impacts, and flood warning systems.                                          in the river network
                                                                                   • how long it will take for runoff to reach major
         Rainfall and river height level data is published on                         waterways
         the Bureau’s website at                                                   • time water will take to travel to known points in
         http://www.bom.gov.au/qld/flood. This                                        the river system.
         information is used by emergency services and
         other operational agencies, commercial                                    Flood warning infrastructure
         businesses and the public to monitor rainfall and
         river conditions.                                                         There are various types of flood warning
                                                                                   infrastructure that capture data and information for
         The Bureau uses the data it collects for enhanced                         the Bureau.
         hydrological modelling used for flood predictions.
                                                                                   Rain gauges monitor the amount of rain falling on a
         River heights can be referenced to key locations or                       catchment.
         relevant landmarks (e.g. nearby crossings/bridges
         or causeways), and referenced to the levels at                            River gauges measure water levels along our river
         which flooding can affect residential and other                           systems.
         buildings, and cropping/grazing land.
                                                                                   Satellites, radars, rainfall and river level gauges are
         Community engagement is an important step                                 generally the tools that the Bureau uses for their
         during any review of flood classifications. When the                      warning predictions.
         impacts and consequences of rising river water are
         understood by the community, flood warnings are                           Manual rain and river gauges are read by
         at their most effective.                                                  volunteers who visit the gauge and report to the
                                                                                   Bureau on the amount of rain that has fallen or the
         Flood forecasts                                                           height of the river on an hourly or daily basis.

         Flood forecasts are critical to emergency responses                       Automatic rain and river gauges use a range of
         to avoid loss of life and limit property damage.                          sensors that relay data to the Bureau on a real time
                                                                                   basis either using 3G/4G or VHF.
         Flood forecasters at the Bureau rely heavily on real-
         time data from radars, rainfall and river water
         heights.                                                                 Image: (top) Automatic gauge at Emerald, Eastern Side,
                                                                                  Central Highlands Regional Council.

8 | Flood classifications in Queensland – A best practice guide for local governments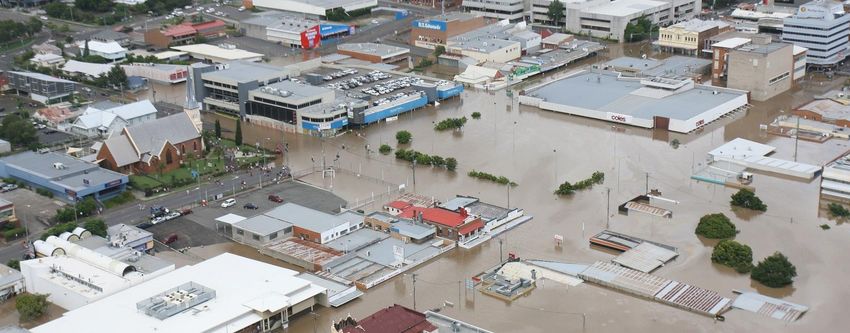
Gauge types and functions

  Images: Types of gauges
            A. Automatic rain gauge
            B. Automatic rain and river gauge with a manual river gauge used as a backup
            C. Department of Natural Resources, Mines and Energy (DNRME) gauge hut used for water
               quality, water management, capturing rainfall and river flood height
            D. Automatic water level gauge usually found in creek systems
            E. Rain and river height gauge with a camera
            F. Manual river height gauge
            G. Manual river height gauge
            H. Manually read rain gauge

 A                                  B               C                                             D

 E                                  F                     G                                   H

Image: (top) DNRME Gauge, Burke River.

                                                 Flood classifications in Queensland – A best practice guide for local governments   |9
Diagram: The various types of gauges placed in a catchment to
   allow the Bureau to provide effective and timely flood warning.

      Describing the Flood Warning Service

       The Bureau will provide detailed flood warnings for                          Information location
       key locations and general flood warnings to other                            An information location is a location at which
       locations, which typically include a statement about:                        observations of water level data are provided, and
       • reference to the relevant flood classification which                       where flood classifications (minor, moderate or
          provides potential impact information                                     major) are defined.
       • current and expected levels of flooding at a key
          location                                                                  Forecasts of projected future water levels are not
       • weather forecast                                                           provided.
       • latest available observations of river height and
          rainfall in the area.                                                     Information locations also assist the Bureau with
                                                                                    warnings to forecast locations.
       To assist in describing a Flood Warning Service, the
       gauge locations where river height observations are
       made are categorised into three types:
                                                                                    Data location
       • forecast location                                                          A data location is a location for which only the
       • information location                                                       observed water level data is provided.
       • data location.
                                                                                    Flood classifications (minor, moderate or major)
                                                                                    are not available for these locations and forecasts
       Forecast location                                                            of future water are not produced.
       A forecast location as outlined in Schedule 2 of the
       Service Level Specification is a location for which the                      Data locations provide the Bureau with data to
       Bureau provides a forecast of a future water level                           make predictions at information locations and
       either as the class of flood that is predicted (minor,                       forecast locations.
       moderate or major) or as a level and class e.g. 4.6
       metres – MAJOR flood level.

10 | Flood classifications in Queensland – A best practice guide for local governments
Setting flood classifications
Local governments in Queensland, through
their Local Disaster Management Group In Queensland the establishment of
(LDMG), are responsible for the initial flood classification levels
determination, review and update of flood rests with local government,
classifications in their area. This is done in in consultation with the Bureau.
consultation with the Bureau and other
relevant state agencies (e.g. Sunwater) so they
accurately reflect the impacts at key river Flood classifications allow the expected or
height stations. observed impact and severity of flooding to
be clearly communicated and understood by
Based on that information the Bureau will the:
ensure that flood watches and warning advices
are relevant and effective. a. community
b. State Disaster Coordination Centre
Additionally, flood classifications require (SDCC)
regular review to ensure they continue to
reflect the expected or known flood impacts. c. Australian Government Crisis
Local development or changes to infrastructure Coordination Centre (AGCCC) in some
(e.g. bridges/levees) are common reasons that situations.
flood classifications may require review.
There is a risk that incorrect flood
Flood classifications for all stations in classifications can breed complacency in the
Queensland are part of the Flood Warning community – “it’s just another major flood.”
Network and are listed by the Bureau in the
SLS. The SLS is generally updated on an
annual basis. Image: (top) Flooding, Idalia, Townsville, 2019.
Image (below): Example from the SLS.
Flood classifications in Queensland – A best practice guide for local governments | 11Considerations when reviewing flood classifications
The following checklist is provided as a guide for Investigate whether there have been any flood
the review of flood classifications. studies or modelling undertaken in the area
since the last review of flood classification
Check current flood classifications and when that might provide more information and
they were last reviewed / updated. context.
Determine, if possible, how the existing flood Check if the river height station has been
classifications were established (i.e. based on relocated, rebuilt or modified in any way since
past floods, survey details, or detailed flood the flood classifications were last reviewed.
mapping). Has the gauge zero (point above which the
water level is measured) been adjusted? Is
Collect all of the available sources of flood there a confusion as to which river height
impacts. This may include the identification of station is the point of reference?
flood marks or debris lines, which can be
surveyed for extra context. This data Determine if there has been any development
collection process is likely to include a cross- or physical changes in the area (e.g. levee
section of stakeholders from local, state and construction, bridge works) since the flood
federal agencies as well as asset classifications were last reviewed / updated.
infrastructure owners, the general public and
business owners in the community. If there is no impact or community
consequence at a location, there may not be a
Check to see what critical infrastructure and need for a flood classification. Sometimes the
other important community infrastructure has original reason it was put in place is no longer
been surveyed (or needs to be) and could be relevant e.g. a bridge that previously flooded
affected or impacted e.g. bridge decks and has been raised or recent mitigation works
approaches, community facilities, habitable have alleviated the risk and community
floor areas for at risk locations, etc. impacts.
Check if the flood classifications are in line Once flood classifications are updated,
with the expected or known flood impacts community education is required to ensure
across the community, as per flood the changes are well understood. Ensure the
classification definitions (minor, moderate, updates are added to the disaster
and major). management, sub plans and operating
procedures for both the Local Disaster
Check if the flood classifications and impacts Management Group (LDMG) and District
are reflected in the current local disaster Disaster Management Group (DDMG).
management plans, arrangements, sub plans
and any other associated plans.
Image: Flood Warning Infrastructure Network workshop,
Cloncurry, September 2019.
12 | Flood classifications in Queensland – A best practice guide for local governmentsInitial sources of flood information
Flood classifications are impact-based. All available Local knowledge
information, including flood mapping and local
knowledge, needs to be assessed in determining the Local knowledge is invaluable and is considered by
flood classification. the Bureau as the most critical of information
sources.
Flood mapping
Local knowledge is likely to be held by council staff,
Outputs from flood studies provide an initial disaster management agencies (including SES),
assessment into the probable flood extent and generational landowners and residents, the Bureau,
potential impacts as well as a flood height at a known state water agencies, catchment management
gauge location. authorities and other interested parties.
Flood classifications are linked to on-the-ground
impacts. Outputs of a flood study are primarily used for
land use planning purposes to identify those areas
that are most at risk of flooding. They also provide a
visual representation of possible flood inundation.
Image: (above) Example of a flood map showing the
flood extent of a modelled event. Graphic: (above) The relationship between flood classification
Image: (top) Currawong Station on the Maranoa River , near Mitchell. and community impacts .
Flood classifications in Queensland – A best practice guide for local governments | 13Step-by-step guide to review flood classifications
Four steps to review
flood classifications
The four steps to review flood classifications
are outlined in the following sections of this
guide:
Step 1.
Map community assets
Step 2.
Relate impacts to a known
river gauge or forecast
location
Step 3.
Identify the community
impacts and link them to a
gauge height
Step 4.
Community education and
awareness (flood mapping)
Image: (top) Courtesy of Queensland Museum Network, photo by Gary Cranitch, (inset) Warwick flood classification board.
14 | Flood classifications in Queensland – A best practice guide for local governmentsStep 1. Map community assets
Map your important community assets Data sources
Flood classifications are in place to understand Primary sources include:
how things the community values may be impacted • council asset databases (the council asset
during a flood event. databases are always the primary point of
truth)
Key considerations • any existing flood studies
• What are the important assets to the • local knowledge
community? • historical records.
• What are the important assets for council that if
impacted will affect service delivery?
Secondary sources include:
The first step in the process is to map the area of • Queensland Globe (QGlobe)
interest and surrounding area, including • Queensland Emergency Management Risk
community assets such as: Framework (QEMRF) data catalogue.
• building and infrastructure
• human and social aspects (parks, areas of Checklist - Before you move to Step 2
cultural importance, etc.) There is survey data of critical locations
• roads, bridges and other transport that can be related to a river gauge.
infrastructure Map (printed or in digital form) clearly
• environmental assets identifies the important community assets
• economic assets impacted.
• other points of interest. Guidance from the community and relevant
interests defines the important community
Assistance assets.
For local governments with access to a GIS system, Critical infrastructure that will affect service
seek assistance from your spatial team for this delivery, if impacted, has been identified.
task.
For local governments without a GIS capability,
utilise the Queensland Globe (seek training from
the Department of Natural Resources, Mines and
Energy if you have not used it before). The
Queensland Globe is published at:
https://qldglobe.information.qld.gov.au/
Image: (top) Flooding in central Ipswich, 2011.
Flood classifications in Queensland – A best practice guide for local governments | 15Step 2. Relate impacts to a gauge or forecast location
Relate impacts back to a known gauge or For initial detail on this gauge, key flood heights
forecast location are recorded at each forecast location within a
catchment. It is likely that the Bureau may hold
The first step to link impacts back to a known additional information for all of the other stations
gauge or forecast location is understanding where in the catchment area so it is worthwhile
the gauges are located. involving the Bureau at this stage.
The Bureau provides river height brochures and
flood warning network maps to assist council in Useful resources
building this knowledge.
Flood Warning in Queensland
Each river brochure outlines flood risk, current http://www.bom.gov.au/qld/flood/brochure
flood classifications, and most importantly a table s/qld/fld_qld.shtml
that summarises the flood history of the named
river catchment. Queensland River Maps
http://www.bom.gov.au/qld/flood/brochure
Select or confirm the gauge that will be used. s/river_maps.shtml
Image: An example of flood history tables for the Fitzroy River.
16 | Flood classifications in Queensland – A best practice guide for local governmentsStep 3. Identify impacts and link to a gauge height
Templates to identify impacts and link
these to a gauge height
Sample templates on the following pages
demonstrate how councils can identify impacts
and link them to a gauge height for minor,
moderate and major flood classifications.
The sample templates are available for
download at:
www.qra.qld.gov.au/flood-classifications.
Image: (top) Manual gauge at Charleville which is the forecast
location, (right) Burdekin Cislowski Road, Plantation Creek.
17 | Flood classifications in Queensland – A best practice guide for local governmentsFlood classification Impact Yes / no (where) Expected Height
height of at
(Forecast location)
impact gauge
Inconvenience Yes No 1.2m 3.5m
MINOR example: Bottom of Lemke
Causes inconvenience. Park next to river and
Low-lying areas next to playground
watercourses are Low lying Yes No 1.25m 3.5m
inundated. Minor roads areas
may be closed and low- example: Yorks Flats along
level bridges submerged. with Kerry Rd
In urban areas inundation Minor roads Yes No 1.2m 3.6m
may affect some closed
backyards and buildings example: End of Blacks Rd
below the floor level as and Jeremy St
well as bicycle and Low level Yes No
pedestrian paths. In rural bridges
areas, removal of stock
and equipment may be Inundation in Yes No 1.3m 3.7m
required. urban areas
example: Stafford Lowlands
and parts of Anzac Avenue
Backyards Yes No 1.3m 3.7m
inundated
example: Backyards along
Jeremy St in Stafford
Lowlands, approx. 14
backyards
Buildings Yes No
below floor
level
Bicycle and Yes No
pedestrian
paths
impacted
Stock are Yes No 1.3m 3.7m
being moved
example: Properties along
to higher
Yorks Flats next to river are
ground
moving cattle
Farm Yes No 1.25m 3.5m
equipment
example: Pumps and
being moved
irrigation equipment being
moved along upper Shaw Rd
adjacent to Spring Creek
18 | Flood classifications in Queensland – A best practice guide for local governmentsFlood classification Impact Yes / no (where) Expected Height
height of at
(forecast location)
impact gauge
Yes No
MODERATE Inundation in
some areas example: End of Chambers
Rd is now closed. Chambers 2.6m 5.2m
In addition to the minor is more
effects, the area of substantial Flat and surrounding areas
inundation is more are inundated
substantial. Main traffic Yes No
routes may be affected. Main traffic
Some buildings may be routes may example: Main axis route into 2.7m 5.3m
affected above the floor be affected township (Flinders Hwy) is
level. Evacuation of closed to the north
flood affected areas may Yes No
be required. In rural Some
buildings are example: Buildings in
areas, removal of stock
likely to be Ramsey Industrial estate are
is required. 2.8m 5.4m
affected being impacted above floor
above floor level. Just for Cars and
level Detroit Diesel businesses are
being inundated
Evacuation of Yes No
flood
affected
areas may be
required
Yes No
example: All stock along
Stock needs properties within Chambers
to be moved Flat, Ferry Downs, Johnstone 2.6m 5.2m
to higher Pike and Tree Tops are being
ground inundated. Stock are
currently being moved to
higher ground
Farming Yes No
equipment example: All properties along
(pumps and eastern side of Charmeston 2.6m 5.2m
irrigation River down to Peaks Crossing
lines) need to will need to move farming
be moved equipment
19 | Flood classifications in Queensland – A best practice guide for local governmentsFlood Impact Yes / no (where) Expected Height at
classification height of gauge
impact
(Forecast
location)
Yes No
MAJOR Extensive rural
example: Chambers Rd is
areas are
now closed. All properties 4.3m 6.7m
In addition to the inundated and
moderate effects, isolated along Road are now
extensive rural inundated
areas and/or Urban areas are Yes No
urban areas are inundated and in
inundated. Many example: All streets
some areas
buildings may be around Kitchener Rd are 4.4m 6.8m
islands with
affected above the inundated and isolated
isolation are
floor level. identified
Properties and
towns are likely to Many buildings are Yes No
be isolated and impacted and example: approx. 107 4.4m 6.8m
major rail and affected above homes within Boundary
traffic routes floor level Suburb are effected
closed. Evacuation
of flood affected Yes No
Properties and
areas may be Example: Tree Tops and
townships are
required. Utility Ferry Downs are now 4.5m 6.9m
likely to be
services may be isolated. Township of Ferry
isolated
impacted. Downs is affected heavily
Yes No
Major rail and example: Main line at Tree
traffic routes are Tops and Ferry Downs is 4.5m 6.9m
closed closed. Main traffic route
north is closed in multiple
locations
Yes No
Evacuation of flood example: All properties
affected areas may along eastern side of 4.5m 6.9m
be required Charmeston River down to
Peaks Crossing will need to
move farming equipment
Yes No
Utility services All services in Tree Tops,
Ferry Downs, Scatia Plains 4.5m 6.9m
may be impacted
and Kamarooka are
impacted
20 | Flood classifications in Queensland – A best practice guide for local governmentsCommunicating the hazard
Example: River flood impacts
This is an example of river flood information shared with a community on the impact and
consequences of rising water during a flood.
Height Impacts
7.0m – South River Road flooded
East Carnarvon flooded
7.6m Water flowing out of Nickol Bay Flats
Town levees designed to withstand 1961 flood or 7.61 metres at
Nine Mile Bridge with 1.22 metres (4 feet) freeboard
MAJOR
6.7m All breakouts flowing
6.5m Water severs North West Coastal Highway at Geraldton turnoff
and the road must be closed
Water flows across South River Road
Old Nine-Mile Bridge is overtopped
River flood effects
Carnarvon is isolated by road
East Carnarvon and South River Road are liable to flooding
6m Overflow into McGlad Road area
As the River level rises the flow is reversed as water flows out of
Nicol Bay Flats
MODERATE
5.0m – North River Road severed approximately 1.1 km west of Plantation
Crossing
5.5m
4.5m Gully overflows through assessments 110 and 113
3.5m – Lewers Island cut off
4.0m
3m Lewers Creek commences flowing
MINOR
2.3m Bibbawarra Crossing is overtopped
1.8m Lewers Creek starts backing up
21 | Flood classifications in Queensland – A best practice guide for local governmentsStep 4. Community education and awareness (flood mapping)
Community education and awareness about flood Education and information flood maps should relate to
maps and / or mapping products are vital for the levels on stream gauges via the following two
communication of flood behaviour and the hazard. processes:
Maps are a useful tool, however, community 1. Mapping of flood model results at increments that
education should be based around the community directly correlate to levels on the gauge (rather
impacts, possible consequences, and actions in than peak values). Depending on local flood
response at various gauge levels. Refer to the graphic behaviour, this might be at half metre increments
“Communicating the hazard” on the previous page. or coarser / finer increments as warranted.
Community engagement communication materials Additional levels relating to planning and critical
should recognise that your community will have infrastructure for example (such as development
different needs in interpreting flood information so levels or levee immunity levels) are also valuable
the style of communication will need to cater to for emergency management purposes and should
different needs. be described in public information.
2. Inclusion of a location-specific flood totem icon or
sign that displays:
Useful resources
• the flood classifications of minor / moderate
/ major flood levels (if available)
Community Engagement Framework
• peak levels of historic flood (noting the date
(Handbook 6) produced by Emergency
of the flood)
Management Australia
• relevant design flood levels (particularly the
https://knowledge.aidr.org.au/resources/ha
Defined Flood Event)
ndbook-6-community-engagement-
• levels of local landmarks (such as the town
framework/
bridges or the local post office steps).
Building Resilience to Natural Disasters – Where a flood height relates to a particular level
Collaboration Guide available at on the gauge, this value should also be clearly
https://www.qra.qld.gov.au/resilient- highlighted on the totem.
queensland/collaboration-guide
Image: (top) Example of a flood map showing flood extent at 5.4m on
the gauge at Killarney (flood evacuation map, yellow zone).
22 | Flood classifications in Queensland – A best practice guide for local governmentsBuilding community awareness and education Key messages
It is important to commence active and targeted Flood classifications need to be meaningful and
community engagement and education in the review relevant to the community before and during a flood
process and after changes to the flood warning event as they are built into to the warnings issued by
service have been formalised by the Bureau. the Bureau.
Community meetings, media releases, social media Therefore accurate flood classifications are required
posts with supporting brochures and handouts that to ensure that relevant warnings are issued and to
identify the hazard, likely impact and consequences of ensure that the community properly understands the
rising water and actions are methods that may be likely impacts and consequences to rising water and
utilised to deliver this message in preparation for what to do in response.
future events.
A change to flood classifications does not change
It is important that any community engagement has a flood readings. In other words, a 6m flood is still a 6m
clear aim, objectives and succinct key messages. flood and will have the same impact and effects.
Outlined below is a generic starting point councils
might use. If flood classifications are understated, we expose our
community to risk. Any review will determine whether
Aim this should be called a minor, moderate or major flood
• Review flood classifications within the council area level.
against the decision-making framework and
national guidelines for flood warnings as outlined
in this document.
Supporting material and resources
Objectives
• Identify those in the community who receive flood Resources, supporting material and examples are
warnings and public information available from
• Local Government Authorities,
• Identify the impacts that must be communicated • the Queensland Reconstruction Authority and,
during flood events • The Bureau of Meteorology.
• Identify the range of community understanding of
flood classifications, what it means to them and A resource sheet is provided on the following page.
what do they do with the information
• Identify to what extent relevant impacts can be
inferred from predictions at the particular forecast
location
• What actions do you expect the community to take
Image: Mary River resilience workshop.
at various gauge heights as forecasted by the
Bureau?
23 | Flood classifications in Queensland – A best practice guide for local governmentsEducational videos
The Queensland Reconstruction Authority (QRA) The video topics include:
has produced a series of short educational videos • Understand your flood risk
to help Queenslanders understand flood risk at: • Flood warnings
https://www.qra.qld.gov.au/understand-your- • Flash flooding
flood-risk • Riverine flooding
• How Queensland’s river catchments work.
Understanding flood classifications Fact sheet examples
To assist with community awareness, councils Many councils provide examples of interactive
can also link to the Bureau’s educational video flood mapping on their websites to assist local
on flood classifications. residents to determine their flood risk.
Image: Southern Downs Regional Council has a number of
good examples of flood emergency action guides that explain
The video is available at:
flood classifications and how to use maps. These are available
https://www.youtube.com/watch?v=gKDPgp5 on Council’s website at
Ds9s&feature=youtu.be https://www.sdrc.qld.gov.au/council/disaster-
management/flood-fact-sheets-and-information
24 | Flood classifications in Queensland – A best practice guide for local governmentsOngoing review of the flood classifications
Once the flood classifications have been assessed Therefore, an annual assessment of flood impact is
for a local government area it is important to keep encouraged across all councils to ensure flood
them relevant. classifications remain consistent with expected
impacts at the particular location.
Development of any nature can occur in a
floodplain. This may either positively or negatively A simple example of how this can be recorded is
impact flood effects and likely consequences on a set out below.
town, locality or infrastructure.
If a change is required follow the process outlined
Development of particular note includes bridge and in this document starting with Step 1.
other river crossing upgrades and flood mitigation
works like a levee or creek diversion.
Forecast Location (Name of location)
Flood Classification Revised Height at Date Next assessment
Gauge
MINOR 3.5m 22 Aug 2019 22 Aug 2021
MODERATE 5.2m 22 Aug 2019 22 Aug 2021
MAJOR 6.9m 22 Aug 2019 22 Aug 2021
Image: (top) Diamantina Shire Council.
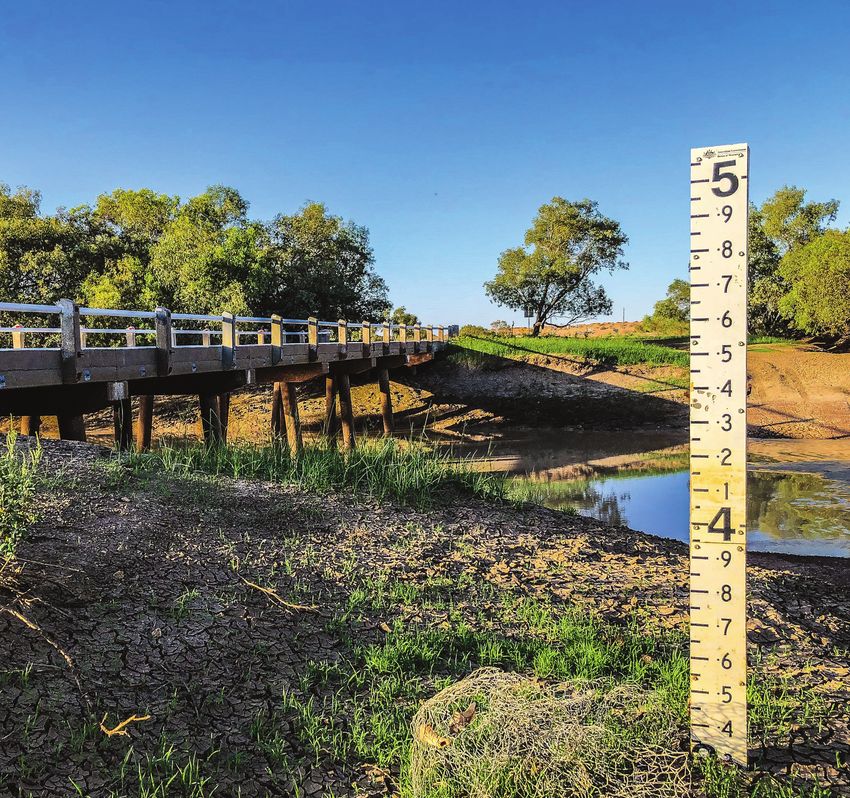
25 | Flood classifications in Queensland – A best practice guide for local governmentsImages: Condamine flood classification board. (Right) Automatic rain and river gauge with camera, Diamantina.
Image: Condamine flood
classification board.
www.qra.qld.gov.au/resilient-queensland
You can also read