Flood maps in Europe - methods, availability and use
←
→
Page content transcription
If your browser does not render page correctly, please read the page content below
Nat. Hazards Earth Syst. Sci., 9, 289–301, 2009
www.nat-hazards-earth-syst-sci.net/9/289/2009/                                                   Natural Hazards
© Author(s) 2009. This work is distributed under                                                       and Earth
the Creative Commons Attribution 3.0 License.                                                   System Sciences

Flood maps in Europe – methods, availability and use
H. de Moel1 , J. van Alphen2 , and J. C. J. H. Aerts1
1 Institute   for Environmental Studies, Vrije Universiteit, Amsterdam, The Netherlands
2 Ministry     of Transport, Public Works and Water Management, Lelystad, The Netherlands
Received: 8 October 2008 – Revised: 8 January 2009 – Accepted: 8 January 2009 – Published: 4 March 2009

Abstract. To support the transition from traditional flood        ready have a good starting point to map their flood hazards.
defence strategies to a flood risk management approach at         A flood risk based map that includes consequences, however,
the basin scale in Europe, the EU has adopted a new Di-           has yet to be developed by most countries.
rective (2007/60/EC) at the end of 2007. One of the major
tasks which member states must carry out in order to com-
ply with this Directive is to map flood hazards and risks in      1   Introduction
their territory, which will form the basis of future flood risk
management plans. This paper gives an overview of existing        River floods are considered one of the most important natural
flood mapping practices in 29 countries in Europe and shows       disasters in Europe (together with storms) and have caused
what maps are already available and how such maps are used.       about 100 billion euros of damage over the period 1986–
Roughly half of the countries considered have maps covering       2006 (CEA, 2007). Furthermore, it has now been widely
as good as their entire territory, and another third have maps    accepted that the frequency and magnitude of river floods
covering significant parts of their territory. Only five coun-    may increase because of climate change (Milly et al., 2002;
tries have very limited or no flood maps available yet. Of the    Kundzewicz et al., 2007; Kleinen and Petschel-Held, 2007).
different flood maps distinguished, it appears that flood ex-     These observations have initiated a flow of hydrological re-
tent maps are the most commonly produced floods maps (in          search that address projected changes in discharges and wa-
23 countries), but flood depth maps are also regularly cre-       ter levels under future climate conditions in European river
ated (in seven countries). Very few countries have developed      systems such as the rivers Rhine, Elbe, and Danube (Mid-
flood risk maps that include information on the consequences      delkoop et al., 2001; Aerts et al., 2006; Dankers et al., 2007;
of flooding. The available flood maps are mostly developed        Lucarini et al., 2008; te Linde et al., 2008). Such studies
by governmental organizations and primarily used for emer-        yield important insights into how flood indicators, such as
gency planning, spatial planning, and awareness raising. In       the probability of extreme discharges, may change. Knowl-
spatial planning, flood zones delimited on flood maps mainly      edge about these indicators is important for adequate design
serve as guidelines and are not binding. Even in the few          and development of flood management strategies that protect
countries (e.g. France, Poland) where there is a legal basis      people against floods such as embankments.
to regulate floodplain developments using flood zones, prac-         During the last few decades, however, increased attention
tical problems are often faced which reduce the mitigating        has been paid to the consequences of floods and measures
effect of such binding legislation. Flood maps, also mainly       that could be developed to reduce the effects of a flood. This
extent maps, are also created by the insurance industry in Eu-    has been triggered by the observation that economic and
rope and used to determine insurability, differentiate premi-     insured losses due to “extreme” floods have drastically in-
ums, or to assess long-term financial solvency. Finally, flood    creased during the last two decades (Munich RE, 2005) even
maps are also produced by international river commissions.        though flood protection investments have also increased. The
With respect to the EU Flood Directive, many countries al-        main explanation for this trend can be found in socioeco-
                                                                  nomic developments and spatial planning policies, as it ap-
                                                                  pears that wealth and exposure have increased in flood-prone
                       Correspondence to: H. de Moel              areas (Munich RE, 2005; EEA et al., 2008). Even in ar-
                       (hans.de.moel@ivm.vu.nl)                   eas where the overall population growth is slowing down

Published by Copernicus Publications on behalf of the European Geosciences Union.
290                                                                                       H. de Moel et al.: Flood maps in Europe

(for example, along the Rhine river), population growth            risk mapping in Europe as required by the new flood Direc-
in cities along rivers tends to be increasing (see e.g. LDS        tive. The main focus is on the mapping of river floods and
NRW, 2008). Flood-prone areas remain attractive for socio-         their associated hazards and risk. The remainder of the pa-
economic activities and it is therefore likely that the damage     per is organized as follows. Section 2 will describe different
potential (as in the amount of assets in flood-prone areas) will   methodologies underlying flood maps and distinguish differ-
continue to increase in the future.                                ent types of flood maps. Section 3 describes what kinds of
   Recent research therefore suggests to follow a risk-based       maps are produced by both European governments and the
approach in flood management (Hooijer et al., 2004; Petrow         insurance industry, and how these maps are currently used1 .
et al., 2006; van Alphen and van Beek, 2006). The aim of           In Sect. 4 conclusions are drawn and the link between current
such strategies is to reduce the overall flood risk, which is      mapping activities and the EU Flood Directive is explored.
defined as the probability of an event multiplied by its con-      Furthermore, suggestions and recommendations are made on
sequences. This can be done through limiting the magnitude         how to proceed with flood risk mapping in Europe.
and probability of the flood (the hazard), the damage poten-
tial (exposure), and/or the way flood events are dealt with
(coping capacity) (see definition by Kron, 2002). Some Eu-         2   Assessing and mapping flood hazard and risk
ropean countries have already recognised the need to adopt
                                                                   In the field of flood risk management there is a sometimes
risk management approaches over the traditional flood pro-
                                                                   confusing use of terms, with especially risk and vulnerability
tection strategies (e.g. Germany (DKKV, 2004), the Nether-
                                                                   having different meanings. Efforts have been made by sev-
lands (Vis et al., 2003; Roos and Van der Geer, 2008), the
                                                                   eral authors to better define risk and related terms (e.g. Kron,
UK (Tunstall et al., 2004)).
                                                                   2002; Samuels and Gouldby, 2005; Merz et al., 2007). All
   The necessity to move towards a risk based approach has
                                                                   these definitions agree that risk is a combination of the phys-
also been recognised by the European Parliament, which
                                                                   ical characteristics of the flood event (the hazard) and its po-
adopted a new Flood Directive (2007/60/EC) on 23 Octo-
                                                                   tential consequences. We distinguish “exposure” and “cop-
ber 2007. The objective of this directive is to establish a
                                                                   ing capacity” as two elements making up the potential con-
framework for the assessment and management of flood risk
                                                                   sequences. With exposure signifying what can be affected
in Europe, emphasising both the frequency and magnitude
                                                                   by a flood (buildings, land use, population), and coping ca-
of a flood as well as its consequences. There are differ-
                                                                   pacity relating to how the adverse effects of a flood can be
ent types of flooding, all resulting in an inundation of areas
                                                                   dealt with (being influenced by: preparedness, precautionary
outside the watercourse. The EU directive addresses floods
                                                                   measures, insurance, health (sick, elderly), financial situa-
from rivers, from the sea, in ephemeral water courses, moun-
                                                                   tion, etc.). This is mostly in line with other definitions (like
tain torrents, and floods from sewage systems. The directive
                                                                   Kron, 2002; Samuels and Gouldby, 2005; Merz et al., 2007)
requires member states to draw up flood risk management
                                                                   but avoids the use of the term “vulnerability”, which is used
plans by 2015. In preparation for this, a preliminary flood
                                                                   very unambiguously (see Samuels and Gouldby, 2005).
risk assessment is due by 2011, and flood hazard and risk
                                                                      Similarly to risk related definitions, some confusion can
maps need to be created by 2013 as they serve as essential
                                                                   arise in the naming of different flood maps. While the clas-
tools in the preparation of management plans. As flood risk
                                                                   sification presented here is broadly consistent with Merz et
is not constant over time, these maps (as well as the plans)
                                                                   al. (2007), we extended the amount of types in order to cover
need to be revised every 6 years.
                                                                   the full range of different flood map types identified in this
   Flood mapping is thus an important aspect for EU mem-
                                                                   study (Sect. 2.2). As a result, mainly the term flood danger
ber states in order to meet the requirements of the new Flood
                                                                   map is used differently here and, as mentioned, we do not
Directive. The mapping of flood hazards is not new, and
                                                                   use the term vulnerability.
numerous governments and private institutions have already
                                                                      Flood maps exist in many different forms, but in general
mapped flood hazards for different purposes (van Alphen et
                                                                   it is possible to distinguish between flood hazard and flood
al., 2008; de Moel and Aerts, 2008). The USA and Canada
                                                                   risk maps. Flood hazard maps contain information about
have initiated several national flood programs in which flood
                                                                   the probability and/or magnitude of an event whereas flood
mapping is an important activity. In 1968 the National
                                                                   risk maps contain additional information about the conse-
Flood Insurance Program (NFIP, see e.g. Burby, 2001) was
                                                                   quences (e.g. economic damage, number of people affected).
launched in the USA and in 1976 the Flood Damage Reduc-
                                                                   Within these two general types, however, there are differ-
tion Program (FDRP, see e.g. Roy et al., 2003, or Watt, 2000)
                                                                   ent methods available to quantify hazards and risks, result-
started in Canada. In Europe, most large-scale flood map-
                                                                   ing in different types of flood maps (Fig. 1). The general
ping activities were initiated during the late 1990s, triggered
by large flooding events (e.g. Høydal et al., 2000).                   1 This paper is based on the information available to the authors
   The main goal of this paper is to provide an overview of        at the time of writing. It should not be considered completely com-
existing flood maps in Europe and their underlying method-         prehensive and does not aim to judge or grade the mapping activities
ologies. This is a first step in assessing the status of flood     of European countries.

Nat. Hazards Earth Syst. Sci., 9, 289–301, 2009                                  www.nat-hazards-earth-syst-sci.net/9/289/2009/
741 and curves are purely illustrative and based on a hypothetical case. In the matrix the yellow
742 colour signifies low danger, the orange colour moderate danger and the red colour high
H. de Moel et al.: Flood maps in Europe 291
743 danger.
744
745 Fig. 1. Conceptual framework for flood hazard and risk calculations. The displayed matrix and curves are purely illustrative and based on a
hypothetical case. In the matrix the yellow colour signifies low danger, the orange colour moderate danger and the red colour high danger.
746
methodology (Sect. 2.1), as well as different types of floods locity, duration, propagation of water front, and the rate at
maps (Sect. 2.2), will be discussed below. The practices of which the water rises. Water depth is one of the main factors
some European countries will be used as examples. Refer- of importance with respect to flood damage. However, in
ences to the information sources concerning these practices steep upstream areas and next to dike-breach locations flow
can be found in Table 1. velocity (and debris content) is a very important factor for
flood damage. In polder areas the duration of inundation can
2.1 Assessing flood hazard be so long that it becomes an important factor for the re-
sulting damage, for instance because of costs associated with
When assessing the flood hazard, a first indication can be ob- emergency housing, business interruption, and the collapse
tained by looking at how often floods occurred historically of supply chains. Furthermore, information on the propaga-
and the magnitude of them. These can be mapped as point tion of the flood wave and the rate at which the water rises is
events (as in Ireland, similar to Fig. 2a), or extents of his- critical for emergency planners in charge of evacuation, and
torical floods can be depicted on a flood extent map (like to estimate the potential loss of life (Jonkman, 2007).
Fig. 2b). With the advent of remote sensing imagery, flood The calculation of the flood hazard can be done using
extents of current (or very recent) floods can easily and ac- methods of varying complexity (Buchele et al., 2006), de-
curately be determined. This opens up possibilities to cali- pending on the amount of data, resources, and time available.
brate or validate flood extents simulated by computer mod- While there are different approaches the conceptual frame-
els. To create and implement policy with respect to flood work behind the calculation of flood hazards is quite general
management it is important to have up to date flood infor- (Fig. 1) and consists broadly of three steps:
mation which is consistent over the entire territory. The use 1. The first step is to estimate discharges for specific re-
of historical flood maps is in this respect restricted since it is turn periods. This can be done by using frequency anal-
impossible to compare them as return periods are not equal yses on discharge records and fitting extreme value dis-
and boundary conditions (streambed, land cover, etc.) may tributions (e.g. te Linde et al., 2008). When there is
have changed significantly over time. no discharge data available but there are precipitation
To overcome this problem, statistical and modelling tools records, runoff coefficients can be used (as done in Aus-
are used to calculate the hazard of hypothetical floods. There tria, see Merz et al., 2008) to deduce discharge infor-
are various parameters that can be used to denote the flood 28 mation. Whether direct discharge measurements or dis-
hazard. These include the flood extent, water depth, flow ve- charge information derived from precipitation records
www.nat-hazards-earth-syst-sci.net/9/289/2009/ Nat. Hazards Earth Syst. Sci., 9, 289–301, 2009292 H. de Moel et al.: Flood maps in Europe
are used, only a fraction of the basin is usually gauged, resolution is still usually too low for distinguishing levees or
whilst for national flood mapping projects information flood walls correctly, especially when working at a national
is required for all river stretches. To overcome this, scale. When a high resolution DEM is used, the presence of
flood information (e.g. discharge, precipitation, or flood viaducts or other line structures above ground can wrongly be
moments) can be extrapolated to ungauged parts using interpreted as flood barriers, whilst in reality they do not stop
regionalisation techniques (see e.g. Merz and Bloschl, the water at all. Sometimes flood defences are added as sep-
2005). More often however, hydrological models are arate line elements, but in such instances the assumption is
used to calculate discharges. Such models come in var- usually made that the defences will not fail. This assumption
ious complexities (e.g. Hurkmans et al., 2008), but they becomes increasingly uncertain with higher design standards
all require spatially explicit meteorological (e.g. tem- for flood works. Therefore the proper schematisation of these
perature, precipitation, evaporation, radiation), soil, and elements requires thorough field surveys and the expertise of
land cover data as input. This data can be acquired from local flood and water managers.
datasets of interpolated observed data, from re-analysis
datasets (e.g. the ECMWF ERA datasets), or from cli- 2.2 Flood map types
mate models (e.g. the Hadley and ECHAM models).
Spatial hydrological models solve the water balance for 2.2.1 Flood extent maps
each geographical unit (e.g. grid-cell) for each time step
The most common flood hazard maps are flood extent maps
and route the runoff downstream, yielding discharges
(Fig. 2b). These are maps displaying the inundated areas of
throughout the entire catchment. Such models can ad-
a specific event. This can be a historical event, but also a hy-
ditionally be used in scenario analysis, for example in
pothetical event with a specific return period (e.g. once every
the assessment of the impact of changes in climate or
100 years, often expressed as HQ100 ). The extent of a single
land cover by changing the input meteorological data or
flood event, or of multiple events, can be depicted and also
land cover scheme.
the extent of historical floods can be shown. As flood extents
2. When discharges and their return periods have been de- are easy to depict they can be supplemented with point in-
rived using the above mentioned approaches, a subse- formation on other flood parameters (e.g. depth or velocity
quent step towards developing a flood map is to trans- at some points) and important exposed assets (e.g. hospitals,
late discharges into water levels. This is usually done power stations).
with rating (stage-discharge) curves. Alternatively, 1-
D or 2-D hydrodynamic models can be used to deter- 2.2.2 Flood depth maps
mine water levels. The latter is especially useful in hy-
draulically complex areas like river confluences, pold- When flood extents are calculated for specific return periods,
ers, or drainage systems that have been heavily modified flood depths can also easily be calculated. Depicting these
through human interference. Furthermore, hydrody- water depths on a separate map results in a flood depth map
namic models allow for considering additional flood pa- (Fig. 2c). A different type of water depth map is created
rameters, like flow velocity, propagation, duration, and in areas where flooding is not the result of overtopping but
the rate at which the water rises. Some additional infor- rather of failing structures (e.g. polder areas). In such cases
mation is however required for 2-D hydrodynamic mod- it is not possible to calculate general flood extents and depth
elling, like flood wave characteristics (duration, peak). for a specific return period as the flooded area is determined
by the location of a breach, which is not known beforehand,
3. In the third step the flooded area (and possibly flood and scenarios are often used. In order to generate a general
depth) is determined by combining water levels with picture of the flood hazard, the results of these scenarios can
a digital elevation model (DEM), thus creating a flood be combined into a single map showing the maximum (or
map showing flood extent or depth. A DEM is already average) flood depth per pixel (as is done in the Netherlands
included in 2-D hydrodynamic models, in which case for example).
this third step is already addressed.
2.2.3 Maps displaying other flood parameters
As with all methods that use a wide range of data, calcula-
tions, and/or models, uncertainties in the data and processing Flood extents and depths are usually considered the most im-
steps accumulate in the final output. Major sources of uncer- portant flood parameters, especially when it comes to map-
tainty with respect to flood hazard mapping include the sta- ping flood hazards. However, some other parameters, such
tistical determination of extreme events from relatively short as velocity, duration, propagation, and the rate of rising of
time series, the spatial extrapolation of data (when used), the the water, can also be very important depending on the situ-
DEM, and the presence and/or failure of defence structures. ation and the purpose of the map. In Flanders, for instance,
With respect to the DEM, there has been a huge improvement there are maps showing the rate at which the water rises, in
in spatial resolution over the last few decades. However, the Austria and Luxembourg the flow velocity is mapped, and
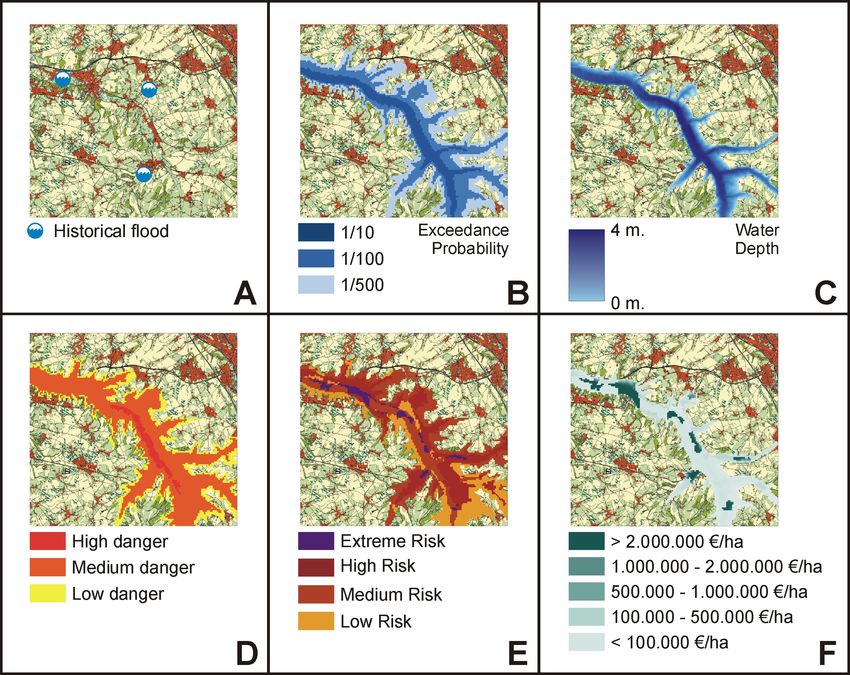
Nat. Hazards Earth Syst. Sci., 9, 289–301, 2009 www.nat-hazards-earth-syst-sci.net/9/289/2009/747 Figure 2. Different flood map types. A, historical flood map; B, flood extent map; C, flood
748 depth map; D, flood danger map; E, qualitative risk map; F, quantitative risk (damage) map.
H. de Moel et al.: Flood maps in Europe 293
749 The displayed maps are purely illustrative and based on a hypothetical case.
750
Fig. 2.751
Different flood map types. (A) historical flood map; (B) flood extent map; (C) flood depth map; (D) flood danger map; (E) qualitative
risk map; (F) quantitative risk (damage) map. The displayed maps are purely illustrative and based on a hypothetical case.
in Hungary and the Netherlands propagation maps of flood- be found in the UK, where the hazard rating is defined as:
ing polders will be created for the entire territory in the near depth×(velocity+0.5)+debris factor (van Alphen and Pass-
future. Maps showing such parameters always relate to a sin- chier, 2007).
gle return period, as it is practically impossible to depict, for
instance, velocities of several return periods on a single map.
2.2.5 Exposure and coping capacity
2.2.4 Flood danger maps
Flood maps usually only show one out of several flood pa- In flood risk management not only is information on the flood
rameters, though in some cases flood depth information of hazard desirable, but also information on the consequences
a specific return period is added to a flood extent map (e.g. of a flood. The consequences of a flood depend broadly on
Austria, Saxony). In order to get an impression of the over- the damage potential and the coping capacity of a region to
all flood hazard, parameters can instead be aggregated into 29 handle a flood. As there are countless consequences there are
qualitative classes, resulting in a so-called flood danger map also many different indicators. Indicators for coping capac-
(Fig. 2d). This is commonly done using matrices or formu- ity (health, financial situation) are often especially difficult
las to relate different flood parameters into a single mea- to quantify and are therefore usually disregarded in risk as-
sure for the “danger”. In such matrices (see Fig. 1), two sessments (though in the UK a coping capacity map has been
axes are used to relate flood parameters (e.g. depth, veloc- created). The potential damage of a flood on houses, indus-
ity, return period), or sometimes a grouped parameter is used try, infrastructure, agriculture, etc. (exposure) is easier to as-
(e.g. “intensity” as used in Rheinland-Pfalz is a combina- sess. However, particular types of damage, such as cultural
tion of water depth and flow velocity (van Alphen and Pass- damage, ecological damage, and indirect damage (e.g. due to
chier, 2007)), into qualitative danger categories (e.g. Switzer- business disruption), are still very difficult to quantify. When
land, Wallonia, Rheinland-Pfalz). An example of the use of such indicators are considered this is usually done in a qual-
a formula to calculate a measure for the flood danger can itative way, resulting in indices or ratios (e.g. Italy, Spain).
www.nat-hazards-earth-syst-sci.net/9/289/2009/ Nat. Hazards Earth Syst. Sci., 9, 289–301, 2009294 H. de Moel et al.: Flood maps in Europe
2.2.6 Flood risk maps 3 Availability and application of flood maps
When information on the consequences of a flood is com- Flood maps are created by various institutions for various
bined with the hazard information, risk maps can be created. purposes. At the European scale, some flood maps have been
As most indicators for exposure and coping capacity are produced providing a rather general indication of flood haz-
qualitative, this results in qualitative risk maps (Fig. 2e). The ards and risks (Lavalle et al., 2005; Schmidt-Thomé et al.,
main quantifiable indicator for exposure is direct economic 2006). The most important producers of nation/basin wide
damage. A common method to calculate direct damage is maps are governmental institutions, the insurance industry,
by using stage-damage functions (see Fig. 1), which repre- and transboundary river basin authorities (e.g. Rhine, Elbe,
sent the relationship between inundation depth (and/or some Danube basin authorities). Their mapping efforts in Europe
other flood parameter) and the resulting damage of an object will be described in the following sections.
or land-use type. This yields the potential damage of an event
(Fig. 2e) or even the expected damage per area per year (e.g. 3.1 Governments
Flanders). Stage-damage functions are either based on em-
pirical data from past flood events (e.g. HOWAS database in Various surveys and reports provide information about the
Germany) or are synthetically created by experts. The use of availability and use of flood maps in European Countries. A
stage-damage functions, however, still involves considerable survey from the European Union2 and a survey leading up to
uncertainty (Merz et al., 2004), and absolute damage figures the 2005 World Conference on Disaster Reduction in Kobe3
should be interpreted with caution. Furthermore, the direct on hazard mapping and management both contain valuable
financial damage estimated in this way is only part of the to- information from different countries with respect to flood
tal damage (see e.g. Jonkman et al., 2003). Indirect financial mapping practices and application. In addition, the Joint Re-
damage is usually not included (or only very roughly esti- search Centre of the EU has carried out a survey on flood haz-
mated) in flood damage estimations and non-monetary dam- ard maps across 10 new member states and candidate coun-
age is usually excluded altogether. tries in 2003/2004, the replies of which are summarised in
As a result of the wide range of flood indicators available Jelinek et al. (2007). Furthermore, the ARMONIA project
(for both hazard and consequence), many different types of has produced a report on spatial planning and natural risk
flood maps exist. These are often not comparable (especially management in eight European countries, including informa-
in the case of qualitative ones) since they are based on differ- tion on hazard and risk mapping and the use of such maps
ent approaches. In particular, flood risk maps should not be (ARMONIA, 2005). In addition, the European exchange cir-
considered as homogeneous as flood hazard maps (like flood cle on flood mapping (EXCIMAP) has compiled a handbook
extent or depth) because of the many indicators that are avail- and atlas on flood mapping in Europe, containing examples
able for the consequence of a flood compared to the relative from 19 European countries (EXCIMAP, 2007). The infor-
few indicators for the flood hazard. In many cases the indica- mation from these and other sources is combined in Table 1,
tors used and the type of flood risk map created depends on summarising the availability, types and use of flood maps in
the question that needs to be addressed. For example, insur- European countries.
ers use insured damage, for evacuation planning population
3.1.1 Availability of flood maps
density is important, etc.
Almost all European countries have some flood maps avail-
2.3 European Flood Directive requirements able. Only Cyprus and Bulgaria do not seem to have any
maps available, though Bulgaria does have maps related to
In order to comply with the European Flood Directive dam failures. A couple of countries (Croatia, Denmark and
[2007/60/EC] member states are currently obliged to create Latvia) have maps for only very small parts of their territory.
both flood hazard and flood risk maps. Flood hazard maps Out of the 29 countries considered, 14 have already mapped
should cover areas that may be affected by floods with a low almost their entire territory with respect to flood hazards. In
probability (extreme event), floods with a medium probabil- 10 countries a significant part, but not the entire territory,
ity (return period ≥100 years) and, where appropriate, floods has already been mapped. This is usually because the map-
with a high probability (∼HQ10 ). Principally, the directive ping is still in progress or has purposefully been restricted to
requires member states to create flood extent maps for the the most important areas (e.g. Norway, Sweden). In many
above return periods. Member states are encouraged to de- cases the responsibility of mapping has been passed down
pict flood depth and flow velocity information as well when to regional governments (provinces, Bundesländer, regional
appropriate. The flood risk maps required by the directive are water authorities), like in Spain, Italy, Germany, Poland, and
qualitative risk maps which should show the number of po-
tentially affected inhabitants, the types of economic activity, 2 http://ec.europa.eu/environment/civil/prote/hazard mapping/
protected areas affected, and information on possible pollu- 3 http://www.unisdr.org/wcdr/preparatory-process/
tion sources. national-reports.htm
Nat. Hazards Earth Syst. Sci., 9, 289–301, 2009 www.nat-hazards-earth-syst-sci.net/9/289/2009/H. de Moel et al.: Flood maps in Europe 295
Table 1. Overview of the availability and use of flood maps in European countries. As Cyprus and Bulgaria do not have national flood maps
they have been omitted from the table. Belgium (BE) has been split in Flanders and Wallonia.
Country Various Flood map type*** Characteristics Use by government
# of return periods calculated******
# of classes flood risk map*****
Exposure/Coping capacity data
Flood assessment/management
# of classes flood danger map
# of classes flood extent map
Other flood parameters****
Spatial Planning (advisory)
Quantitative risk (damage)
Spatial Planning (binding)
Emergency Planning
Accessible on-line
Qualitative risk
Produced by**
Flood danger
Construction
Flood extent
Flood depth
Coverage*
Awareness
Historical
Insurance
Flanders (BE)a,e 1 R Y X X X R X C 17 X X
Francea,f 1 R Y X X X X 1 3 1 X X X
Switzerlanda,g 1 R y X X X X 1 4 V 4 X X X
Netherlandsa 1 C Y X .V . . . X X X
Great Britaina,h 1 C Y X X X 2 4–7 4 X X X
Romaniab,c,d 1 C X X S X X X
Slovakiac,d 1 C X X S X X
Wallonia (BE)a 1 R Y – – X 3 3
Hungarya,b 1 X . .P 2 2 X X X
Irelanda,c 1 C Y X X . . 3 X X X
Lithuaniaa 1 R X X X X
Czech Rep.a 1 R Y X X 3 3 X X
Sloveniac,d 1 C X 4 X
Estoniaa 1 C X
Greeced 1 C X
Germanya,i 2 R y X X X X 1–4 4 ∼7 V X X X
Spaina,j 2 R X X X X 3 5 3 X X
Italya,k,l 2 R y X X X 3 4 3 X
Finlandm 2 R y X X – 5 X X X X X
Austriaa,n 2 C X – V X 3 5 3 X
Luxembourga,o 2 P Y X X V X 4 4 4 X X
Polanda,p 2 R X X 2–8 V X X
Norwaya,q 2 C X 1 6 X X
Portugalc,d 2 L X X X X X
Swedena,c 2 C Y X – 2 2 X X X
Croatiaa 3 X X X 1 6
Denmarka 3 C X 1 2
Latviaa 3 C X 1 V X X
∗ 1: (almost) entire territory; 2: some regions/ongoing; 3: limited areas/on request. ** C: central government; R: regional government; L:
local government; P: project. *** – : information used in background of hazard map; . : will be developed. **** R: rate of rise; V: velocity;
P: propagation. ***** C: continuous scale; V: varies depending on region. ****** S: several, exact amount not known but more then one;
V: varies, depending on region/request.
a Van Alphen and Passchier (2007); b Jelinek et al. (2007); c EU survey (2004); d National Report Kobe Conference (2005); e
D’Haeseleer et al. (2006); f Fleischhauer (2005); g Zimmerman et al. (2005); h Fay and Walker (2005); i Greiving (2005); j Cantos (2005); k
Galderisi and Stanganelli (2005); l Menoni (2005); m Dubrovin et al. (2006); n www.wassernet.at; o www.gismosel.lu; p Wanczura (2005);
q Høydal et al. (2000)
www.nat-hazards-earth-syst-sci.net/9/289/2009/ Nat. Hazards Earth Syst. Sci., 9, 289–301, 2009296 H. de Moel et al.: Flood maps in Europe Switzerland, which can result in a wide variety in format and ish and Italian regions use population, urban settlement, and progress. For instance, in Germany and Poland different re- infrastructure as indicators for exposure, and the Spanish turn periods are shown on the flood maps (Wanczura, 2005; and Italian regions also include some environmental indica- Petrow et al., 2006), and in Spain and Italy there are many tors (Fleischhauer, 2005; Cantos, 2005; Galderisi and Stan- regions that are still uncharted (Cantos, 2005; Galderisi and ganelli, 2005). Flanders and Sachsen (Germany) are the only Stanganelli, 2005; van Alphen and Passchier, 2007). In some regions where quantitative risk maps have been developed. countries national standards and guidelines have been estab- Sachsen carried this out for the HQextr event, yielding dam- lished in order to avoid too much divergence in map formats ages in C/area (van Alphen and Passchier, 2007) where in (e.g. Switzerland and Finland). Flanders damages were calculated for different probabilities Some countries have developed maps showing historical and combined into damages in C/area/year (HIC, 2003). flood information. For example, Ireland has a nation-wide map showing the occurrence of historical floods and Flan- 3.1.2 Use of flood maps by governments ders has a map with “recently flooded areas” (1988–2006) (D’Haeseleer et al., 2006). Flood extents of specific histor- Flood maps are used for a variety of purposes by govern- ical events are available in the Czech Republic (1997 and ments, mostly for emergency planning (e.g. evacuation) and 2002 Elbe floods) and can be found for Finland and some spatial planning. In spatial planning a distinction can be French regions (van Alphen and Passchier, 2007). made between countries where flood maps serve an advisory The most common flood hazard maps are flood extent purpose, and countries where there is a binding legislation maps. Most flood extent maps depict flood extents for around to use flood hazard or risk information. Flood zones (either three return periods. Different return periods are usually de- extent or danger zones) can serve as an informative tool for picted using different colors/hues (e.g. Italy, Sweden, UK), decision makers (as in Norway and Sweden). In Finland and by delineating the farthest extents as lines (e.g. Austria, the UK, on the other hand, there is a legal obligation to con- Poland) or by a combination of both (e.g. Catalonia (Spain)). sider flood zones in the planning process, but it cannot fully Very rarely, only one return period is calculated for the flood prohibit developments. In France, Poland, and recently Ger- hazard (e.g. France), but sometimes only one return period is many, there is a binding legislation with respect to restricting depicted per map while more are calculated (e.g. Norway). or prohibiting developments in flood-prone areas. However, The most frequently used return period is HQ100 and the binding legislation does not seem to guarantee effective flood rarest event that is taken into consideration is HQ1000 (Flan- risk management in practice. In Germany, effective flood risk ders, UK, Hungary, Poland). In some countries an “extreme” management is hampered by the decentralised structure of flood is distinguished, which is not further specified. In Swe- the Bundesländer as many different entities (which can dif- den the “extreme” flood is estimated to be close to HQ10 000 , fer between Länder) have to cooperate and agree (Samuels which is equal to the highest European safety standard as im- et al., 2006). In France local authorities are tempted to un- plemented in the Netherlands. derestimate hazard zones because the state will compensate Flood extent information can be supplemented by other the damage that can’t be covered by the insurance (Fleis- information like flood depth, velocity (e.g. Austria and Sach- chhauer, 2005). Furthermore, in Poland municipalities often sen, Germany) or information on the consequences of a do not follow regulations for financial reasons, even though flood. In Italy, flood extent and risk zones are depicted on law requires them to prohibit developments in the most flood- the same map. Many maps use a topographic map or land- prone zones (Wanczura, 2005). In Spain and Switzerland, use information for the background of maps, thereby giving regional governments can decide for themselves how strictly an indication of exposure on the same map. Few maps specif- flood zones are incorporated into their spatial planning poli- ically show vital objects like hospitals and public utility ser- cies (Zimmerman et al., 2005; Cantos, 2005). In Switzer- vices, as done in Sachsen (Germany). land, recommendations are made by the central government Other flood parameters, like flood depth, velocity, or prop- regarding flood zones, which are usually followed. agation, are also depicted on separate maps. In particu- Besides the planning purposes, flood maps are also used to lar, flood depth is reported by many countries (e.g. Finland, raise awareness about floods. In 12 of the countries consid- Netherlands, Switzerland). Furthermore, combinations of ered flood maps are available online for the general public, several flood parameters (e.g. probability, depth, velocity) are sometimes combined with an option to search by address. In used to develop flood danger maps, by using either a formula many cases this is part of a national campaign to prepare resi- (e.g. UK) or a matrix (e.g. Wallonia, Switzerland: see Fig. 1). dents for floods (e.g. Ireland, UK). The use of historical flood Some countries have explicit exposure/coping capacity information is particularly valuable in this respect as histor- maps (e.g. UK, Italy, Romania), but only a few have com- ical floods are not hypothetical events (like modelled ones), bined hazard and exposure/coping capacity information into and can therefore be more easily understood by the general risk maps. France, Switzerland, and some regions in Spain public. In Belgium, flood maps form the basis of an obliga- and Italy have created qualitative risk maps, usually clas- tory flood insurance scheme, in which higher premiums have sified into three to five risk zones. France and the Span- to be paid in certain zones or coverage is allowed to be denied Nat. Hazards Earth Syst. Sci., 9, 289–301, 2009 www.nat-hazards-earth-syst-sci.net/9/289/2009/
H. de Moel et al.: Flood maps in Europe                                                                                                                                                         297

Table 2. Overview of flood maps produced by the insurance sector.

                               Name              Coverage                    Various                                         Use

                                                                                                                             Premium determination

                                                                                                                                                     Commercial Service

                                                                                                                                                                          Prob. – Loss curves
                                                                      Produced by*

                                                                                                              Insurability
                                                                                                  Awareness
                                                                                     # of zones
                               HORAa             Austria             PPP              3              X                              X
                               ZURSb             Germany              N               4                           X
                               FRATc,e           Czech Republic      R&P             4–6                                            X
                               SIGRAd            Italy                N               3                                             X
                               CatNete           Belgium, Italy       R               1                                                                    X
                               CatNete           Czech Republic       R               4                                                                    X
                               CatNete           Germany              R               3                                                                    X
                               CatNete           Hungary              R               3                                                                    X
                               CatNete           Netherlands          R               4                                                                    X
                               CatNete           Slovakia             R               5                                                                    X
                               CatNete           UK                   R               1                                                                    X
                               RMSf              UK, Bel, Ger         R               –                                                                                         X
                               EUROFLOODg        Ger, Fra, UK, Ita    R               –                                                                                         X

*N: national insurance association; R: re-insurance company; R-P: re-insurance company and private company; PPP: public private partner-
ship. a http://gis.lebensministerium.at/eHORA; b Thieken et al. (2006); c http://www.intermap.com; d http://www.ania.it/sigra/index.asp; e
Van Alphen and Passchier (2007); f RMS (2001, 2004); g EQECAT (2006).

(D’Haeseleer et al., 2006). Lastly, flood maps are also used                areas, or under which condition, buildings can be insured.
frequently for water management purposes, in flood assess-                  In Italy, maps are also produced by the national insurance
ments, and to facilitate the insurance industry (see Sect. 3.2).            agency (ANIA), but there they are used to determine premi-
                                                                            ums by relating flood depth and velocity to damage potential
3.2   Insurance industry                                                    (SIGRA project). In the Czech Republic, flood maps are also
                                                                            created to determine flood premiums. The FRAT system, cre-
In Britain the insurance industry is provided flood maps                    ated by a re-insurer and a GIS company, produces six hazard
by the central government (Environment Agency) but many                     zones or four zones related to the tariff zones used by the na-
flood maps are also produced by the insurance industry itself               tional insurance association (CAP), and is used widely by the
(see e.g. CEA, 2005). Both national insurance associations,                 property insurance sector in the Czech Republic (van Alphen
as well as re-insurance companies, have mapped flood haz-                   and Passchier, 2007).
ards and risks in order to support their financial services (Ta-
ble 2). Most maps created by the (re-)insurance are flood ex-                  CatNet is an interactive mapping tool created by a large
tent maps, depicting between one and six flood hazard zones.                re-insurance company and contains information about flood
   The HORA project in Austria is a cooperation between                     zones in many different European countries (but also out-
the Austrian national insurance association and the Austrian                side Europe). The information in the system has different
government to jointly create national flood hazard maps.                    sources and the set as a whole is therefore quite heteroge-
The Austrian government uses these maps to increase public                  neous. The tool is used as a commercial service to anyone
awareness and they can be viewed in a WebGIS4 (whereas                      who is interested. Maps for Belgium, Italy, the Czech Re-
most other insurance related products are usually not pub-                  public, and Slovakia, showing flood extents without taking
licly accessible), and the insurance companies use the maps                 into account flood protection measures, are created by the re-
to differentiate premiums between the different flood zones.                insurance company itself. For Hungary the HQ50 map was
In Germany, maps are produced by the German Insurance                       also produced by the re-insurance broker itself, but the other
Association (ZÜRS project) in order to determine in which                  two zones (HQ100 and HQ1000 ) were digitised from the of-
                                                                            ficial national maps made by the government. The maps for
   4 http://gis.lebensministerium.at/ehora                                  Germany were provided by German water institutes. For the

www.nat-hazards-earth-syst-sci.net/9/289/2009/                                                       Nat. Hazards Earth Syst. Sci., 9, 289–301, 2009
298 H. de Moel et al.: Flood maps in Europe
Netherlands the safety standards are used as flood zones and maps showing five zones of potential damage and inhabitants
for the UK only areas potentially affected by coastal floods affected (ICBR, 2001). Following the success of the Rhine-
are depicted (van Alphen and Passchier, 2007). Atlas similar atlases have been made for the Elbe and Oder
The RMS and EUROFLOOD models, both created by re- rivers within the framework of EU-INTERREG projects.
insurance companies, do not produce maps themselves, but
calculate the insured damage corresponding to certain events
using a stochastic precipitation dataset and a chain of hydro- 4 Conclusions and recommendations
logical and damage assessment models. As a result of this
setup, these models not only take into account fluvial floods There are many flood mapping activities in European coun-
(like most other mapping efforts), but also floods caused by tries and even though an effort has been made in this paper
heavy rainfall exceeding the drainage capacity in flat areas. to compile as much information as possible it should not be
By calculating damages for several return periods, so-called considered wholly comprehensive. Most of the projects iden-
probability-loss (P-L) curves can be created. Such curves are tified were initiated during the last one or two decades. In
used by these re-insurance brokers to establish which proba- roughly half of the countries considered in this study these
bility corresponds to a certain loss so that reinsurance costs practices cover almost the entire territory, in a third of the
can adequately be assessed and financial solvency of the pri- countries considerable parts are covered, and in roughly a
mary insurers can be guaranteed. sixth of the countries there are very limited or no flood maps
Flood hazard and risk data produced by the insurance sec- available. Even though there is a common conceptual frame-
tor is usually kept confidential. The available data on ex- work to create flood hazard and risk maps, there exists a wide
posure and flood risk could, however, also be very valuable variety of methods. Especially the mapping of flood risks is
to emergency planners and water managers. These authori- broadly defined, as there are many different indicators for
ties in turn administer the hydrological data which is poten- risk resulting from its broad definition (hazard times conse-
tially of use to the insurers, providing a potential for mutually quence).
beneficial cooperation. Cooperation between the insurance Flood extent maps are the most commonly used flood
industry and governments is also desirable when it comes maps, produced in about 80% of the countries considered.
to creating the flood maps themselves, as communication of In eight of the countries considered, parameters other than
flood hazards and risks is done by the government whilst in- flood extent are also taken into account, most commonly
surance premiums are determined and collected by the insur- flood depth (in all eight), sometimes velocity (in Switzer-
ers using their own information. As both actions concern the land and Luxembourg), and very rarely propagation (to be
general public they should ideally be based on the same data. developed in Hungary and Netherlands); even though this is
There are some examples where governments and the in- important information for emergency planners. While some
surance industry cooperate. In Austria the central govern- exposure (or coping capacity) data is often implicitly used
ment and the insurance sector explicitly worked together to (by using topographic maps as background) it is not often
create flood maps that are used for both awareness raising explicitly mapped (as is the case in Romania and the UK for
and premium determination. Furthermore, in both France example). Only very rarely is it combined with hazard infor-
and the UK the government disseminates its flood hazard mation to create flood risk maps (e.g. Spain, Italy, Flanders).
information explicitly to the insurance companies, often ad- In most countries such maps are used for emergency plan-
justed to serve their specific needs. In France this is part ning, raising (public) awareness, and spatial planning. The
of a flood insurance system whereby compulsory fees on all full potential of regulating land use in flood-prone areas is
car and house insurances are collected to cover flood losses. often not reached because in many countries flood zones only
This fund is administered by the insurance companies for serve as guidelines or there are practical problems related to
which the state acts as a reinsurer in case of a large disas- the implementation of binding rules. In 12 European coun-
ter (Fleischhauer, 2005). tries flood maps can be viewed online by the general public.
In the insurance sector flood extent maps are also fre-
3.3 Trans-boundary maps quently used. Insurance associations and reinsurance com-
panies have created nationwide flood maps for different Eu-
Besides governments and the insurance sector there are some ropean countries. They use such maps mainly to determine
other producers of flood maps. The most noteworthy of insurability, to differentiate premiums, or as a commercial
these are transnational river basin authorities like the ICPR product. In some cases the wealth of information on insured
(Rhine), IKSE (Elbe), IKSO (Odra) and ICPDR (Danube). assets is combined with sophisticated flood hazard data to
The ICPR was the first to create an atlas showing transbound- calculate potential losses of flood events, enabling re-insurers
ary flood hazard information. The “Rhine-Atlas” features to assess long-term financial solvability.
flood hazard maps showing the flood extent for HQ10 , HQ100 As most European countries already have some sort of
and an extreme flood as well as four danger categories based flood map available and/or projects running, they already
on flood depth of the extreme flood. It also features flood risk partly comply with the EU Flood Directive (2007/60/EC).
Nat. Hazards Earth Syst. Sci., 9, 289–301, 2009 www.nat-hazards-earth-syst-sci.net/9/289/2009/H. de Moel et al.: Flood maps in Europe 299
However, most countries have yet to make the step from 2006,
hazard to risk map. As risk has a broad definition, and http://www.nat-hazards-earth-syst-sci.net/6/485/2006/.
methodologies to quantify it differ between countries, this Burby, R. J.: Flood insurance and floodplain management: the US
could result in a wide variety of risk maps which will be experience, Global Environmental Change Part B: Environmen-
difficult to compare. This could cause complications when tal Hazards, 3, 111–122, 2001.
Cantos, J. O.: Country Report – Spain, in: Report on the Euro-
it comes to setting up management plans as these are sup-
pean Scenario of Technological and Scientific Standards reached
posed to work at a basin scale, whereas the mapping is usu- in Spatial Planning versus Natural Risk Management, edited by:
ally done by the individual countries. Early cross-boundary Greiving, S., Fleischhauer, M., and Wanczura, S., ARMONIA
cooperation is therefore desirable in order to avoid compa- Project, Dortmund, 2005.
rability problems. A huge challenge remains for quantifying CEA: The insurance of natural events on European markets, Comité
potential flood damages and incorporating indirect and non- Européen des Assurances, Paris, AB 5050 (06/05), 2005.
monetary damage (to nature, culture, etc.) in an appropriate CEA: Reducing the social and economic impact of climate change
and uniform way. and natural catastrophes – insurance solutions and public-private
This review of flood mapping practices across 29 Euro- partnerships, CEA, Brussels, Belgium, 2007.
pean countries also reveals some more general points when D’Haeseleer, E., Vanneuville, W., Van Eerdenbruch, K., and
Mostaert, F.: Gebruik van overstromingskaarten voor ver-
it comes to flood (risk) mapping. In many of the cases ob-
schilende watergerelateerde beheers- en beleidsinstrumenten
served, the protective effect of flood defences is not incorpo-
Water, September–Oktober 2006.
rated in the mapping method or, when it is, the defences are Dankers, R., Christensen, O. B., Feyen, L., Kalas, M., and De Roo,
considered not to fail. As flood defences are critical elements A.: Evaluation of very high-resolution climate model data for
when it comes to flood hazards, it is important to properly simulating flood hazards in the Upper Danube Basin, J. Hydrol.,
deal with their effect and take into account the uncertainties 347, 319–331, 2007.
surrounding their failure. Furthermore, none of the mapping de Moel, H. and Aerts, J. C. J. H.: Flood maps in Europe: a com-
projects have taken into account the effect of climate change parative evaluation of methods, availability and application, in:
on future flood hazards. Incorporating the effect of climate Proceedings of the 4th International Symposium on Flood De-
change as well as the surrounding uncertainties in flood risk fence, Toronto, Canada, 6-5-2008, 28/1-11, 2008.
management could be an important driver for spatial planners DKKV: Flood Risk Reduction in Germany – lessons learned from
the 2002 disaster in the Elbe region, Deutsches Komitee für
and investors for designing more sustainable housing and in-
Katastrophenvorsorge e.V. (DKKV), Bonn, 29e, 2004.
frastructure in flood-prone areas.
Dubrovin, T., Keskisarja, V., Sane, M., and Silander, J.: Flood Man-
agement in Finland – introduction of a new information system,
Acknowledgements. The authors would like to thank the Dutch Nice, France, 2006.
National research programme “Climate Changes Spatial Planning” EEA, WHO, and JRC: Impacts of Europe’s changing climate – 2008
for sponsoring this work and the EXCIMAP members for providing indicator-based assessment, European Environment Agency,
example maps and background information. Aline te Linde and Copenhagen, Denmark, EEA No 4/2008, available at: http:
Philip Ward are thanked for providing valuable comments on //reports.eea.europa.eu/eea report 2008 4/en, 2008.
earlier versions of this manuscript. One anonymous reviewer, EQECAT: EuroFlood Brochure, available at: http://www.eqecat.
Pedro Restrepo and Attilio Castellarin are thanked for their com/resources/brochures/EuroFlood May 15 2006.pdf, 2006.
constructive reviews. EXCIMAP: Handbook on good practices for flood mapping in
Europe, European exchange circle on flood mapping, available
Edited by: U. Ulbrich at: http://ec.europa.eu/environment/water/flood risk/flood atlas/
Reviewed by: A. Castellarin, P. Restrepo, and another index.htm, 2007.
anonymous referee Fay, H. and Walker, G.: Country Report – UK, in: Report on
the European Scenario of Technological and Scientific Standards
reached in Spatial Planning versus Natural Risk Management,
References edited by: Greiving, S., Fleischhauer, M., and Wanczura, S., AR-
MONIA Project, Dortmund, 2005.
Aerts, J. C. J. H., Renssen, H., Ward, P. J., de Moel, H., Odada, E., Fleischhauer, M.: Country Report – France, in: Report on the Euro-
Bouwer, L. M., and Goosse, H.: Sensitivity of global river dis- pean Scenario of Technological and Scientific Standards reached
charges under Holocene and future climate conditions, Geophys. in Spatial Planning versus Natural Risk Management, edited by:
Res. Lett., 33, L19401, doi:10.1029/2006GL027493, 2006. Greiving, S., Fleischhauer, M., and Wanczura, S., ARMONIA
ARMONIA: Report on the European scenario of technological and Project, Dortmund, 2005.
scientific standards reached in spatial planning versus natural risk Galderisi, A. and Stanganelli, M.: Country Report – Italy, regional
management, ARMONIA Project, Deliverable 1.1, available at: level, in: Report on the European Scenario of Technological and
www.eu-medin.org, 2005. Scientific Standards reached in Spatial Planning versus Natural
Büchele, B., Kreibich, H., Kron, A., Thieken, A., Ihringer, J., Risk Management, edited by: Greiving, S., Fleischhauer, M., and
Oberle, P., Merz, B., and Nestmann, F.: Flood-risk mapping: Wanczura, S., ARMONIA Project, Dortmund, 2005.
contributions towards an enhanced assessment of extreme events Greiving, S.: Country Report – Germany, in: Report on the Euro-
and associated risks, Nat. Hazards Earth Syst. Sci., 6, 485–503,
www.nat-hazards-earth-syst-sci.net/9/289/2009/ Nat. Hazards Earth Syst. Sci., 9, 289–301, 2009300 H. de Moel et al.: Flood maps in Europe pean Scenario of Technological and Scientific Standards reached phys. Res.-Atmos., 113, D09107, doi:10.1029/2007JD009167, in Spatial Planning versus Natural Risk Management, edited by: 2008. Greiving, S., Fleischhauer, M., and Wanczura, S., ARMONIA Menoni, S.: Country Report – Italy, local level, in: Report on Project, Dortmund, 2005. the European Scenario of Technological and Scientific Standards HIC: Wetenschappelijke onderbouw van de Vlaamse waterbe- reached in Spatial Planning versus Natural Risk Management, heersingsplannen , Hydrologisch Informatiecentrum, avail- edited by: Greiving, S., Fleischhauer, M., and Wanczura, S., AR- able at: http://www.lin.vlaanderen.be/awz/waterstanden/hydra/ MONIA Project, Dortmund, 2005. publicaties/risico-brochure.pdf, 2003. Merz, R. and Bloschl, G.: Flood frequency regionalisation-spatial Hooijer, A., Klijn, F., Pedroli, G. B. M., and Van Os, A. G.: Towards proximity vs. catchment attributes, J. Hydrol., 302, 283–306, sustainable flood risk management in the Rhine and Meuse river 2005. basins: Synopsis of the findings of IRMA-SPONGE, River Res. Merz, B., Kreibich, H., Thieken, A., and Schmidtke, R.: Estimation Appl., 20, 343–357, 2004. uncertainty of direct monetary flood damage to buildings, Nat. Høydal, Ø. A., Berg, H., Haddeland, I., Petterson, L. E., Voksø, A., Hazards Earth Syst. Sci., 4, 153–163, 2004, and Øydvin, E.: Procedures and Guidelines for Flood Inundation http://www.nat-hazards-earth-syst-sci.net/4/153/2004/. Maps in Norway, Potsdam, Germany, 252–261, 2000. Merz, B., Thieken, A. H., and Gocht, M.: Flood risk mapping at the Hurkmans, R. T. W. L., de Moel, H., Aerts, J. C. J. H., and Troch, local scale: concepts and challanges, in: Flood Risk Manage- P. A.: Water balance versus land surface model in the simula- ment in Europe – innovation in policy and practice, edited by: tion of Rhine river discharges, Water Resour. Res., 44, W01418, Begum, S., Stive, M. J. F., and Hall, J. W., Springer, Dordrecht, doi:10.1029/2007WR006168, 2008. Netherlands, 2007. ICBR: Atlas van het overstromingsgevaar en mogelijke schade bij Merz, R., Blöschl, G., and Humer, G.: National flood discharge extreem hoogwater van de Rijn, Internationale Commissie ter mapping in Austria, Natural Hazards, 46, 53–72, 2008. Bescherming van de Rijn (ICBR), Koblenz, 2001. Middelkoop, H., Daamen, K., Gellens, D., Grabs, W., Kwadijk, J. Jelinek, R., Wood, M., and Hervas, J.: Risk Mapping of Flood Haz- C. J., Lang, H., Parmet, B. W. A. H., Schädler, B., Schulla, J., and ards in New Member States, EU Joint Research Centre, IPSC, Wilke, K.: Impact of climate change on hydrological regimes and NEDIES, EUR 22902, 2007. water resources management in the Rhine Basin, Clim. Change, Jonkman, S. N.: Loss of life estimation in flood risk assessment: 49, 105–128, 2001. theory and applications, PhD thesis, Delft University of Tech- Milly, P. C. D., Wetherald, R. T., Dunne, K. A., and Delworth, T. nology, 354 pp., 2007. L.: Increasing risk of great floods in a changing climate, Nature, Jonkman, S. N., van Gelder, P. H. A. J. M., and Vrijling, J. K.: 415, 514–517, 2002. An overview of quantitative risk measures for loss of life and Munich RE: Weather catastrophes and climate change, Münchener economic damage, J. Hazard. Mater., 99, 1–30, 2003. Rückversicherungs-Gesellschaft, München, 2005. Kleinen, T. and Petschel-Held, G.: Integrated assessment of Petrow, T., Thieken, A. H., Kreibich, H., Bahlburg, C. H., and Merz, changes in flooding probabilities due to climate change, Clim. B.: Improvements on flood alleviation in Germany: Lessons Change, 81, 283–312, 2007. learned from the Elbe flood in August 2002, Environ. Manage., Kron, W.: Keynote lecture: Flood risk = hazard x exposure x vul- 38, 717–732, 2006. nerability, in: Flood Defence ’2002, edited by: Wu, B., Wang, RMS: RMS U.K. River Flood Model, Risk Management Solutions Z.-Y., Wang, G., Huang, G. G. H., Fang, H., and Huang, J., Sci- Inc., available at: http://www.rms.com/Publications/UK River ence Press, New York, 2002. Flood.pdf, 2001. Kundzewicz, Z. W., Mata, L. J., Arnell, N. W., Döll, P., Kabat, P., RMS: RMS Belgium River Flood Model , Risk Management Jimenez, B., Miller, K. A., Oki, T., Sen, Z., and Shiklomanox, Solutions Inc., available at: http://www.rms.com/Publications/ I. A.: Freshwater resources and their management, in: Climate BelgiumRiverFlood.pdf, 2004. change 2007: Impacts, Adaptation and Vulnerability. Contribu- Roos, A. and Van der Geer, I.: New approaches for flood risk man- tion of Working Group II to the Fourth Assessment Report of the agement in the Netherlands, in: Proceedings of the 4th Interna- Intergovernmental Panel on Climate Change, edited by: Parry, tional Symposium on Flood Defence, 6–8 May 2008, Toronto, M. L., Canziani, O. F., Palutikof, J. P., van der Linden, P. J., Canada, 2008. and Hanson, C. E., Cambridge University Press, Cambridge, UK, Roy, E., Rousselle, J., and Lacroix, J.: Flood Damage Reduction 2007. Program (FDRP) in Quebec: Case study of the Chaudiere River, Lavalle, C., Barredo, J. I., De Roo, A., Niemeyer, S., Miguel-Ayanz, Natural Hazards, 28, 387–405, 2003. J. S., Hiederer, R., Genovese, E., and Camia, A.: Towards an Samuels, P. and Gouldby, B.: Language of Risk - project definitions, European integrated map of risk from weather driven events, Eu- FLOODsite Project, T32-04-01, available at: www.floodsite.net; ropean Commission – Joint Research Centre, EUR 22116 EN, www.eu-medin.org, 2005. available at: http://moland.jrc.it/documents/EUR 22116 2005 Samuels, P., Klijn, F., and Dijkman, J.: An analysis of the current Lavalle et al.pdf, 2005. practice of policies on river flood risk management in different LDS NRW: Vorausberechnung der Bevölkerung 2005 countries, Irrigation and Drainage, 55, S141–S150, 2006. bis 2025/2050 in NRW http://www.lds.nrw.de/statistik/ Schmidt-Thomé, P., Kallio, H., Jarva, J., Tarvainen, T., Breiving, datenangebot/daten/a/r311prog.html, 2008. S., Fleischhauer, M., Peltonen, L., Kumpulainen, S., Olfert, A., Lucarini, V., Danihlik, R., Kriegerova, I., and Speranza, A.: Hy- Bärring, L., Persson, G., Relvao, A. M., and Batista, M. J.: The drological cycle in the Danube basin in present-day and XXII Spatial Effects and Management of Natural and Technological century simulations by IPCCAR4 global climate models, J. Geo- Hazards in Europe, ESPON 1.3.1, available at: www.espon.lu, Nat. Hazards Earth Syst. Sci., 9, 289–301, 2009 www.nat-hazards-earth-syst-sci.net/9/289/2009/
You can also read