Fonterra Dairy Partner to the World - authored by: Silvia Castellazzi Peer Ederer - senseproviders
←
→
Page content transcription
If your browser does not render page correctly, please read the page content below

Fonterra
Dairy Partner to the World
authored by:
Silvia Castellazzi
Peer Ederer

August 2011

http://www.fonterra.com/

©2011 Wageningen University --- EFAS
All rights reserved. Cases are developed for discussion only, and are not intended to serve as source of data. No part
of this publication may be reproduced, stored, transmitted or used without permission of Wageningen University.
acknowledgement
We sincerely thank Alex Duncan, Andrew Ferrier, Peter Goss, Paul Grave, Eric Hansen,
Sir Henry van der Heyden, Abhy Maharaj, Jonathan Mason, Andrei Mikhalevsky, Ian Palliser,
Gary Romano and Kelvin Wickham for their cooperation and openness in developing this
case study.

language advisor
International Meeting Point, Joy Christensen (joysuechr@yahoo.com)

exhibit advisor
Gansser Consulting, Georgine Gansser (gg@gansser-consulting.de)

layout
GAW ontwerp + communicatie, Jeroen Brugman (www.gaw.nl)

print
PrintService Ede (www.printservice-ede.nl)
Fonterra – Dairy Partner to the World
"The policies of all powers are inherent in their geography."
Napoleon Bonaparte, 1769–1821
A Sport of Strength and Velocity
For New Zealanders, rugby is the most widely recognized purveyor of national identity
at home and abroad: competitive, humble and courageous1. It is only natural for the top
management of Fonterra, the NZD 17 billion (EUR 8.9 billion, USD 12.6 billion)2 revenue
strong dairy cooperative to choose the 2011 Rugby World Cup championship semifinals in
Auckland as the best occasion to host some of their most important clients3.
Conversations in the lounge above the pitch move from sports to the outlook for global milk
production to how one should deal with volatility in the markets. It is early October, spring
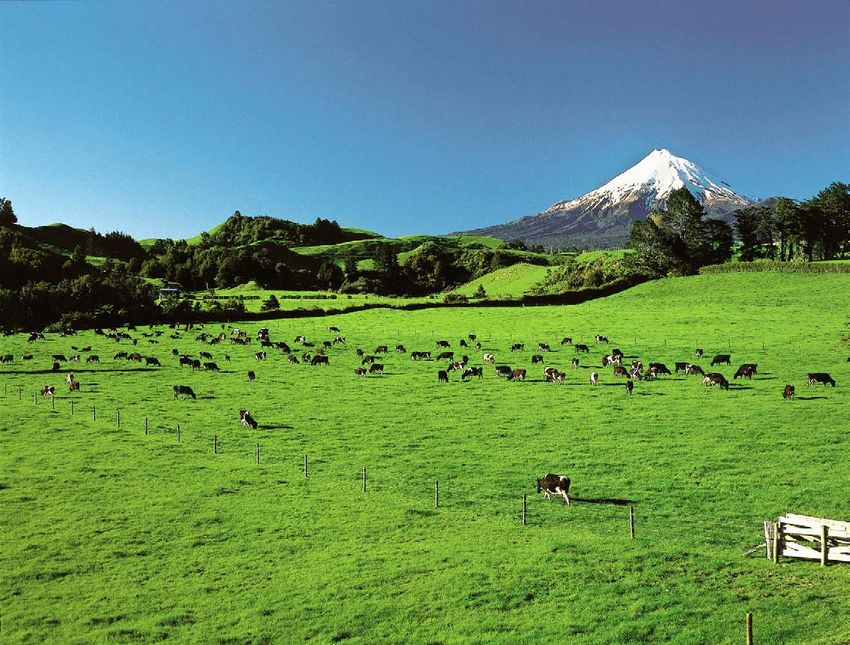
is in the air and the typical winter rains are subduing. The rains create the country's green
and make it a beloved destination for tourists in search of pristine environments. Tourism is
the first source of revenue for New Zealand, but at 26% of NZ exports, dairy ranks a close
second – because cows love the pastures and benign climate at least as much as the tourists
do. Spring arrives during the world cup, and within these six weeks the milk production
in New Zealand will leap from its winter low of 2 million kg a day to the spring peak of
78 million kg a day.
"It has been quite a journey," Andrew Ferrier comments on thinking back over the eight years
since he moved from his native Canada to New Zealand in 2003 to become CEO of this
cooperative with around 10,500 farming members. Ferrier is stepping down September 2011,
and Theo Spierings, former head of the Dutch dairy Friesland, will take over as CEO. Since
a final merger in 2001, Fonterra has been selling about 90% of the NZ milk, being the result
of a century-long consolidation trend, beginning with 256 cooperatives in 1920. Not only
are they the primary processor and seller of NZ milk, but the cooperative and joint ventures
source additional 30% of their produce from outside of New Zealand. They are not only
the world's largest producer of milk commodities – one third of the cooperative's revenues
derive from successful, high-margin specialty and consumer brand businesses. (Exhibit 1 for
Fonterra key financial figures and Exhibit 2 for Fonterra business portfolio)
Since 2008 the global dairy industry has faced unprecedented volatility and Fonterra, with
almost all of its sales in export and most of that into deregulated markets, has had to bear
the full impact of this volatility. Concurrently to these events, Fonterra has implemented
two far-reaching and transformational changes to the kind of organization it is.
1 Russell Brown, in NZ a widely known media commentator writes in 2003: "The All Blacks bundle up a lot of what New Zealanders
choose to think about themselves – strength, humility, courage and the peculiarly practical kind of flair that marks us out from the rest of
the world. It has stood for the idea that a tiny country at the bottom of the planet can consistently achieve excellence on the world stage."
From http://unlimited.co.nz/unlimited.nsf/growth/god-defend-the-all-black-brand
2 At exchange rates of EUR 1=NZD 1.92 and EUR 1=USD 1.35 as per March 23, 2011
3 With 4 billion cumulative viewers, the Rugby World Cup attracts the third largest global TV audience, after the Olympics and the
World Soccer Championship.
European Food and Agribusiness Seminar 1Fonterra – Dairy Partner to the World
While these two new instruments have been under development for many years, volatility has
accelerated their deployment:
• Capitalization structure: The cooperative has approved a new capitalization structure
with tradable shares among members, and up to 20% non-member investors. The
structure is expected to strengthen the financial solidity of the cooperative and enable
more strategic investments.
• Global dairy pricing transparency: The newly created tool GlobalDairyTrade (GDT)
provides a recognized, independent reference price for global milk commodities for
the first time in the history of dairy. GDT is expected to be an arbiter of value added
to the cooperative for external and internal stakeholders alike, and to become a primary
risk management tool for Fonterra and its customers.
Most analysts converge in their view that the global demand for dairy products will rise
steadily, possibly a cumulative 20% to nearly 700 million metric tons over the next ten years
(up from 580 million MT in 2009)4. Most of the upcoming demand accessible to the export
market will arise where Fonterra has core markets, namely the Asian marketplace (Exhibit 3
on dairy trade by region, Exhibit 4 on global dairy opportunities). But this positive market
outlook need not automatically bring higher profits for NZ dairy farmers nor better fortunes
for Fonterra, on examination of the following aspects:
• Expectations of high dairy prices are being priced into the value of land in New Zealand,
such that the profit margins of additional dairy capacity created on newly converted dairy
land may accrue to the seller of the land, and not necessarily to the operator of a farm
– potentially exposing debt-leveraged dairy farmers to a credit crunch during downturns.
The price of dairy land expressed in kg producible milk solids from this land increased
from NZD 12.50 in 1990 to NZD 50.80 in 2008. Since then they have fallen steadily,
with transactions in summer of 2011 priced at NZD 25 per kg producible milk solids
(Exhibit 5 on development of NZ land values and milk solid prices). Meanwhile, the
inflation-adjusted 30-year average payout per kg milk solids has fluctuated around
NZD 5.30 (Exhibit 6 on development of dairy payouts and amount of milk processed).
In May 2011 the forecast dairy payout was NZD 8.00–8.10 per kg milk solids before
retentions and including a dividend of NZD 0.60 – a record number for Fonterra. Farm
operating expenses are estimated to be around NZD 3.00 per kg milk solids5. (In NZ,
the reference unit for dairy production is "kg of milk solids", which corresponds to the
fat and protein content part of milk. (Exhibit 7 for an overview of the evolution of milk
protein and fat content)
• Historically, New Zealand was always the supplier of dairy products with the lowest
production costs in the world, but this position has been taken over by some niche
producers in Latin America, Central Asia and even Africa. While these are not expected
to grow exponentially, NZ experts are building more and more pasture-based dairy
4 The International Water Management Institute (IWMI) expects 720 million metric tons by 2025; the United Nations Food and
Agricultural Organization (FAO) forecasts 746 million MT by 2030 and 895 million MT by 2050.
5 Goldman Sachs Thematic Report on NZ Dairy Farming, November 2010
2 European Food and Agribusiness SeminarFonterra – Dairy Partner to the World
systems at suitable locations around the world and they are beginning to compete,
thus beating the home land at its own game. (Exhibit 8 on milk production costs)
• Despite a purchasing share of approximately 90% of the NZ milk market, Fonterra's
hold there is more brittle than it looks: Saddled with less productive legacy assets, and
regulation forcing Fonterra to accept milk from far flung places, the company faces
competitors who enter the market and cherry pick the best locations to build modern,
economical processing capacity, thus offering more attractive milk prices to the farmers
in those particular regions.
• Globalization and value-added strategies are tasks that demand more and new sorts
of talent in an ever more complex organization, increasing the challenge to remain
quick-footed.
While Fonterra has strategies in place to manage such challenges, the volatility events of the
past three years have shown that nasty surprises can be in store (Exhibits 9 and 10 on dairy
price volatility). In the drought year of 2008 Fonterra was faced with a cash outflow of NZD
700 million in share redemptions, entering into the global financial crises of 2009 when milk
prices were down, with precious few cushions; and in parallel, they were embroiled in the
China melamine milk scandal, which threatened to taint Fonterra's high quality reputation
among the trading partners.
Yet, none of the above touches what may be at the core of this enterprise: the cooperative DNA.
In its history Fonterra has turned adversity into global market leadership, creating markets and
opportunities against the odds. Business events in 2008 and 2009 made it clear that a new era
of the dairy world has dawned, and that this era requires different instruments and different
governance tools – tools such as the new capitalization structure and GDT. Possibly more
important than changing the way Fonterra conducts business, however, these tools may have
a transformative impact on the whole global dairy industry – a transformation that is yet to
fully unravel, as more and more of the implications are revealed. By embracing volatility and
building business models that are robust enough to create value in spite of or even because of
this volatility, Fonterra may once again be leading the world of global dairy – are they?
The manager to oversee this transformation is CFO Jonathan Mason, who joined Fonterra in
February 2009. Previously he was with Cabot Corporation, as executive vice-president and
CFO since 2006. Between 1990 and 2006, Mason worked in various roles at the USA-based
International Paper, rising eventually to vice-president and treasurer. An American by birth,
Mason and his family hold dual citizenship in New Zealand and U.S.A. Mason holds a
Master of Business Administration and a Master of Arts, International Relations, both from
Yale University, Connecticut, U.S.A., and a Bachelor of Arts, Economics and International
Relations from Beloit College, Wisconsin, U.S.A.
Fonterra managers and their customers are enjoying the Rugby tournament. Rugby and
Fonterra share some common traits. As a team sport that requires strength and velocity, it
represents a fundamental element of the Kiwi identity and links a remote country in the
Southwestern Pacific to the rest of the world – and it is a sport at which New Zealanders
are the champions to beat.
European Food and Agribusiness Seminar 3Fonterra – Dairy Partner to the World
Dairy in New Zealand
Back in the nineteenth century, Napoleon asserted the role of geography lato sensu in shaping
the strategy of a power, be it a nation or other organization. New Zealand is no exception.
A remote position in the Southwestern Pacific Ocean, a deregulated economy with few raw
materials (at least not the type their neighbor Australia has), and the abundance of fertile land
and water are the triggers that turned the Kiwi dairy system into the most cost-effective in the
world and made it renowned for quality.6 Indeed, with four million people and at least that
many cows, the country could not be dedicated to anything other than export. Of the milk
produced and processed in New Zealand 95% is directed to other countries, 96% of which are
north of the Equator. For that reason, most of the milk the country produces is processed and
exported in the form of commodities with a long shelf life, such as powders, caseins or butter.
A Fonterra commissioned study quantified the significance of the dairy complex for the
national economy of New Zealand in 20097 (Exhibit 11 for a model of the economic
impact):
• 26% of the entire exports of the country were dairy products.
• 2.8% of GDP was related to dairy if direct activities are considered, at least twice
as much if induced effects and collateral activities are taken into account.
• On-farm employment accounted for 24,000 jobs in the country, plus 10,000 more
in the processing chain – not including those farmers listed as self-employed.
• Through taxation, the dairy sector contributes consistently to services and welfare
in New Zealand. Calculations show that dairy growth in the past decade benefited
schools, hospitals and police services with an increase of up to +0.7% more funds
in 2009.
• The dairy business drives many rural economies and keeps the country together:
"When dairy farmers are smiling, the whole region is smiling." 8
The amount of land available, coupled with plentiful precipitation, has allowed a flourishing
pasture-based dairy system to develop which delivers products of above-average quality.
Pasturing cows deliver dairy products of consistent characteristics, intense flavor and color,
and high nutrient content. They are an integral part of the landscape of the country, adding
an emotional nuance of healthiness and natural goodness to the products that cannot be
easily replicated in other dairy environments.
The dairy production chain and cost structures in New Zealand differ substantially from
those in feed-based dairy complexes. In New Zealand, the main inputs for dairy farming
are land and grass: after having invested in the land, everything else comes at comparatively
little additional cost. It translates into high fixed costs (for the land), low variable costs,
and a relatively limited capacity to increase or decrease production in the short term.
6 Rabobank on NZ dairy: "As the purest of export players (with 95% of milk exported beyond its borders) and with an industry model
forged by years of competition in a largely deregulated environment, New Zealand's cooperatives have been able to fully capitalize on
the sharp increase in the value of dairy commodities." Rabobank Dairy Outlook 2010, p. 4
7 Figures from NZIER Economic Report on Fonterra
8 DNZ, 2010
4 European Food and Agribusiness SeminarFonterra – Dairy Partner to the World
For comparison, the inputs to a feed-based dairy system are soybean meal, alfalfa hay and
corn, the most common mix to feed dairy cows housed in a barn. In this case, production
volumes can be adjusted more easily, to some extent through nutrition.
Differences in the input impact a series of other aspects down the chain. The pasture-based
systems are more dependent on weather, as it ultimately determines the available amount of
feed for the livestock. In this setup the land asset attracts value appreciation and capitalization
most strongly. Feed-based systems, on the contrary, are exposed to feed price volatility, which
greatly impacts the prices of the final products as well, also exposing dairy to the fluctuations
driven by global food-feed-fuel dynamics more than it is the case for pasture-based systems.
The two systems also have different production curves: pasture-based systems are highly
seasonal, while feed-based systems spread the production more evenly over the year. In the
first case, farmers synchronize the calving period with spring, when grass is most abundant.
During spring, production across New Zealand can peak at 78 million litres per day. The less
grass is available, the less milk is produced. In winter the supply of milk is lowest at 2 million
litres per day, which is barely sufficient to satisfy the NZ home market. Thus, the production
curve of a pasture-based system like that in New Zealand resembles a shoulder. (Exhibit 12)
Such a steep production curve has effects further downstream, in processing and logistics.
While processing plants and shipping compensate with a flexible workforce and other means,
the utilization of processing plants and logistics systems is well below 50%. Though it adds
substantial cost to the system, this is more than offset by economies of scale and the cost
advantages of the pasture-based feeding. For Managing Director of Trade and Operations
Gary Romano, it translates into yet another source of volatility and risk to be dealt with:
"Because of the production curve being quite peaky and demand for dairy being rather
flatter over the year, stocks may accumulate for a long time until sale. When you make
the production decision, allocating quantities of milk for processing into a certain type
of product, you have to decide on the forecast four or five months in advance; but once
I have made a certain amount of cheese, for instance, I cannot change it, I have to put
it on the market. So most of my job is really about risk management and risk
mitigation."
Dairy Global Trends
According to statistics for 2009, the EU and the USA accounted together for half of the 580
million tons of milk produced in the world. Of this production total, 7% was not consumed
in the country of production, whereby the EU and New Zealand each contributed a third
part of the 7% of milk products which were exported9.
9 Goldman Sachs & Partners, New Zealand, Economics – Farmer Fragility Despite Robust Dairy Price Outlook, November 2010, p. 2
European Food and Agribusiness Seminar 5Fonterra – Dairy Partner to the World
There is consensus among analysts and operators that the demand for milk will increase
over the years, based on global trends which can be observed and which are here to stay:
demographic change and ageing populations, urbanization, growing middle class entering
a protein-based diet (Exhibits 13, 14 and 15). The challenging questions are: Who will be
able to satisfy the increasing demand and what are the priorities for taking advantage of these
new opportunities? Fonterra's Director of Optimisation, Trading and Sourcing Ian Palliser
summarizes:
"The EU and USA account for 60% of the value of dairy product consumption.
However, growth in consumption has been driven by Asia. In particular, Chinese
consumption has increased fourfold between 2002 and 2008, with particularly
strong demand for fresh dairy products. … The largest importers of dairy products
are China, Mexico, Japan and Russia." 10
"The additional dairy demand in Asia over the next ten years amounts to about
eight Fonterras. So, the question is not whether we are going to grow – the question
is how can we pick the most profitable part of that growth?"
In parallel to increasing demand, analysts believe that both higher price levels and higher
volatility are here to stay. According to Goldman Sachs:
"Over the past nine years, there have been regular imbalances between global
growth and demand of dairy products. These in turn have created large changes in
international dairy prices, ranging between -44% and +85%. We believe global
imbalances are magnified by being traded in a relatively small international market
for dairy products. Low levels of inventory in any one year can exacerbate price
movements." 11
Rabobank assesses:
"…some major structural shifts have occurred in the global dairy market in recent
years. Central to these shifts are that global dairy commodity prices have shifted to a
higher average trading price. The combination of cost push pressure, strong demand
growth and supply constraints in key production regions have all combined to exert
considerable upward pressure on the prices of dairy products in international trade. …
Regardless of price levels, price volatility is likely to remain high. The price-inelastic
nature of dairy supply and demand in developed markets, which still dominate global
consumption, leaves the dairy market prone to sharp price fluctuations when subject to
destabilizing shocks. Such shocks are becoming more common, in the form of climate
change and increased input cost volatility." 12
10 Goldman Sachs & Partners, New Zealand, Economics – Farmer Fragility Despite Robust Dairy Price Outlook, November 2010, p. 3
11 Goldman Sachs & Partners, p. 4
12 Rabobank Dairy Outlook 2010, p. 3
6 European Food and Agribusiness SeminarFonterra – Dairy Partner to the World
The dairy market is in a peculiar position among commodities, with neither cash nor
financial market equivalents to offset volatility. The system does not have established hedge
instruments, mainly because the market for dairy trading has historically been small. Given
the volatility of the last couple of years though, the progressive abolishment of quotas in the
EU, and the opening of new sales opportunities in the Middle East and Asia, the time may
have come to create such markets for dairy as well. Romano concludes:
"Over the next years, we will witness an increase in the proportion of traded products.
Now, about 7% of the dairy global production is traded; it is deemed to go up to 9%
within ten years, and we expect it to continue growing after that. A 2% increase might
not seem a lot in relative terms, but in absolute volume terms this increase is as large as
our annual output. This is significant for us, since we are so extremely export-oriented.
The trading opportunities which will arise will change the way we think dairy. It all
comes down to managing the volatility. Volatility makes us very uncomfortable because
of our long term contracts, so it should not be a surprise that we go from bilateral trade
to spot market to a financial market. The New Zealand Stock Exchange has offered a
futures market for whole milk powder since 2010, and in 2011 it has added futures
contracts for anhydrous milk fat and skim milk powder.""
Fonterra's History and Key Figures
Dairy in New Zealand has undergone several structural changes to be able to survive and
thrive in the global market. Due to its natural assets, New Zealand has always had an
inclination for grazing animals (sheep and cows). Back in the 1960s and early 1970s, the
main destination of Kiwi dairy production was the UK: because of historic and cultural ties,
that country was the obvious landing point for the great majority of New Zealand exports.
When the UK entered the EU in 1973, that country found its hands tied to the EU
Common Agricultural Policy, and so did New Zealand. Quotas, intervention, subsidies
and livestock limits also ended free importation from the Southern Hemisphere. This placed
New Zealand under pressure to diversify production and find new markets for their produce
(Exhibit 16 for the evolution of the EU Common Agricultural Policy support model).
Palliser recalls:
"New Zealand had to change its trading patterns. The country was on its knees,
the reference market, the UK, had disappeared. The New Zealand Treasury had a
catch phrase, back in those days:TINA – There Is No Alternative. We could have
accepted that our sales were shrinking, or we could have pulled our sleeves up and
gone out there searching for other markets. Guess what we did?! You know, they were
like pioneers in those days. The teams went out there and started searching for other
markets. Venezuela, Cuba, Morocco, the Middle East. We found those new markets."
European Food and Agribusiness Seminar 7Fonterra – Dairy Partner to the World
Much as elsewhere in the meanwhile, a process of consolidation of cooperatives and farmers
occurred in New Zealand: starting with 256 coops in the 1920s, Fonterra resulted from a
final merger in 2001, leaving only two minor competitors. Since then several new dairies
have entered, gradually whittling Fonterra's purchasing share to below 90% of NZ milk.
(Exhibits 17 and 18 on top global dairy companies and milk processors)
While their British market vanished, Fonterra and the NZ dairy market spread to other parts
of the world. As time passed, those markets matured in quality and quantity, and Fonterra
underwent further transformation. At first the main goal was to place as much commodity as
possible. Then Fonterra began to value-enhance the commodities with logistics and customer
services, investment into and leverage of intellectual property rights, specialty products and
development of brands. In the course of that, the cooperative began to look and behave more
like a corporate business.
In parallel to this, the cooperative tackled the issue of sourcing. To offset risks deriving from
weather, biosecurity and regulatory intervention, customers increasingly asked for multi-site
production, which was the starting point for Fonterra to begin sourcing from Australia,
Brazil, Chile, China and India. More sources of milk equal greater security of supply for the
customers. From the Fonterra viewpoint, they went "…from being 20 years ago a leading dairy
exporter to being a major multi-origin dairy trader".13 (Exhibits 19 and 20)
In 2010 Fonterra totaled a revenue of NZD 16.7 billion, with exports in 140 markets,
10,000+ shareholders, 14.7 billion litres of NZ milk processed and a further 6 billion
litres sourced outside of NZ (including joint ventures). The cooperative generated
NZD 1.07 billion in earnings before interest and taxes.
Fonterra being a cooperative, the bottom-line for farmers has naturally always been the milk
price payout. Because there are no competitors in New Zealand that can match the size of
Fonterra, the cooperative has to measure itself against a hypothetical competitor in an
internally developed mechanism designed to find the buying price. The system is such that
the final price paid to the farmer consists of two elements: an actual milk price, deriving from
the sales minus the cash and non-cash costs of Fonterra, and a dividend, or distributable
profit, which derives from all the other non-commodities operations (sales of branded
products, food specialties, ingredients B2B, pharmaceuticals etc). The calculations are
complex, but essentially they amount to a simulation of what an efficient milk producer
should have been achieving in terms of payout to the cooperative member. Fonterra is legally
bound to purchase all the milk offered by farmers in New Zealand, and farmers have to buy
shares in Fonterra corresponding to their milk output. The proceeds from these share sales
finance the processing facilities.
13 Fonterra materials
8 European Food and Agribusiness SeminarFonterra – Dairy Partner to the World
Managing Upcoming Risks
If there has been an annus horribilis in the history of Fonterra, it was 2008. In that year and
well into 2009 a combination of events – drought, equity loss, global financial downturn,
sharp volatility of the commodity prices, melamine in China14 – struck the cooperative
and fast-forwarded a series of wide-ranging changes affecting the whole of the organization.
Strategy, capital structure, pricing mechanism, priorities, governance – all have had to be
rethought and adjusted to make sure the cooperative is well armed to face the future.
A severe drought in early 2008 shrank milk production by 8%, which led farmers to redeem
their shares in the cooperative (in order to raise capital and because they delivered less milk).
Back then shares were to be bought by Fonterra on certain dates planned for the year. When
that day arrived in that year, hundreds of farmers decided to cash in, and Fonterra suffered a
net loss of equity of about NZD 700 million from a total of NZD 4,829 million.
Through the years, the cooperative had shown a preference towards distributing most of the
dividends back to the farmers – on top of the milk payout – limiting retention to the
minimum required to "keep the ship going", as they put it. This satisfied the priorities of the
farmers, but exposed the cooperative to operation on a limited amount of equity, whereby the
little that was available had to be kept liquid in case the farmers overwhelmed Fonterra to
redeem the shares – as it happened in 2008. Less than equity, Fonterra had only quasi-equity
available. It became impossible to ignore the tension between farmers' individual interests and
needs on one side, and the collective need of the cooperative to retain capital for investments
and security on the other.
Fonterra also suffered financial exposure to volatility and farmers' share redemptions in
another, more subtle way. Chief Economist Group Strategy & Corporate Finance Dr Eric
Hansen explains:
"Back then, Fonterra was managing a good portion of its sales in one-to-one, medium-
to long-term contracts with customers, thus taking on its shoulder the task of offsetting
volatility both for buyers and for sellers. This set-up worked fine as long as volatility
was soft, and also represented a consistent competitive advantage for the cooperative.
When volatility peaked though, we got exposed. We could not pay the spot market price
to the farmers because of the long-term contracts, and some of the competitors quickly
stepped in, offering a higher price. The risk materialized with farmers leaving Fonterra
for some of the competitors, again cashing in on shares and taking away more of the
equity."
14 Fonterra was a major shareholder of the Chinese dairy SanLu, owning a stake of 43% in the company, which was involved in the
melamine adulteration scandal in China in summer 2008: contaminated baby milk powder led to six infant deaths and about 300,000
illnesses within a couple of months. "The contamination was reportedly made by suppliers to dairy producers, who used the chemical
substance melamine to convince quality checking devices that there was more protein in the product," reports the Australian Food News
magazine in September 2008. It was Fonterra who alerted the Chinese authorities to the irregularities, but this was a tough instance of
crisis management and several voices have complained about a delayed response of the cooperative and reluctance to release information
about the issue. Towards the end of 2008, SanLu was declared bankrupt.
European Food and Agribusiness Seminar 9Fonterra – Dairy Partner to the World
The lack of investable funds appears to have held back attractive business prospects.
Managing Director of Global Ingredients and Food Services Andrei Mikhalevsky explains:
"I would like to be able to say that the biggest value will come from leveraging our
intellectual property. We have a lot of patents, but we have never really understood
how to commercialize them. We are leading on proteins, we understand applications.
I would love to be able to say that the most value we are going to get is in driving
the innovation we have. Unfortunately, for that you need capital for growth. During
this whole process of capital restructuring there was no capital to invest. I have gone
through three years without any opportunity of really investing any money."
The underlying theme for Fonterra in all of this is how to manage volatility, opportunities
and risks better for the business and for customers, and thus remain in the pole position to
take advantage of the global growth in milk:
a. The redemption risk has to be solved by raising more capital and restructuring the
whole cooperative in a way that limits the amount of equity washing in and out
of the books. Otherwise, the capacity of the cooperative to invest in value-added
downstream activities would be curtailed.
b. On a more structural level, the cooperative has to provide itself with risk managing
tools to offset the increasing volatility of the commodity market. In doing so, Fonterra
is decided on taking the lead in moving from one-to-one contracts to creating a real,
transparent cash market for trading its commodities, which would eventually lead
to a further and more advanced modality of trading, i.e. to financial instruments
(derivatives) to hedge volatility.
c. Strategically, all these risks sharpen the need for a broadly understood vision of
Fonterra's future and the need to create mechanisms by which the underlying
dichotomy can be resolved between the cooperative's need for immediate payout
and the corporation's requirement for long-term investable funds.
Trading among Farmers and the GlobalDairyTrade Platform
Following an intensive, decade-long debate, members approved an action called Trading
Among Farmers in June 2010, which is to be introduced in the course of 2012:
• With Trading Among Farmers, it is no longer Fonterra that must redeem shares, having
created a market among farmers. This way, farmers can buy or sell shares within this
market on every day of the year, without putting the equity of the cooperative at risk.
• Furthermore, a secondary market is being introduced, open to external investors who
do not need to be farmers themselves. They can buy units which correspond to shares
and contribute thus to the capital of the cooperative, and receive a dividend at the end
of the year. These units are listed on the New Zealand stock exchange. They do not
10 European Food and Agribusiness SeminarFonterra – Dairy Partner to the World
include voting rights,15 as farmers rejected the possibility for external ownership to
enter the cooperative; and these investments are limited to 20% of the overall capital
stock.
The new external investors create an external price signal for the value of the member
shares and provide welcome equity capital to the cooperative, but they also introduce a new
dynamic: while the member farmers achieve their returns mostly via a high milk price, the
external investors are interested in the profit achieved above the milk price, i.e. in the creation
and distribution of dividends coming from the value-added product. To some extent the
interests of the two groups may overlap, but not fully16.
Thus, the entrance of non-producing investors has necessitated a more transparent milk price
mechanism, about which both farmers and investors could agree. That became the key
accelerator behind establishment of the GDT platform – GlobalDairyTrade – which was
piloted in 2008 for reasons of improved risk management.
GlobalDairyTrade is an auction-based system for trading dairy commodities, and the first of
its kind worldwide. It employs an online trading platform managed by an external entity and
creates a market for Fonterra on the one side and buyers on the other. Volumes of products
are put up for auction at a starting price, and the price increases through several rounds of
bidding until all available volumes are sold. It establishes the market price of the commodities
in its most fundamental meaning, the price where the supply is exhausted and where the
paying capacity of buyers is exhausted (Appendices 1, 2, 3 for a comprehensive presentation
of GDT and Appendix 4 for GDT-index movements in comparison to price fluctuations of
major commodities). Paul Grave, general manager of GlobalDairyTrade, explains:
"GlobalDairyTrade sells commodity products which are very undifferentiated, very
standardized, and could be produced everywhere in the world. You can find the
core-undifferentiated commodity, but if you want something special you have to try
another market somewhere else. Some big customers in the consumer brands business
do not buy on GDT for instance. They have specifications with vitamin A or D for
their brands and cannot find their products here. GDT is the basis, then they pay a
premium according to the specifications and services that they bundle to the commodity
product. GDT sets the reference price even if you do not buy on GDT."
In 2010, 25% of all Fonterra sales were effected on GDT, but the intention is to expand it
further, also allowing other sellers to enter and thus creating an even more refined cash market
for dairy and a more efficient, globally recognized mechanism of price discovery.
15 Fonterra was well aware that non-voting shares would not fully exploit the value of the cooperative, but it was a deliberate choice.
Manager for Group Strategy and Corporate Finance Abhy Maharaj recalls: "When we looked at non-voting shares, we realized that they
would have implied a discount, we knew they would not be traded at the real Fonterra value. There is a discount in place which we
could not eliminate through this structure. This is why farmers are not looking for full value. Some of them do, but collectively they do
not."
16 Dr Eric Hansen of Fonterra comments on this point: "Farmers have always pressed the coop to move up the value chain into higher
value goods. The problem is that it is difficult for them to realize what kind of investment the cooperative would have to plan in order
to do so. Farmers tend to think that simply by leveraging the NZ clean/green image a higher milk price could be achieved – they want
higher value without putting up the capital to pay for it."
European Food and Agribusiness Seminar 11Fonterra – Dairy Partner to the World
Benefits for Fonterra:
• GDT creates a clear benchmark, a reference price that can be used across the world.
• It disciplines sales forces also in other channels within the company: Can you beat the
GDT price?
• It offers a benchmark also for non-commodity products: the benchmark is set. Each
premium specification that is added through branding or IP adds to that benchmark
starting price.
Benefits for the farmers:
• GDT adds clarity. Farmers only have to look at GDT price movements to see the
movements of their expected payout.
Benefits for the buyers:
• GDT adds clarity, both in prices and in volumes.
• Product is always available, even for infrequent, low volume buyers who otherwise may
be marginalized.
The introduction of GDT in 2008 was not an entirely welcome event, but it has won more
friends in the meanwhile:
"I was getting some abusive phone calls in the beginning, like what are you doing?
GDT is dragging prices down! But it was not GDT, of course; it provided a reflection
of the market price. The fact that markets went down during the introduction of GDT
helps us now against the reverse suspicion from buyers that GDT is the reason why
prices are going up." (Group Director Supplier and External Relations Kelvin
Wickham)
"When we started with GDT in 2008, it was the same time when commodity prices
started to plummet – many did two plus two and got six, thinking that it was GDT
pulling prices down. But if you look at the commodity prices back then, also oil,
soybean, maize, for instance, you see that it was a trend then. All commodities
prices plummeted, it was not really GDT having an effect on it." (Director of
Optimisation, Trading and Sources Ian Palliser)
"GDT came about because we needed a robust milk price, having external investors
coming in. It was so that suppliers have always been suspicious about not getting paid
enough, and external investors would be suspicious that the farmers would get all the
retentions. Now with GDT in place, there is a system to draw the line." (Peter Goss,
Ernst & Young partner)
"Ten years ago a dairy farmer would not know the relationship between USD and
NZD, and no idea what was happening on prices. Now you ask the majority and they
can tell you the rate; it is on TV and they track it. We have a GDT event every two
weeks. I send them an email every week: very simple, they will just look at one number,
whether it is up or down. A fantastic position for the farmers, they know what they get
paid is driven by the currency and what is going on in the market." (Sir Henry van
der Heyden, chairman of Fonterra)
12 European Food and Agribusiness SeminarFonterra – Dairy Partner to the World
"Previously, with only bilateral sales efforts, the big customers tended to muscle out the
small customers when supply became tight. Small and medium size customers faced the
risk of being cut off or at least being capped in the amount of product they could buy.
GDT has introduced a change in this dynamic. Now we have a large number of small
and medium customers who value GDT, because they know they have equal
opportunity to purchase products this way. Big customers, on the contrary, were initially
less welcoming because they believed they could get a lower price negotiating on a
one-to-one basis with Fonterra. Sales people are always under tremendous pressure to
compromise to complete the deal, and because of the relationship. With GDT, they go
out there and they think, ‘My job is at risk unless I get at least the same price as GDT
does or find some other service or product addition I can sell to the customer.' GDT is
bringing about an incredible sales discipline." (CFO Jonathan Mason)
Three Strategies for Being a Global Dairy Partner to the World
"You don't just grow for the sake of growing, you grow for a strategic reason,"
clarifies Mr Ferrier before expanding on the three strategies of Fonterra:
1. Sustainable cooperative performance
2. Grow lasting customer partnerships
3. Build trusted brands in chosen markets
"First, it all starts with sustainable cooperative performance, ensuring that through
all our activities, NZ farmers can produce their milk and are able to sell it consistently
on the world market for the best sustainable milk price, for generations to come.
Our investments in infrastructure, in the supply chain, in the business model, etc. are
all to ensure that we can be as efficient a producer and processor as possible. The sheer
operational numbers involved are huge: for instance, 15,000 employees operating at
26 locations in some 80 installations, some of them being the largest milk driers in the
world. We are closing the doors on a container full of dairy exports every five minutes
from one of eleven NZ ports.
Second, we have built on that milk supply a model for growing lasting and often
global customer partnerships. We aim to drive value on top of the commodities through
bundled services, consistent and high quality supply and secure market access. To global
customers it also increasingly matters that we are not a single origin supplier, and are
therefore building out global sources of milk. This also includes better leverage of the
technologies we have developed. We are probably better at understanding milk proteins
than anybody else, but we have not been so good yet to utilize that knowledge for our
customers. For instance, we sell 970 configurations of milk ingredients, we are the key
suppliers to all five of the world's largest infant formula companies, and we supply the
world's top 100 pharmaceutical companies with lactose excipients.
European Food and Agribusiness Seminar 13Fonterra – Dairy Partner to the World
Third, we continue to build our brands in chosen markets. They are three regions:
1. Australia/New Zealand, 2. Asia/Africa/Middle East, 3. Latin America. We do
not see that we have a competitive advantage in taking our brands to Europe or
North America. But in our chosen markets we have created a well-groomed consumer
marketing business which has grown profits of about 20% over each of the past four
years and constitutes roughly one third of our overall sales. The growth rates we are
achieving are surpassing any of our multinational brand competitors.
In essence, we are looking into each global market segment and making a choice as to
whether we will leverage our branding competence, or our technology competence, or
our supply competence (or a combination of each) in dairy products, in order to create
more value for our NZ farmer members."
Nurturing Value Pools along the Fonterra Value Creation Chain
Another way of looking at these three strategies is to see them as three value pools that
"belong" to different stakeholders along the Fonterra value creation chain and to which
these have access in different ways.
In the first strategy, the dairy farmers of New Zealand deliver their milk output to the
cooperative, and with their collective investments into efficient processing equipment and
operating processes they make all of this exportable in the form of commodities to anywhere
in the world. The value derived from this milk and its exportability accrues to the cooperative
members in the form of the milk price obtained. The value of this obtainable milk price tends
to accrue in the value of the land. (Exhibits 21 and 22 on dairy farm working expenses)
In the second strategy, additional value above those commodities is being created in the form
of customer relationships, service bundles, technologies and intellectual properties, or global
milk sourcing arrangements. These value additions to the commodity price require various
investments in R&D, skills and customer relationships, which need to be compensated by the
higher prices created. The corporate value created in these investments thus "belongs" to the
investors providing the funds – and to some degree to the managers and employees of the
company who have created that business with their commitment.
In the third strategy, value is created by building a consumer brands business. The structural
investments required to build such consumer brands pay themselves back in the superior
margins which consumer brands tend to generate. A brands business also accrues corporate
breakup value, as such brands are relatively easy to sell in the global M&A market. In that
sense the value pool accruing in the brands business is attached to a particular market
presence. Such a brands business often has joint venture owners, as is the case between
Fonterra and Nestlé with their Brazilian dairy brands business, Dairy Partners America, thus
entering another external stakeholder.
In previous years the dividing lines between these three value pools tended to blend into each
other: there was only one ownership group, the NZ farmer members – and only one ultimate
valuation tool, the milk price payout.
14 European Food and Agribusiness SeminarFonterra – Dairy Partner to the World
With the introduction of the new capitalization structure and GDT, the dividing lines will be
more complicated. Since GDT sets the price for the commodity, one could argue that all
value created up to the prices achievable on GDT "belongs" to the farmer members in the
form of their milk payout, while all value created above GDT "belongs" to the Fonterra
investors. Eighty percent of the Fonterra investors are also farmers, but 20% may not be, so
the investor group must be thought of as a different stakeholder with its own set of interests.
GDT draws a similar dividing line in the brands businesses. While the brands business units
are barred from buying their supplies from GDT for governance reasons, GDT levels can de
facto be the transfer price for their raw materials, with a clear dividing line of value created on
top of these in the brand activities.
The consumer brands business entails some essential questions for Fonterra. Compared to an
established consumer goods giant, a cooperative has in fact an inherently higher cost of
capital, so that the consumer brands business, which has been growing nicely on top of all,
might become more valuable to a buyer than to Fonterra itself. What would stop the investors
(primarily the farmer members) from selling the brands and taking the cash? After all, thanks
to GDT, the sale of the milk would be assured just as before.
Another scenario is described by CFO Jonathan Mason:
"If the value of our non-commodity and brands businesses becomes much higher than
the commodity business of accepting and processing milk, then that additional value
is reflected in a higher share price above the value obtainable from selling commodity
milk. But, if a farmer member wants to sell more milk, he must buy a corresponding
amount of shares. So we would be essentially forcing him to become an investor in all
that value-added business. He may want that, but he may not. At the moment we are
not giving him a choice. Yes, there are solutions to this, but it makes the whole picture
a lot more complicated."
Managing Director of Trade and Operations Gary Romano raises a third new question:
"Who and what is our sales force working for? Before, it was in a sense easier: Sell the milk.
But now he has to justify himself not only by selling the milk, but also by selling it above
GDT price. But GDT does not sell itself automatically either. We still need to attract and
generate buyers even for GDT. We need to rethink how to manage our sales force."
Many more ramifications could be imagined, and many questions are not yet settled. Is GDT
increasing milk price volatility, or decreasing it, or does it have no influence on volatility? Is
the creation of a financial futures market and thus the invitation of financial speculators into
the dairy market a good thing or a bad thing, and for whom? Can the investors who are a
non-voting, 20% fraction of the ownership of a business really be told to shut-up? Will any
of this make farm land prices in New Zealand go higher or lower, and for whom would either
move be welcome? Will all of these challenges energize the company to make optimal use
of the growth in its markets, or will internal strife over value apportioning slow down the
organization? It may be that the overarching question is: Are the two transformational
instruments which Fonterra is implementing – GDT and new capital structure – the right
and sufficient answers to face the brave new world of global dairy?
European Food and Agribusiness Seminar 15Fonterra – Dairy Partner to the World
And what do the member farmers think? The Chairman, Sir Henry van der Heyden believes:
"Our farmers are pretty busy running their dairy businesses. I doubt that many of them
have the time or the interest to think through all the different things that could be
happening to their cooperative. However, of one thing I am certain: the farmers will
never give up control: First, the chairman must always be a farmer. That is in the
constitution: I sit here and I optimize things for my farm. Secondly, the majority of the
board will always be farmers. And third: farmers will always have the right to remove
the directors."
Farmers are said to have the phone number of the Chairman as a speed dial on their phones
– 10,500 members are ready to pick up the phone, should they get the impression that the
management of their cooperative is not treating them right.
16 European Food and Agribusiness SeminarFonterra – Dairy Partner to the World
Appendix 1 Questions and Answers on GDT
1. What is GDT? 4. Which products are offered?
GDT, GlobalDairyTrade, is the Fonterra developed On GDT only dairy commodity products can be
on-line trading system for dairy commodity bought: whole milk powder, skim milk powder,
products to manage volatility and discover the anhydrous milk fat, butter milk powder, rennet
price market. It is the first of its kind worldwide. casein, milk powder concentrate, and cheddar
It can be accessed on www.globaldairytrade.info. cheese. All products are very undifferentiated.
(Figure 1) Fonterra publishes a 12-month forecast of how
much product will be offered at each event, and
2. Who can participate? Who participates? the forecast is confirmed five days before each
Participants are vetted before registration. Products event. (Appendices 2 and 3)
purchased have to be used for the bidders' own
purposes only, unless Fonterra agrees otherwise to 5. How often does GDT run trading events?
allow a distributor to resell the product. None of Trading events are run twice a month, to allow for
the bidders can be a Fonterra related party. In June significant liquidity of the market and to ensure a
2011 there were 338 registered bidders from nearly more regular and transparent price signal by
60 markets, including: Bahrain, Bangladesh, eliminating mid-month uncertainty.
Cameroon, China, Canada, Costa Rica, Djibouti,
Egypt, El Salvador, Guatemala, Honduras, Hong 6. What determines which volumes are sold on
Kong, India, Indonesia, Jamaica, Jordan, Kuwait, GDT each time?
Lebanon, Libya, Malaysia, Mauritius, Mexico, The quantities of each product group (e.g. WMP,
Mongolia, Myanmar, Netherlands, Nigeria, Oman, whole milk powder) placed on sale are determined
Pakistan, Peru, Philippines, Saudi Arabia, Senegal, by the quantities the seller offered to sell. However,
Seychelles, Singapore, Sri Lanka, Syria, Taiwan, within each product group there are a number of
Thailand, UAE, Vietnam, Yemen, Zambia, product specifications (e.g. Regular WMP, Instant
Zimbabwe. WMP, UHT WMP). The quantities sold of these
specifications are determined by the pattern of
3. How does the bidding mechanism work? bidding demand subject to the rule that total
The process is an ascending price clock auction. quantity across the specifications must not exceed
The trading event is managed by an independent the product group quantity.
trading manager – Fonterra is not involved in
running the event itself. Bidders bid through 7. Usually, how much does the actual offer
volumes, not price. Fonterra offers a certain differ from the forecast offer you publish
amount of product at a pre-specified starting price some months in advance?
(always 15% below the closing price of the The offer quantity in a trading event is generally
previous event) and customers start bidding, round within 10–15% of the quantity forecast at the
after round. In the beginning, the volumes previous event. But the root mean square error on
customers would like to purchase at the starting forecasts three months ahead is around 20–25%.
price will be much higher than what Fonterra is
putting on sale. In the following rounds, the 8. On what contracts and delivery agreements
trading manager increases the price, and customers can bidders buy?
can bid again for a certain amount of product at Sales are all on FAS basis – Fonterra Arranges
the new price. All bidders bid at the same price. Shipping. When bidders buy, they can choose
During the event, prices increase and volume among three different contracts: for the product to
demand decreases. The event finishes when the be delivered in 3, 6 or 9 months. Customers can
amount bidders want to purchase equals the bid on any or all of the contract periods.
amount Fonterra wants to sell. All bidders pay
the final price.
European Food and Agribusiness Seminar 17Fonterra – Dairy Partner to the World
Appendix 1 Questions and Answers on GDT, continued
Figure 1. Bid submission page on GlobalDairyTrade website
Source: Fonterra materials; the image is property of CRA International, Charles River Associates – all rights reserved
18 European Food and Agribusiness SeminarFonterra – Dairy Partner to the World
Appendix 2 Forecast offer quantities for selected GDT products
Anhydrous milk fat (AMF)
4,000
3,500
3,000
2,500
MT
2,000
1,500
1,000
500
0
1
1
1
1
11
11
1
1
1
2
12
2
r-1
-1
n-1
l-1
t-1
v-1
-1
n-1
-1
g-
p-
b-
ay
c
ar
Ju
Oc
Ap
No
Ju
Ja
De
Se
Fe
Au
M
M
Butter milk powder (BMP)
1,000
900
800
700
600
MT
500
400
300
200
100
0
1
1
1
1
11
11
1
1
11
2
2
2
-1
-1
-1
l-1
t-1
v-1
-1
-1
-1
g-
p-
c-
r
ay
n
n
b
ar
Ju
Oc
Ap
No
Ju
Ja
De
Se
Fe
Au
M
M
Contract 1 Contract 2 Contract 3
Skim milk powder (SMP)
8,000
7,000
6,000
5,000
MT
4,000
3,000
2,000
1,000
0
1
1
1
1
11
11
1
1
11
2
2
2
r-1
-1
n-1
l-1
t-1
v-1
n-1
-1
-1
g-
p-
c-
ay
b
ar
Ju
Oc
Ap
No
Ju
Ja
De
Se
Fe
Au
M
M
Whole milk powder (WMP)
30,000
European Food and Agribusiness Seminar 19
25,000
20,000500
400
300
Fonterra – Dairy Partner to the World
200
100
0
1
1
1
1
11
11
1
1
11
2
12
2
r-1
-1
-1
l-1
t-1
-1
-1
-1
g-
p-
c-
b-
ay
n
v
n
ar
Ju
Oc
Ap
No
Ju
Ja
De
Se
Fe
Au
M
M
Appendix 2
Forecast offer quantities
Contract 1
for selected Contract
Contract 2
GDT 3products,
continued
Skim milk powder (SMP)
8,000
7,000
6,000
5,000
MT
4,000
3,000
2,000
1,000
0
1
1
1
1
11
11
1
1
11
2
12
2
-1
-1
-1
l-1
t-1
v-1
n-1
-1
g-
p-
c-
b-
r
ay
n
ar
Ju
Oc
Ap
No
Ju
Ja
De
Se
Fe
Au
M
M
Whole milk powder (WMP)
30,000
25,000
20,000
15,000
MT
10,000
5,000
0
1
1
1
1
11
11
1
1
1
2
12
2
r-1
-1
n-1
l-1
t-1
v-1
1
n-1
-1
g-
p-
c-
b-
ay
ar
Ju
Oc
Ap
No
Ju
Ja
De
Se
Fe
Au
M
M
Contract 1 Contract 2 Contract 3
All forecast offer quantities in MT (metric tons)
Source: GlobalDairyTrade
20 European Food and Agribusiness SeminarFonterra – Dairy Partner to the World
Appendix 3 Forecast annual supply – all GDT products
700,000
600,000
500,000
MT*
400,000
300,000
Twice
200,000 SMP monthly
3 WMP *AU WMP AMF introduced BMP
events
100,000 products introduced introduced introduced
0
Jul-08
Sep-08
Nov-08
Jan-09
Mar-09
May-09
Jul-09
Sep-09
Nov-09
Jan-10
Mar-10
May-10
Jul-10
1-Sep-10
5-Oct-10
2-Nov-10
1-Dec-10
4-Jan-11
1-Feb-11
1-Mar-11
5-Apr-11
WMP AMF SMP BMP MPC RenCas
* metric tons
** Australia
WMP: whole milk powder; AMF: anhydrous milk fat; SMP: skim milk powder; BMP: butter milk powder; MPC: milk protein
concentrate; RenCas: rennet casein
Source: GlobalDairyTrade
Appendix 4 Price movements for major commodities
300 1,600
1,400
250
1,200
200
1,000 GDT-TWI index
Price index
150 800
600
100
400
50
200
– 0
8
8
09
8
08
0
9
0
8
9
0
9
1
8
09
0
9
10
0
-0
v-0
-0
-1
-0
-1
n-0
v-0
l-1
-0
n-1
l-0
-1
-0
v-1
p-
p-
ay
ar
l-
n
ar
ar
p-
ay
ay
n
Ju
Ju
Ju
No
Se
Ja
Se
No
Ja
Ja
Ja
No
M
Se
M
M
M
M
M
Commodity food price index Crude oil (petroleum), Brent Soybean meal
Sugar and cocoa, free market Wheat GDT-TWI index
Commodity food price index 2005 = 100; includes cereals, vegetable oils, meat, seafood, sugar, bananas, and orange price indices
Crude oil (petroleum); dated Brent, USD per barrel
Soybean meal, Chicago soybean meal futures (first contract forward), minimum 48 percent protein, USD per metric ton
Sugar, free Market, Coffee Sugar and Cocoa Exchange (CSCE) contract no.11 nearest future position, US cents per pound
Wheat, No.1 Hard Red Winter, ordinary protein, FOB Gulf of Mexico, USD per metric ton
GDT-TWI index (Global Dairy Trade Trade Weighted Index): percentage changes in prices discovered in a GDT trading event, weighted
on the basis of total international dairy product trade flows
Source: GlobalDairyTrade for GDT-TWI index, IMF for commodity prices indices
European Food and Agribusiness Seminar 21You can also read