Fonterra Interim Report 2019 - AWS
←
→
Page content transcription
If your browser does not render page correctly, please read the page content below

Fonterra Interim Report 2019

XXX

      CONTENTS

      Letter from the Chairman       02

      Letter from the CEO            04

      Our Farmers                    06

      Our Potential                  08

      Our Performance                10
      Group financial metrics        10
      Ingredients                    16
      Consumer and Foodservice       18
      China Farms                    22
      Historical financial summary   24
      Interim Financial Results      32
Fonterra uses several non-GAAP measures when discussing financial               These measures are not uniformly defined or utilised by all companies.
performance. These measures include normalised segment earnings,                Accordingly, these measures may not be comparable with similarly titled
normalised EBIT, EBIT, normalisation adjustments and payout. These are          measures used by other companies. Non-GAAP financial measures should
non-GAAP financial measures and are not defined by NZ IFRS. Management          not be viewed in isolation nor considered as a substitute for measures
believes that these measures provide useful information as they provide         reported in accordance with NZ IFRS. These non-GAAP measures are not
valuable insight on the underlying performance of the business. They are used   subject to audit unless they are included in Fonterra’s annual financial
internally to evaluate the underlying performance of business units and to      statements.
analyse trends.
                                                                                Please refer to page 56 for the reconciliation of the NZ IFRS measures to the
                                                                                non-GAAP measures and page 57 for definitions of the non-GAAP measures
                                                                                used by Fonterra.
LETTER FROM THE CHAIRMAN

Earnings performance a
clear signal that fundamental
change is needed
John Monaghan
      Chairman

 Our rising forecast Farmgate Milk Price reflects a global            Interim financial results and interim
 export market in which we expect demand to remain                    dividend decision
 stronger relative to supply for the rest of the season. It is
                                                                      At a range of $6.30-$6.60 per kgMS, our forecast Farmgate
 welcome relief for our farmers who have faced difficult
                                                                      Milk Price is strong but the Co-op’s earnings performance is
 conditions since the start of the year.
                                                                      not where it needs to be.
 Global supply, while still up on last season, has slowed due
                                                                      As announced in February, our forecast earnings per share
 to challenging weather conditions in some of the world’s
                                                                      range is down at 15-25 cents and we have decided there will
 largest milk producing regions. It’s a similar story here in
                                                                      be no interim dividend payment. A decision on any full year
 New Zealand where recent hot, dry weather means our
                                                                      dividend will be made once the Board has a complete picture
 forecast milk collections are down on earlier expectations at
                                                                      of the full year earnings and balance sheet position.
 1,510 million kgMS, up just 0.3% on last year.
                                                                      Our performance is not something that will be fixed
 Stronger global demand, being driven predominantly by
                                                                      overnight. It will require the courage to make difficult
 China and Asia, has seen an upward trend in global prices
                                                                      decisions and a culture of accountability and performance
 for our reference products over the last quarter. That is
                                                                      right across the organisation.
 putting pressure on the margins for non-reference products,
 and they significantly contribute to our earnings.                   Farmers and unit holders expect a respectable return on
                                                                      their investment and your Board is making solid progress on
 Alongside those input prices, three main pressure points on
                                                                      a fundamental review of the business strategy to deliver it.
 our earnings have remained constant across the first half of
 the year – challenges in our Australian Ingredients business,
                                                                      New leadership
 in our Foodservice businesses in Greater China where
 higher butter prices and inventories slowed demand, and              As I’ve said, our performance is not something that will be
 the impact of global geopolitical issues – particularly in our       fixed overnight. However, the Board has been impressed by
 markets in Latin America.                                            Miles Hurrell’s leadership and commercial skills since he took
                                                                      up the role of interim CEO in August last year. Our decision
                                                                      to appoint Miles as the permanent CEO was a clear one.

 Strategy timeline
     Vision + Purpose

     Portfolio Review

                        Strategy Review              Progress update in May                             Full Strategy Announced
                        Kick off in January         (MyConnect conference and Q3 business update)       at 2019 Annual Results

 02              FONTERRA INTERIM REPORT 2019
His work alongside the Board as we progress our full strategy
review, and the portfolio review we began back in late 2018 to        Key numbers
re-evaluate our investments, major assets and partnerships,
make him uniquely qualified to be our CEO. His permanent              Forecast Farmgate Milk Price range 2018/2019 season
appointment will bring much needed continuity and stability
to the Co-op during this critical period of change.

Full strategy review
                                                                      $ 6.30- 6.60           $                  per
                                                                                                                kgMS
The Board is progressing well with a full review of the Co-op’s
                                                                      New Zealand milk collection for the 2018/2019 season
business strategy. This isn’t mere tinkering around the edges.

                                                                      1,510mkgMS
There will be fundamental change. We are taking a hard look at
our end-to-end business, where we can win in the world, and
the products where we have a real competitive advantage.                                                        0.3%
Our Co-operative values of the last 148 years won’t change.
Your quality, pasture-based milk will always be collected,
processed and sold for the highest possible returns. You’ll           Strategic review
always be paid on the 20th of the month – every month.
Outside of that, there are no sacred cows. The business
                                                                      – emerging themes
strategies designed to secure the highest possible returns
will change, but some underlying principles will remain.                             A globally competitive
The emerging themes from the strategic review are listed in                          New Zealand dairy Co-op.
full to the right, but there are a few worth calling out.
Sustainability must be at the core of everything we do. Healthy,
strong communities and environments underpin sustainable,
                                                                                     Sustainability at the heart
profitable dairy farming. We have shown our ability to adapt
farm management systems to work within increasingly                                  of everything we do.
stringent rules and still contribute to healthy lifestyles and a
healthy economy. But more will be required.
Our future is a farming system that uses advancements in
technology and innovation, including adaptations from other                          Value rather than volume.
industries, to help protect or enhance the premium qualities
and reputation of our milk.
We are a New Zealand dairy farmers’ Co-op. Maximising the
value of our home milk supply will always be our number                              Prioritise our New Zealand
one priority. We believe there’s a premium to be earned from                         milk supply and earn a
products backed by our co-operative heritage and provenance,                         premium from our heritage
supplemented by offshore milk components where required to
meet demand.
                                                                                     and provenance.
Our portfolio review has given us the information we need to
simplify our business and concentrate on getting the basics                          Simplify our global portfolio
right. We are already simplifying our portfolio of investments
                                                                                     to focus on where we have
back to those that target higher value. Within that, there is still
an important role for our base ingredients products where we                         competitive advantage.
already have a competitive advantage.
Achieving our ambition will rely on us maintaining premium
quality right across the supply chain. It starts on farm and flows                   Increase focus on return
through to the premiumisation of the products we make, and                           on capital.
the type of customers we sell to.
It sounds simple. Experience tells us that the best strategies
often are.

John Monaghan
Fonterra Chairman
                                                                                 FONTERRA INTERIM REPORT 2019   03
LETTER FROM THE CEO

Resetting the
business
Chief Executive Officer
         Miles Hurrell

  We are taking the right steps in the three-point plan        The second measure is to get the basics right and
  to turn our business around. What these interim results      lift the level of financial discipline in the Co-op. This
  show is that more is clearly needed to increase our          is about living within our means. We’re on track to
  earnings and ensure they’re sustainable. This requires       meet our capital expenditure target of $650 million –
  a fundamental reset of the business.                         over $200 million less than last year – and the tide is
                                                               turning on our normalised operating expenses which
  I want to update you on our progress on the three-
                                                               we have reduced by $31 million compared to the first
  point plan, share our half year results and let you know
                                                               half of last year.
  our priorities for the rest of the year, which are focused
  on the reset.                                                The third measure is to ensure more accurate
                                                               forecasting. Our industry is one of the most volatile
  Three-point plan                                             in the world and we are dealing with factors that have
  The first measure in our three-point plan is to take         a big impact on us but are not in our control – for
  stock of the business and re-evaluate every investment,      example, weather, political uncertainty in markets we
  major asset and partnership to ensure it still meets the     trade with, and the flow on effects of these factors
  needs of the Co-op. We also have a target to reduce our      on milk prices. We can’t predict these but we can
  debt by $800 million by the end of FY19, as previously       acknowledge them early and respond or adapt quickly.
  announced, and this is going to require us to divest some    This is why we’re now talking about ranges for our
  assets. We have identified three assets as no longer         forecast milk price. I also have a no-surprises policy and
  core to our business through our portfolio review. We        will quickly share all news, whether it’s good or bad.
  are in discussion with interested parties for Tip Top and
  DFE Pharma, and actively considering options for our         First half operating performance
  shareholding in Beingmate.                                   Coming from the loss we made last year, it is pleasing
                                                               to see we’re back in the black and have returned to
  I understand that we have strong ties with all our
                                                               profitability in the first half of FY19 with a reported
  businesses and the people who work in them. This is
                                                               Net Profit After Tax (NPAT) of $80 million.
  only natural for a Co-op with a strong heritage. But we
  need to ensure the Co-op is delivering financially for       However, we obviously have plenty more work to do
  farmers and their families, and unit holders. Right now,     with a normalised Earnings Before Interest and Tax
  this means making strategic decisions to let things          (EBIT) of $323 million, down 29% compared to the first
  go, get our debt down and focus on those assets that         half of last year. Our earnings performance at half year
  we can scale up and grow value from. We also need to         is not where it should be and this is why we reduced
  get comfortable with the idea of constant movement           our full year earnings guidance to 15-25 cents per share
  in and out of our asset portfolio because we need to         in February.
  continuously review our assets and ensure they are
  meeting the changing needs of the Co-op.

  04                      FONTERRA INTERIM REPORT 2019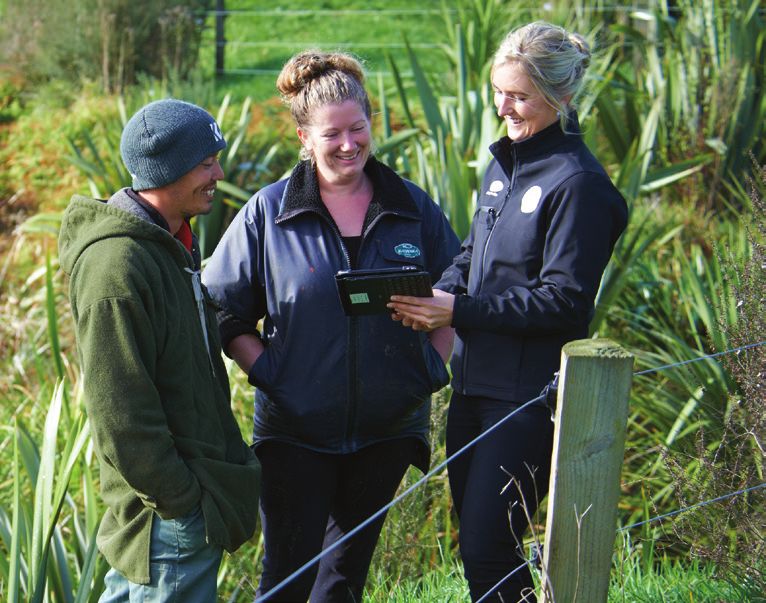
The steady performance of New Zealand Ingredients has
been offset by challenges in Australia Ingredients and this
                                                                 Key performance metrics
has seen our total Ingredients EBIT decline by 17% to $461
million. Our Australia Ingredients business continues to         Net Profit After Tax (NPAT)

                                                                     80m
feel the impact of the drought. We can see it clearly in
the decline of Australian milk collections, the aggressive
competition on milk prices, the underutilisation of assets
and tightening margins.
                                                                 $                                 123%
Consumer and Foodservice is tracking behind last year
with an EBIT of $134 million. This part of the business
                                                                 Normalised Earnings Before
has been held back by disruptive economic and                    Interest and Tax (EBIT)

                                                                 $   323m
geopolitical conditions in Latin America. In addition to                                            29%
this, demand slowed in China due to higher prices at
the end of FY18 and growing in-market inventory levels
for butter. Our performance in Sri Lanka was impacted
by price constraints.

Priorities for the second half
                                                                 Three-point plan
To increase our earnings and ensure they’re sustainable                    Take stock of our business
we’re going to have to work our existing assets harder and                 Three assets identified as
create more demand for our milk so we have more levers to                  no longer core to our business.
pull, especially when times are tough. I’m excited about the
reset of our business which is our focus for the second half               Reducing year end debt by
of FY19 and beyond.                                                        $800 million.
It will involve meeting our earnings guidance range of 15-25
cents per share. To shed some light on what it will take to
achieve the mid-point of this range, it assumes Ingredients                Get the basics right
has a slightly softer second half but there is a significant               Bringing our operating expenses
increase in Consumer and Foodservice earnings.                             back to FY17 levels over the next
                                                                           two years.
Our forecast increase in our Consumer and Foodservice
performance is based on a strong improvement in our                        Capital expenditure target for
Foodservice business, in Greater China in particular,                      FY19 set at $650 million, down
Brazil’s economy improving, which will support stronger                    from $861 million last year.
consumer demand for chilled dairy, and Sri Lanka’s price
environment improving.
The second half also involves delivering our three-point plan.             More accurate forecasting
We need to take these steps to firm up our foundations and                 Providing ranges for our forecast
strengthen our balance sheet.                                              Farmgate Milk Price.
But as I’ve already said it’s clear that more is needed
and the second half will also see us continuing the work
                                                                           Quickly sharing good news
on developing a new strategy to support the change
                                                                           and bad news.
in direction and accelerate the much-needed lift in our
performance. We need to simplify and improve the Co-op
so we can grow value.
Thank you for your ongoing support and commitment.
I am confident that together we can back each other
to deliver the Co-op’s full potential for the benefit of
generations to come.
I’m looking forward to leading this Co-op as we make
this happen.

Miles Hurrell
Chief Executive Officer

                                                                         FONTERRA INTERIM REPORT 2019     05
OUR FARMERS

Working for farmers
$21.3m
in Farm Source™ Reward Dollars,
discounts on everyday farming
supplies, and partnership deals
in the first half of the year.

             $7m
             earned in Reward Dollars.

             $8.5m
             saved by farmers through in store
             discounts on farming supplies.

             92                                                        Recognising farmers’
             Mazda vehicles were purchased with
             a combined discount of $1.3 million.                      good work
                                                                       With cross-country farmer workshops now complete,
                                                                       the Co-op is finalising a new programme set to begin
                                                                       for the 2019/2020 season that will recognise farmers
             $4.4m                                                     who go beyond the minimum standards to produce
                                                                       high-quality milk, care for their cows, protect the
             in partnership savings
                                                                       environment, empower their people and keep the
             on power and fuel.
                                                                       Co-op strong for generations to come.

                                                         369
                          Connecting
                          your Co-op
                          A further 90 farmers
                          attended the Understanding     more farms
                          Your Co-operative              now have Farm
                          programme in the first         Environment Plans
                          half of this year, expanding   (FEPs). This is in
                          their knowledge of the         addition to the 1, 011
                          Co-op’s global, national       farms that had FEPs
                          and local operations.          as at 31 July 2018.

06      FONTERRA INTERIM REPORT 2019
4,500
                                                                        farms
                                                                        have downloaded the
                                                                        new Dairy Diary app.

                                                                        90%
                                                                        More than 90% of farmers
                                                                        use our smartphone apps, and
                                                                        60% connect with the Co-op
                                                                        using more than one of our
                                                                        digital channels regularly.

Providing more
financial tools
Fixed Milk Price was introduced as
a new financial tool to help farmers
manage some of the risk they face from
unpredictable global milk prices. For the
2019/20 season, farmers will have the
opportunity to fix the price they receive
for a portion of their milk supply.

                                                                                               240
                                            26
                                            Sustainable
                                                                                               farmer events
                                                                                               were held across
                                                                                               the country.
                                            Dairying Advisors
                                            are now on the
                                            ground working
                                            one-on-one with
                                            farmers to help them
                                            make their farms
                                            more sustainable.

                                                                   FONTERRA INTERIM REPORT 2019       07
OUR POTENTIAL

Growing Demand
Around the globe, our teams are working
hard to maximise the value of New Zealand’s
milk for farmers and unitholders.
We’re a demand-led business, and we’re working to grow the
demand for higher-value products with New Zealand milk to
bring value to our Co-op and New Zealand communities. We
always prioritise New Zealand milk and where we can’t meet
a customer’s shopping list with this, we source it globally
through partnerships or establish new supply arrangements.

50
                       Nearly 50% growth in our Foodservice

     %
                       Beverage House Channel which captures
                       the rapid global expansion of dairy
                       beverage trends by putting high-value

growth
                       products like cream and cream cheese
                       right at the chef’s table. Off the back
                       of growth in China, we’ve launched
                       Beverage House in other key markets
                       across the wider Asia, the Middle
                       East and Africa region, and plans are
                       underway in USA and Chile.

6growth
                       In the first half of FY19 we

   %
                       achieved 6% growth in NZMP
                       sales volumes due to increased            Complementing
                       New Zealand milk collections,
                       availability of product and strong        diets
                       demand for powders in China and
                       South East Asia.                          We’ve taken a minor stake in
                                                                 Motif Ingredients, a US-based
                                                                 food ingredients company
                                                                 focused on developing and
                                                                 commercialising bio-engineered
                                                                 animal and plant ingredients.
                                                                 Dairy nutrition will always be at
                                                                 our core but exploring how we
                                                                 capture more value from new
                                                                 types of nutrition is a key part
                                                                 of our strategy to futureproof
                                                                 our Co-op.

                                                                   High growth in the
                                                                   ready-to-drink market
                                                                   We lifted our high-value milk protein concentrate
                                                                   sales in the United States as we teamed up with key
                                                                   customers experiencing high-growth in ready-to-drink
                                                                   beverages, such as sports drinks.

08         FONTERRA INTERIM REPORT 2019
Launching in India
The equivalent of more than 2 billion
glasses of milk are drunk in India every
day. That’s why we set up a joint venture
partnership with Future Consumer. We’re
looking forward to our first products hitting
shelves in India this year, in a market worth
$21 billion annually that’s forecast to grow
seven times faster than China.
A pack selling Driving high-value
every second demand
Our third mozzarella plant at
40% of Australian households
Clandeboye and new cream
use Western Star™. It’s one of the
cheese plant at Darfield are now
most popular brands in Australia,
up and running. We built these
with a pack selling every second.
plants to meet growing demand
It’s now worth over $200 million
for high-value products around
in retail sales per year.
the world, particularly in China.
Fresh Milk Clever engineering
in China to lift capacity
We launched a co-branded Thanks to some clever engineering at
Anchor™ premium fresh Hautapu, we expect to lift our Lactoferrin
milk range with global capacity by 10% to help meet a growing
supermarket Carrefour, demand in Asia for one of our highest value
following on from our products, commonly referred to as 'pink gold'.
successful Hema Daily range
with Alibaba. This year we’re
tapping into this growing
market by expanding our
fresh milk products to more
channels and customers,
straight from our China
Farms to consumers.
FONTERRA INTERIM REPORT 2019 09OUR PERFORMANCE
XXX HALF YEAR FINANCIAL METRICS
Group
Sales Volume (LME bn)1
Ingredients Consumer and Foodservice
financial 13.3
2.2
14.3
2.5
13.7
2.7
12.4
2.6
12.9
2.5
metrics 11.1
2015
11.8
2016
11.0
2017
9.8
2018
10.4
2019
These charts have been Normalised Gross Margin
selected to represent $ GM (millions) $ GM/LME
the half year financial 1,556
1,880
1,752 1,659
1,500
metrics for Fonterra. 0.16
0.15 0.15
Previously shared 0.13
0.14
full year metrics, for 2015 2016 2017 2018 2019
example Return on
Capital, will be shared
in our Annual Report. Normalised NPAT ($ millions)4
372 389
248
70 80
2015 2016 2017 2018 2019
Gearing (%)
52.5
51.6
50.7
49.2
46.6
2015 2016 2017 2018 2019
1 Does not add to total due to inter-group eliminations.
2 Represents total volumes in the period rather than
cumulative changes. It is not meaningful to report
on a cumulative change half year to half year basis.
10 FONTERRA INTERIM REPORT 2019Volume to Higher Value2 Reported Revenue ($ millions)
Advanced Ingredients (LME m) $ Operating Revenue $ Revenue/LME
Consumer and Foodservice (LME m)
As % of Total LMEs3 9,839
9,746 9,746
43% 44% 43% 9,241 0.94 0.91
39% 437
3,190 0.83 8,838
2%
3,123 2,987 3,064 0.79
0.70
2,249 2,483 2,711 2,546 2,483
2015 2016 2017 2018 2019 2015 2016 2017 2018 2019
Normalised OPEX Normalised EBIT
$ Normalised OPEX (millions) $ OPEX/LME $ EBIT (millions) $ EBIT/LME
665
1,306 1,305 607
1,263
458
376
1,232 1,232 323
0.12 0.12
0.05 0.05
0.11 0.11 0.04
0.10 0.03 0.03
2015 2016 2017 2018 2019 2015 2016 2017 2018 2019
Reported NPAT ($ millions)4 CAPEX5 ($ millions)
409 418
763
183
80
453
346 316
244
-348
2015 2016 2017 2018 2019 2015 2016 2017 2018 2019
Working Capital Days Free Cash Flow ($ millions)
87 346
77 80 82
68
-417
-690 -782
-1,761
2015 2016 2017 2018 2019 2015 2016 2017 2018 2019
3 Comprises Advanced Ingredients and Consumer 5 Capital expenditure comprises purchases of property
and Foodservice products. (less specific disposals where there is an obligation to
4 Includes non-controlling interests. repurchase), plant and equipment and intangible assets,
and net purchases of livestock.
FONTERRA INTERIM REPORT 2019 11OUR PERFORMANCE
Group Overview
We have a mixed set of results. The forecast
Farmgate Milk Price looks solid, and New Zealand
Ingredients and Consumer and Foodservice in
Oceania have performed steadily. However, this has
been offset by challenges in our offshore milk pools
and a slow start in our Latin America Consumer and
Greater China Foodservice businesses.
We have returned to profitability in the first half of FY19
SIX MONTHS ENDED
with a reported Net Profit After Tax (NPAT) of $80 million.
However, with normalised Earnings Before Interest and NZD MILLION 31 JAN 2019 31 JAN 2018 CHANGE1
Tax (EBIT) of $323 million, down 29% compared to the
Volume (LME, billion)2 10.7 10.5 2%
same period last year, our earnings performance at half
year is not where it needs to be. This has seen us reduce Volume (’000 MT)2 2,055 2,003 3%
our full year earnings guidance from 25-35 cents per share Normalised sales revenue3 9,746 9,836 (1%)
to 15-25 cents per share. Normalised gross margin3 1,500 1,659 (10%)
We have also decided not to pay an interim dividend. Normalised gross
The primary reason for this is that while we are focused margin percentage3 15% 17%
on reducing our debt and strengthening our balance Reported operating
sheet, it is appropriate that any dividend decisions are expenses (1,232) (1,864) (34%)
made with a complete picture of our full year earnings Normalised operating
and the outcome of our portfolio review, which will expenses3 (1,232) (1,263) (2%)
include the divestment of assets. Reported EBIT 323 (176) 284%
Normalised EBIT3 323 458 (29%)
1 Percentages as shown in table may not align to the calculation
of percentages based on numbers in the table due to rounding
Net finance costs (205) (201) 2%
of reported figures.
2 Represents total external sales. Tax (expense)/credit (38) 29 (230%)
3 There were no normalisation adjustments for the six months ended Net profit after tax4 80 (348) 123%
31 January 2019.
4 Includes non-controlling interests. Earnings per share (cents) 5 (22) 122%
5 Gearing ratio is calculated as economic net interest bearing debt Dividend per share (cents) – 10 (100%)
divided by total capital. Total Capital is equity excluding the hedge
reserves, plus economic net interest bearing debt. Gearing ratio5 53% 52%
6 Capital expenditure comprises purchases of property (less specific Free cash flow (782) (690) 13%
disposals where there is an obligation to repurchase), plant and
equipment and intangible assets, and net purchases of livestock. Capital expenditure6 316 346 (9%)
12 FONTERRA INTERIM REPORT 2019Net Profit After Tax (NPAT)
$ 80m 123%
Normalised EBIT
$ 323m 29%
Volume
10.7 b
LME 2%
FONTERRA INTERIM REPORT 2019 13OUR PERFORMANCE
Group Overview CONTINUED
Consistent with our seasonal milk collection profile in The increase in operating expenses seen in FY18 and
New Zealand, our production and inventory built in in the first quarter of FY19 has been reversed with our
the second quarter. This flowed through to strong sales normalised operating expenses down 2%. There is a
volumes which were up 2% to 10.7 billion Liquid Milk concerted effort right across the business to reduce
Equivalents (LMEs) for the first six months to 31 January costs and to date, significant reductions have been made
2019 compared to the same period last year. in selling and marketing costs, including a significant
reduction in corporate brand advertising and overheads.
The sales volume growth was driven by a 6% increase
in sales volume in Ingredients. However, Consumer and Our normalised EBIT of $323 million was down 29%
Foodservice sales volumes were down 2% to 2.5 billion compared to the same period last year.
LMEs which was mainly because of a 17% decrease in
While New Zealand Ingredients delivered a steady
Greater China Foodservice sales volume. This was due to
result, challenges in our offshore milk pools have caused
demand slowing at the end of the last quarter of FY18 and
Ingredients’ normalised EBIT to decrease 17% on last year
in-market inventory levels growing, especially for butter.
to $461 million.
The butter market corrected sharply in the first half of
FY19, and this has helped with clearing excess inventories. Our New Zealand Ingredients business manufactures
Butter shipments to China started again in the second five ingredient products that inform the Farmgate Milk
half of the year. Price range. These are referred to as reference products,
while all other products are referred to as non-reference
products. As the five reference products drive the
cost of milk used to make non-reference products, the
relative price differences and movements of the two
sets of products is an important contributor to our EBIT
performance. Their price relativities were favourable,
but less than the comparable period last year.
In Consumer and Foodservice, the challenges across Latin
America, Greater China and Sri Lanka have resulted in a
30% decline in Consumer and Foodservice normalised
EBIT to $134 million. Oceania was the only region to
report growth in normalised EBIT in Consumer and
Foodservice and this was driven by Australia’s strong
Our total normalised sales revenue declined 1% to $9.7 performance predominantly in butter sales to consumers.
billion despite the strong volume growth. In Ingredients,
Our China Farms reported a total loss of $21 million
normalised sales revenue was up 4% on the back of
which was flat on the same period last year. This is made
higher sales volume but overall prices were lower. In
up of a direct loss of $17 million, which is a 43% increase
Consumer and Foodservice, sales revenue was flat on last
in the loss on the first half of last year, a $5 million loss
year and despite higher product prices being achieved
in Ingredients and a $1 million profit in our Consumer
they were offset by lower sales volumes.
and Foodservice business. Continuous rainstorms and
Total normalised gross margin was $1.5 billion, down 10% floods in Yutian have impacted milk production and,
which is a $159 million decrease. Our Ingredients’ gross consequently, sales volumes from our China Farms so
margins were still strong at 10%, but less than the first half far this year. We’ve also incurred additional effluent and
of last year which was a strong performance. We also had animal management costs. Our Ingredients business is
pricing challenges in a number of markets which impacted responsible for purchasing the raw milk from China Farms
Consumer and Foodservice’s gross margin. For example, and selling it for the highest possible price. We have
in Latin America we experienced disruptive economic seen an improvement in the average price Ingredients
conditions combined with high input costs, in China higher has been selling this milk at but it is still less than what
butter prices and inventories at the end of FY18 slowed Ingredients buys it for. Our Consumer and Foodservice
demand, and in Sri Lanka we faced price constraints. business has continued to make small steps to capitalise
on China’s trend towards fresh milk with the launch of a
premium milk range with global supermarket Carrefour.
14 FONTERRA INTERIM REPORT 2019Our total reported EBIT has increased 284% to $323
million for the first six months of FY19. The significant Normalised operating expenses
1,232m
increase reflects the two large one-off items in FY18,
being the payment for the Danone arbitration award and
the Beingmate write-down, that significantly impacted $ 2%
our reported EBIT last year.
Economic net interest bearing debt and gearing are both
typically higher for the Co-operative at the end of the
first six months of the year, reflecting the seasonal profile
of our business. This usual scenario occurred in the first
half of FY19 too but we have not needed as much new
debt in the first half of this year compared to last year.
This is because the lower earnings were offset by reduced
capital expenditure and investments, and, furthermore,
we did not pay a final dividend for FY18, resulting in an
improved net cashflow by 16%.
We started the year with economic net interest bearing
debt at $6.2 billion, up 11% on the previous year’s $5.6
billion. As at 31 January 2019, economic net interest
bearing debt was $7.4 billion and our gearing ratio is 53%.
This is up 0.9% on the same period last year and is due
to the higher debt at the start of the year as opposed
to us needing greater levels of debt during the first half.
We continue to be committed to our target end of year
gearing range of 40-45% and achieving this will require
receiving sale proceeds from the asset sales being
progressed under our portfolio review.
Our working capital days have increased by two days to
82 days, mainly due to higher inventory levels following
the increased collections. This is considered a temporary
increase as we are seeing continuing strong demand for
our Ingredients’ products in the second half of the year.
There is a reduction in the level of capital expenditure
on larger projects this year, which is consistent with
the strong focus on financial discipline and keeping our
capital expenditure within our $650 million target for the
year. This is forecast to be more than $200 million down
on last year. We are on track to meet our target with
capital expenditure sitting at $316 million at half year
and 9% down on the same time last year.
FONTERRA ANNUAL REPORT 2019 15OUR PERFORMANCE
Ingredients
Our sales volumes in Ingredients were 10.4 billion LMEs, up
6% in the first half of FY19 compared to the same period last
year, but normalised EBIT declined 17% to $461 million.
We saw Australia Ingredients’ gross margin decline
significantly due to drought conditions, declining milk
collections and high milk prices. This was in addition to
tightening margins in New Zealand Ingredients.
Volume
Ingredients Performance
Sales volumes in New Zealand Ingredients were up.
SIX MONTHS ENDED This was supported by strong collections for the first
NZD MILLION 31 JAN 2019 31 JAN 2018 CHANGE1 half of the 2018/19 milk season, which were up 5% on
last year to 1,083 million kgMS.
Volume (LME, billion) 10.4 9.8 6%
In Australia, our sales volumes were also up mainly due
Volume (’000 MT) 1,556 1,441 8%
to strong opening inventory levels. However, sales were
Normalised sales revenue2 8,196 7,903 4% constrained due to the 16% decline in milk collections
Normalised total to 83 million kgMS for the first half of the year. The
gross margin2 791 871 (9%) Australian dairy industry, including our business, is
experiencing a heavy decline in milk collections due
– New Zealand Ingredients 669 734 (9%) to severe drought conditions.
Reference products 345 372 (7%)
In Latin America, Prolesur’s milk collections were down 9%
Non-reference products 324 362 (10%) due to strong competition for farmers’ milk. In China, our
– Australia Ingredients 6 50 (87%) Ingredients business bought 15% less milk from our China
– China raw milk 3
(5) (9) Farms due to lower milk production. This flowed through to
smaller sales volumes from both these offshore milk pools
– Other gross margin 121 96 26% in the first half compared to the same period last year.
Normalised EBIT4 461 558 (17%)
Despite the challenges in our offshore milk pools, total
Gross margin ($ per MT) –
Ingredients sales volumes were 10.4 billion LME, up 6%
New Zealand Ingredients
compared to the same period last year. This was due to
Reference products
the increased New Zealand milk collections and hence
($ per MT) 373 413 (10%)
availability of product combined with strong demand for
Non-reference products
powders in China and South-East Asia.
($ per MT) 915 1,309 (30%)
The increase in sales volumes has flowed through to $8,196
1 Percentages as shown in table may not align to the calculation million of revenue in the first half, up 4% or $290 million
of percentages based on numbers in the table due to rounding
of reported figures.
on the same period last year.
2 There were no normalisation adjustments for the six months ended At the end of the first half our inventory levels were up
31 January 2019.
47,000 metric tonnes on last year to 943,000 metric
3 China raw milk gross margin represents the net benefit/(loss) from the
external sales of milk produced by China Farms and sold to the Ingredients tonnes primarily due to the higher milk collections.
business in China at an internal raw milk price.
4 Normalised EBIT for Ingredients excludes unallocated costs. There were
no normalisation adjustments for the six months ended 31 January 2019.
16 FONTERRA INTERIM REPORT 2019Value
Normalised Sales Revenue
Overall Ingredients’ normalised gross margin for the first
half was $791 million, down 9% on the first half of FY18.
Total Ingredients' EBIT was $461 million, down 17% or $97
million on the same period last year.
Our New Zealand Ingredients business manufactures five
$ 8,196m 4%
ingredient products that inform the Farmgate Milk Price Normalised Total Gross Margin
range. These are referred to as reference products, while all
$791m
other products are referred to as non-reference products. 9%
As the five reference products are used to price the milk
used to make non-reference products, the relative price
differences and movements of the two sets of products is
an important contributor to EBIT performance.
New Zealand Ingredientsʼ Gross Margin
$ 669m
Although still strong, New Zealand Ingredients’ gross
margin declined 9% in the first half to $669 million. The 9%
gross margin on our reference products was $345 million,
down 7% on the first half of last year. However, the main
contributor to the overall gross margin decline was the
reduced margin in our non-reference products to $324 Australia Ingredientsʼ Gross Margin
million, down 10%. This was because of a number of
factors: the increased conversion costs, associated with
bringing new plants online; additional costs of processing
larger volumes of milk; and the reference product prices
$ 6m 87%
declining less than non-reference product prices.
Our Australia Ingredients business had a difficult first
half with gross margins down 87% from $50 million to $6 New Zealand Ingredients’ Revenue
million. We have continued to increase our milk price in and Volume1
response to the market and in February we announced SIX MONTHS ENDED
an increase in the milk price to AUD$6.05. Lower milk
NZD MILLION 31 JAN 2019 31 JAN 2018 CHANGE2
collections meant some factories have been underutilised.
In addition to the higher milk prices, this has increased our Production Volume (’000 MT)
cost of goods and significantly impacted gross margins. Reference
In January we repurchased a 51% share in the Darnum products 1,346 1,266 6%
factory in Australia from Beingmate. We structured the Non-reference
transaction to ensure we did not pay any cash up front products 485 483 0%
and have entered into a multi-year supply contract for
Sales Volume (’000 MT)3
Beingmate to purchase ingredients from us. By taking full
control of Darnum, we will now be able to look for new Reference
products 924 900 3%
partners, improve efficiencies and produce the product mix
that creates the greatest value. However, in the meantime, Non-reference
products 354 277 28%
we need to recover all Darnum’s fixed costs and, in the first
half of this year, this was an additional $11.3 million. Revenue Per MT (NZD)3
Our Ingredients’ gross margin was also impacted by a Reference
$5 million loss in the first half representing the difference products 4,658 4,783 (3%)
between the domestic milk price and the internal raw milk Non-reference
price paid to China Farms. This is a 44% improvement on products 5,294 5,726 (8%)
the first half of last year and reflects a strengthening of
1 Figures exclude bulk liquid milk. The bulk liquid milk for the
the domestic milk price. We include the China Farms’ sales six months ended 31 January 2019 was 34,000 MT (six months
volumes and earnings in Ingredients as we use our sales ended 31 January 2018 was 34,000 MT).
expertise to maximise sales revenue of the raw milk, 2 Percentages as shown in table may not align to the calculation
of percentages based on numbers in the table due to rounding
leaving China Farms to focus on efficient milk production. of reported figures.
Margins in “Other gross margin” were up 26% in the first 3 The way in which Ingredients presents certain inter-segment
sales between Ingredients and Foodservice was revised in
half to $121 million. The main contributor was an increase in FY19. This increased sales volumes for the six months ended
the profitability of our globally sourced products. 31 January 2019 by 4,000 MT and 79,000 MT on reference
and non-reference products respectively, and increased sales
revenue by $34 million and $360 million on reference and non-
reference products respectively. This change had no impact
to the reported gross margin for the Ingredients business.
FONTERRA INTERIM REPORT 2019 17OUR PERFORMANCE
Consumer and Foodservice
After three years of growth, our Consumer and Foodservice
business had a slower start in the first half of this year with both
volumes and earnings down due to market-specific challenges.
In particular, disruptive economic conditions and high input
costs in Latin America, demand slowing due to higher prices
at the end of FY18 and in-market inventory levels growing for
butter in China, and price constraints in Sri Lanka.
Overall Consumer and Foodservice volumes were down Our gross margin decreased by 7% to $766 million and
2% to 2,487 million LMEs but Oceania sales volumes were our normalised EBIT decreased by 30% to $134 million due
up 3% on last year. Total revenue was flat on last year at to a combination of price competition and the economic
$3,470 million with Oceania and Asia revenues up 2% and conditions in various markets. We reduced Consumer and
3%, respectively, and Greater China and Latin America Foodservice’s operating expenses by $1 million despite
down 6% and 1%, respectively. additional sales, storage and distribution costs.
Consumer and Foodservice Performance Normalised EBIT: Key performance drivers
SIX MONTHS ENDED SIX MONTHS ENDED
NZD MILLION 31 JAN 2019 31 JAN 2018 CHANGE1 NZD MILLION 31 JAN 2019 31 JAN 2018
Volume (LME, billion) 2.5 2.6 (2%) Normalised EBIT prior year 193 313
– Consumer 1.5 1.4 4% – Volume 10 (20)
– Foodservice 1.0 1.1 (11%) – Price (49) 301
Volume (’000 MT) 888 877 1% – Cost of goods sold (18) (420)
Sales revenue 3,470 3,473 0% – Operating expenses 1 4
Gross margin 766 821 (7%) – Other 1
(3) 15
Gross margin percentage 22% 24% – Normalised EBIT2 134 193
– Consumer 25% 27% – 1 Includes net other operating income, net foreign exchange gains/losses
and share of profit/loss of equity-accounted investees.
– Foodservice 16% 17% –
2 There were no normalisation adjustments for the six months ended
Normalised EBIT2 134 193 (30%) 31 January 2019.
1 Percentages as shown in table may not align to the calculation
of percentages based on numbers in the table due to rounding
of reported figures.
2 There were no normalisation adjustments for the six months ended
31 January 2019.
18 FONTERRA INTERIM REPORT 2019By region
Greater China Greater China Normalised EBIT
$ 61m
Greater China sales volumes were down 13% to 524 million
LMEs in the first half compared to the same period last year
34%
and normalised EBIT was $61 million, down 34%. The main
reason for this was a 17% decrease in Foodservice volumes
due to demand slowing at the end of the last quarter of FY18
and in-market inventory levels growing, especially for butter. Latin America Normalised EBIT
The butter market corrected sharply in the first half of
($ 3m)
FY19, clearing excess inventories and enabling China butter
shipments to resume in the second half of the year.
111%
Foodservice’s gross margins were down 21% to $85 million
in the first half of last year. While gross margins were down
for butter, Anchor Food Professionals UHT culinary cream
range and mozzarella continued to perform well.
Consumer gross margins were up 4% to $77 million. This
was mainly due to the lift in margin percentage we have
achieved on Anchor™ UHT and, since bringing it back in
house, Anmum™ in Mainland China. Consumer volumes
were also up 29% to 81 million LMEs. Two consumer
products now hold number one position, based on market
share, in their categories: Anchor™ UHT skim milk and
Anchor™ UHT milk.
Latin America
At the EBIT level, we made a loss of $3 million in Latin
America in the first half. Our sales volumes were up 5%
to 388 million LMEs compared to the same period last
year and gross margin was down 16% to $185 million.
While we grew Soprole sales volumes, we saw a decrease
in Soprole’s gross margins, following a ‘buy local’ marketing
campaign, which impacted the sales of a number of foreign
owned companies, including our own. An increase in milk
input costs in Brazil due to its weak, but now improving,
economy also impacted our gross margin. Brazil was able
to offset some of its gross margin challenges with supply
chain savings.
In Venezuela, volumes were down due to the challenging
socio-economic situation which is restricting consumers’
ability to access basic goods and services, including dairy
products. There are also difficulties accessing the raw
ingredients and packaging materials to run our factories.
This impacted our gross margins.
FONTERRA INTERIM REPORT 2019 19OUR PERFORMANCE
Consumer and Foodservice CONTINUED
Consumer and Foodservice Regional Performance
LME (BILLION) NORMALISED EBIT ($M)1
SIX MONTHS ENDED 31 JAN 2019 31 JAN 2018 CHANGE2 31 JAN 2019 31 JAN 2018 CHANGE2
Consumer and Foodservice 2.5 2.6 (2%) 134 193 (30%)
Greater China 0.5 0.6 (13%) 61 92 (34%)
Asia 0.7 0.8 (4%) 44 56 (22%)
Latin America 0.4 0.4 5% (3) 30 (111%)
Oceania 0.8 0.8 3% 32 15 110%
1 There were no normalisation adjustments for the six months ended 31 January 2019.
2 Percentages as shown in table may not align to the calculation of percentages based on numbers in the table due to rounding of reported figures.
Asia Oceania
Asia’s normalised EBIT was $44 million in the first We improved our performance in Oceania and delivered a
half, down 22% on the same period last year. Political normalised EBIT of $32 million in the first half, up 110% on
uncertainty in Sri Lanka dampened the overall performance last year. Sales volumes in Oceania were also up 3% to 843
in Asia, where ongoing price constraints and weakened million LMEs on same period last year. Earnings were up in
currency eroded gross margins by 22%. Our sales volumes both Consumer and Foodservice, mainly led by Australia.
in Asia were also down 4% to 733 million LMEs in the first
In our Consumer business, gross margin increased by
half. This was due to a 16% drop in Foodservice volumes as
2% to $171 million. In Australia, increased demand, new
a result of high levels of inventory already in the markets
business and strategic cost management all helped to drive
following our strong volume sales into the region at the end
growth. Australia’s Consumer volumes grew across all core
of last year.
categories with market share of 26% in chilled spreads
We grew our Asia consumer business by 5% to 461 million and 19% in cheese. Western Star butter and spreads is
LMEs. While gross margins were down 3%, Asia continued performing strongly, reaching an annualised retail sales
to be a profitable region. The exit of a key competitor in value of over $200 million.
Singapore and Malaysia helped Fernleaf™ increase its
In Foodservice, our margins were up 15% to $47 million,
market share in powders, leading gross margins to double
with strong results from our Australian business.
on the back of better pricing. Malaysia performed well with
Consumer continuing to perform strongly and saw strong While our operational performance in New Zealand
growth in adult milk and growth in Anmum™ Essential. continues to improve, increased competition in cheese
and yoghurt has seen our market share decline in these
Gross margins in Asia Foodservice were down 13%. This
categories. New Zealand Consumer and Foodservice was
was due to product mix and absorbing higher input costs
flat with strong competition impacting volumes but this
to defend market share in Vietnam and Thailand.
was offset by continued improvements in our operational
performance and pricing strategies.
20 FONTERRA INTERIM REPORT 2019Asia Normalised EBIT
$ 44m 22%
Oceania Normalised EBIT
$ 32m 110%
FONTERRA INTERIM REPORT 2019 21OUR PERFORMANCE
China Farms
Our seven farms across two hubs are producing
premium fresh milk for the China ingredients,
foodservice and consumer markets. In the first
six months of FY19 domestic milk prices have
improved and 40% of our milk volumes sold for
more than 4RMB versus 17% in FY18.
Volume Value
We milk more than 31,000 cows on our farming China Farms reported total losses of $21 million EBIT,
operations in China on two farm hubs – around 17,000 flat on the first half of last year. This is made up of a
at Yutian and around 14,000 at Ying. $17 million direct loss from China Farms, a further
$5 million loss in Ingredients and a $1 million profit
Sales volumes were down 15% to 113 million LMEs in the
in Consumer and Foodservice.
first half of this year compared to the same period last
year. One of the factors contributing to this result was The reasons for the loss from the farms, which is a 43%
the continuous rainstorms and floods in Yutian, which increase on the loss in the first half of last year, are lower
reduced milk production and increased the cost of feed. production volumes, additional effluent and animal
management costs, and increasing feed commodity prices
Our plan is to shift more milk from our China Farms into
due to trade disputes between China and the US. Several
our higher-value products. We have a target of 15% of our
initiatives to drive efficiencies on-farm and reduce our cost
milk volume going into consumer brands and foodservice
base, including our award-winning Eco-Win programme,
products this financial year, up from 5% in FY18.
cost controls, and feed procurement efficiencies, in
combination with our seasonal lift in production, will
improve performance in the second half.
Our Ingredients business is responsible for purchasing the
raw milk from China Farms and selling it. We have seen an
improvement in the average price Ingredients has been
achieving for this milk. This has seen our loss from China
Farms in Ingredients improve by $4 million. The loss in the
first half for Ingredients was $5 million.
Having farms in China means we can supply premium
fresh milk to customers like Alibaba's Hema Fresh which
stocks our Daily Fresh milk range. We continue to look
for new opportunities and have launched a new Anchor
co-branded fresh milk product with Carrefour in
November, our second consumer fresh product in China.
The product is sold in all 31 Carrefour hypermarkets across
Shanghai and thanks to strong sales was ranked the
number two fresh milk in the last quarter.
22 FONTERRA INTERIM REPORT 2019Launched our second
premium fresh milk range
with global supermarket
Carrefour in 31 stores
across Shanghai.
Volume
113 m
LME
15%
SIX MONTHS ENDED
NZD MILLION 31 JAN 2019 31 JAN 2018 CHANGE1
Volume
(LME, billion) 0.1 0.1 (15%)
Volume
(’000 MT) 9 10 (13%)
Sales
revenue 108 123 (12%)
Normalised
EBIT2 (17) (12) (43%)
1 Percentages as shown in table may not align to the calculation
of percentages based on numbers in the table due to rounding
of reported figures.
2 There were no normalisation adjustments for the six months
ended 31 January 2019.
FONTERRA INTERIM REPORT 2019 23OUR PERFORMANCE
Historical Financial Summary
Commodity Prices
JAN 2019 JAN 2018 JAN 2017 JAN 2016 JAN 2015
Weighted average commodity prices ($ USD per MT FOB)
Whole Milk Powder1 2,845 3,087 2,580 2,064 2,813
Skim Milk Powder 1
2,050 2,000 2,135 1,758 2,826
Butter 1
4,460 5,879 3,434 2,731 2,899
Cheese 2
3,522 3,897 3,554 3,088 3,931
Group Overview 3
JAN 2019 JAN 2018 JAN 2017 JAN 2016 JAN 2015
Income
Volume (liquid milk equivalents, billion) 10.67 10.45 11.71 12.59 11.70
Volume (000s MT) 2,055 2,003 2,131 2,324 2,189
Normalised sales revenue ($ million) 9,746 9,836 9,232 8,838 9,746
Normalised EBITDA ($ million) 4
607 733 896 951 659
Normalised earnings ($ million) 5
323 458 607 665 376
Normalised NPAT ($ million) 6
76 242 384 367 52
Reported earnings per share 0.05 (0.22) 0.26 0.25 0.10
Normalised earnings per share 0.05 0.15 0.24 0.23 0.03
Revenue Margin Analysis7
EBITDA8 6.2% 7.4% 9.7% 10.8% 6.8%
EBIT9
3.3% 4.7% 6.6% 7.5% 3.9%
NPAT 10
0.8% 2.5% 4.2% 4.2% 0.5%
Cash flow ($ million)
Operating cash flow11 (612) (292) (167) 924 (1,014)
Free cash flow (782) (690) (417) 346 (1,761)
Net working capital 12
5,451 5,356 4,838 4,623 5,378
Capital Measures
Equity excluding hedge reserve ($ million) 6,643 6,624 7,005 7,137 6,937
Economic net interest-bearing debt ($ million)13 7,352 7,060 6,115 6,908 7,134
Economic debt to debt plus equity ratio14 52.5% 51.6% 46.6% 49.2% 50.7%
Capex ($ million) 15
316 346 244 453 763
24 FONTERRA INTERIM REPORT 2019Ingredients 3, 16
JAN 2019 JAN 2018 JAN 2017
Sales Volume (000 MT)17
Reference Products 924 900 973
Non-reference Products 354 277 338
Revenue ($/MT) 17
Reference Products 4,658 4,783 3,873
Non-reference Products 5,294 5,726 5,201
Gross Margin ($/MT)
Reference Products 373 413 253
– Margin 8.0% 8.6% 6.5%
Non-reference Products 915 1,309 1,178
– Margin 17.3% 22.9% 22.6%
Ingredients7
Volume (liquid milk equivalents, million)18 10,396 9,777 10,981
Volume (000s MT)18 1,556 1,441 1,543
Revenue ($ million) 8,196 7,903 7,219
Gross margin ($ million) 791 871 792
Gross margin %19 9.6% 11.0% 11.0%
Normalised earnings ($ million)20 461 558 510
Normalised earnings margin %21 5.6% 7.1% 7.1%
FONTERRA INTERIM REPORT 2019 25OUR PERFORMANCE
Historical Financial Summary CONTINUED
Divisional Breakdown – Ingredients 3, 7, 22
JAN 2019 JAN 2018 JAN 2017
Global Ingredients and Operations
Volume (liquid milk equivalents, million)18 9,416 8,763 9,998
Volume (000s MT)18 1,457 1,342 1,465
Revenue ($ million) 7,318 7,006 6,607
Gross margin ($ million) 722 766 730
Gross margin % 19
9.9% 10.9% 11.0%
Fonterra Ingredients Australia
Volume (liquid milk equivalents, million)18 843 836 833
Volume (000s MT) 18
175 148 155
Revenue ($ million) 919 855 727
Gross margin ($ million) 6 50 27
Gross margin % 19
0.7% 5.9% 3.7%
Other and Eliminations
Volume (liquid milk equivalents, million)18 137 178 150
Volume (000s MT)18 (76) (49) (77)
Revenue ($ million) (41) 42 (115)
Gross margin ($ million) 19
63 55 35
26 FONTERRA INTERIM REPORT 2019Regional Breakdown – Consumer and Foodservice 3, 7, 22, 23
JAN 2019 JAN 2018 JAN 2017
Oceania
Volume (liquid milk equivalents, million)18 843 819 912
Volume (000s MT) 18
315 309 335
Revenue ($ million) 1,108 1,087 988
Gross margin ($ million) 218 208 243
Gross margin % 19
19.6% 19.2% 24.6%
Normalised earnings ($ million) 32 15 58
Normalised earnings margin % 21
2.9% 1.4% 5.9%
Asia
Volume (liquid milk equivalents, million)18 733 763 857
Volume (000s MT) 18
149 145 156
Revenue ($ million) 933 905 933
Gross margin ($ million) 200 211 288
Gross margin %19 21.5% 23.3% 30.9%
Normalised earnings ($ million) 44 56 124
Normalised earnings margin % 21
4.7% 6.2% 13.3%
Greater China
Volume (liquid milk equivalents, million)18 524 599 583
Volume (000s MT) 18
144 129 112
Revenue ($ million) 688 731 567
Gross margin ($ million) 163 182 198
Gross margin %19 23.6% 24.9% 34.9%
Normalised earnings ($ million) 61 92 96
Normalised earnings margin %21 8.9% 12.6% 16.9%
Latin America
Volume (liquid milk equivalents, million)18 388 368 358
Volume (000s MT)18 280 294 305
Revenue ($ million) 741 750 751
Gross margin ($ million) 185 220 234
Gross margin %19 25.0% 29.3% 31.1%
Normalised earnings ($ million) (3) 30 35
Normalised earnings margin %21 (0.4%) 4.0% 4.7%
Total Consumer and Foodservice
Volume (liquid milk equivalents, million)18 2,487 2,550 2,711
Volume (000s MT)18 888 877 908
Revenue ($ million) 3,470 3,473 3,239
Gross margin ($ million) 766 821 963
Gross margin %19 22.1% 23.9% 29.7%
Normalised earnings ($ million) 134 193 313
Normalised earnings margin % 21
3.9% 5.6% 9.7%
FONTERRA INTERIM REPORT 2019 27OUR PERFORMANCE
Historical Financial Summary CONTINUED
Regional Breakdown – Consumer 3, 7, 22, 23
JAN 2019 JAN 2018 JAN 2017
Oceania
Volume (liquid milk equivalents, million)18 630 610 685
Volume (000s MT)18 267 260 285
Revenue ($ million) 846 832 768
Gross margin ($ million) 171 168 199
Gross margin % 19
20.2% 20.1% 25.9%
Asia
Volume (liquid milk equivalents, million)18 461 439 558
Volume (000s MT) 18
104 96 111
Revenue ($ million) 646 587 682
Gross margin ($ million) 166 171 227
Gross margin % 19
25.7% 29.1% 33.3%
Greater China
Volume (liquid milk equivalents, million)18 81 63 49
Volume (000s MT)18 45 40 28
Revenue ($ million) 199 183 121
Gross margin ($ million) 77 74 60
Gross margin % 19
38.8% 40.6% 50.1%
Latin America
Volume (liquid milk equivalents, million)18 334 321 305
Volume (000s MT) 18
265 280 288
Revenue ($ million) 672 693 693
Gross margin ($ million) 170 207 216
Gross margin % 19
25.3% 29.8% 31.2%
Total Consumer
Volume (liquid milk equivalents, million)18 1,506 1,433 1,597
Volume (000s MT)18 680 676 712
Revenue ($ million) 2,363 2,295 2,263
Gross margin ($ million) 584 619 702
Gross margin % 19
24.7% 27.0% 31.0%
28 FONTERRA INTERIM REPORT 2019Regional Breakdown – Foodservice 3, 7, 22, 23
JAN 2019 JAN 2018 JAN 2017
Oceania
Volume (liquid milk equivalents, million)18 213 209 227
Volume (000s MT)18 48 49 51
Revenue ($ million) 262 255 220
Gross margin ($ million) 47 41 44
Gross margin % 19
17.8% 16.1% 20.1%
Asia
Volume (liquid milk equivalents, million)18 272 323 299
Volume (000s MT) 18
45 49 45
Revenue ($ million) 287 318 252
Gross margin ($ million) 35 40 61
Gross margin % 19
12.1% 12.6% 24.4%
Greater China
Volume (liquid milk equivalents, million)18 443 535 534
Volume (000s MT)18 99 89 84
Revenue ($ million) 489 548 446
Gross margin ($ million) 85 108 137
Gross margin %19 17.5% 19.7% 30.8%
Latin America
Volume (liquid milk equivalents, million)18 54 46 53
Volume (000s MT) 18
16 14 16
Revenue ($ million) 69 57 59
Gross margin ($ million) 15 13 18
Gross margin % 19
21.4% 22.8% 30.1%
Total Foodservice
Volume (liquid milk equivalents, million)18 982 1,113 1,114
Volume (000s MT)18 208 201 197
Revenue ($ million) 1,107 1,178 976
Gross margin ($ million) 181 202 261
Gross margin % 19
16.4% 17.1% 26.7%
FONTERRA INTERIM REPORT 2019 29OUR PERFORMANCE
Historical Financial Summary CONTINUED
Operating Performance – China Farms 3, 7
JAN 2019 JAN 2018 JAN 2017
China Farms
Volume (liquid milk equivalents, million)18 113 132 156
Volume (000s MT)18 9 10 13
Revenue ($ million) 108 123 122
Gross margin ($ million) (8) (8) (6)
Gross margin % 19
(7.0%) (6.1%) (5.3%)
Normalised earnings ($ million) (17) (12) (24)
Normalised earnings margin % 21
(15.7%) (9.8%) (19.7%)
30 FONTERRA INTERIM REPORT 2019Notes to the Historical Financial Summary
1 Source: Fonterra Farmgate Milk Price data representing the weighted-average 13 Economic net interest-bearing debt reflects total borrowings less
United States Dollar contract prices of Reference Commodity Products. cash and cash equivalents and non-current interest-bearing advances
2 Source: Oceania Export Series, Agricultural Marketing Service, adjusted for derivatives used to manage changes in hedged risks.
US Department of Agriculture. 14 Economic debt to debt plus equity ratio is calculated as economic net
3 Percentages as shown in table may not align to the calculation interest-bearing debt divided by economic net interest-bearing debt plus
of percentages based on numbers in the table due to rounding of equity excluding hedge reserves.
reported figures. 15 Capital expenditure comprises purchases of property (less specific
4 Normalised earnings before interest, tax, depreciation and amortisation disposals where there is an obligation to repurchase), plant and
and is calculated as profit for the period before net finance costs, tax, equipment and intangible assets, and net purchases of livestock.
depreciation and amortisation, including normalised adjustments. 16 Figures exclude bulk liquid milk. The bulk liquid milk volume for the six
5 Represents segment earnings before unallocated finance income, months 31 January 2019 was 34,000 MT of kgMS equivalent (six months
finance costs and tax. For the six months ended 31 January 2016, and ended 31 January 2018 was 34,000 MT of kgMS equivalent).
2015 Greater China has been disclosed separately in alignment with the 17 The way in which Ingredients presents certain inter-segment sales
disclosures in the segment note. The six months ended 31 January 2015 between Ingredients and Foodservice was revised in FY19. This increased
has been restated to reflect changes to the organisation of business sales volumes for the six months ended 31 January 2019 by 4,000 MT and
units that occurred in the six months ended 31 January 2016. 79,000 MT on reference and non-reference products respectively, and
6 Normalised Net Profit after Tax attributable to equity holders of increased sales revenue by $34 million and $360 million on reference
the Parent. and non-reference products respectively. This change had no impact
to the reported gross margin for the Ingredients business.
7 Includes normalisation adjustments.
18 Includes sales to other strategic platforms.
8 Normalised EBITDA divided by normalised sales revenue.
19 Normalised gross margin divided by normalised sales revenue.
9 Normalised EBIT divided by normalised sales revenue.
20 Normalised EBIT for Ingredients excludes unallocated costs.
10 Normalised net profit after tax divided by normalised sales revenue.
21 Normalised EBIT divided by normalised revenue.
11 Cash flow generated by normal business operations, less net taxes paid.
22 Summing of individual numbers from the regional and divisional
12 Working Capital is calculated as current trade receivables plus breakdown may not add up to the totals in each category due
inventories, less current trade payables and accruals. It excludes to rounding.
amounts owing to suppliers and employee entitlements.
23 Includes share of Consumer and Foodservice overhead allocations,
the total impact of which is $37 million.
FONTERRA INTERIM REPORT 2019 31You can also read


