FOOD ACCESS ACROSS BRITISH COLUMBIA - Public Health Association of BC
←
→
Page content transcription
If your browser does not render page correctly, please read the page content below
MAY 4, 2021

FOOD ACCESS
ACROSS BRITISH COLUMBIA
       This report was made possible through funding from the Ministry of Social Development and Poverty Reduction
          via the Victoria Foundation’s Food Security Provincial Initiative Fund and a McConnell Foundation Grant
FOOD ACCESS REPORT   2

ABOUT THIS REPORT
PUBIC HEALTH ASSOCIATION OF BC
This Project is administered by the Public Health Association of BC (PHABC). PHABC is a non-profit charity organization that
provides public health leadership to promote health, well-being, and social equity for all British Columbians. PHABC fulfills their
mission through advocacy, collaboration and engagement activities, education, and research throughout the spectrum of public
health practice including prevention, promotion, protection, and policy.

VICTORIA FOUNDATION
The Victoria Foundation connects people who care to causes that matter. By inspiring giving and caring for the assets entrusted
to us, we invest in the people, ideas and activities that strengthen our community. Food Security is a strategic granting priority
for the Victoria Foundation, and we have been pleased to support a variety of food related projects in our local community over
the past five years.

The Food Security - Provincial Initiatives Fund was established in April 2019 at the Victoria Foundation with funding from
the Ministry of Social Development and Poverty Reduction to support food security projects and initiatives throughout British
Columbia. The fund supports regional initiatives that foster cross-sectorial partnerships to address household food insecurity
and strengthen local food systems and economies. The goal of the fund is to increase community access to healthy, affordable,
and culturally appropriate foods for all.

                   Suggested citation: Public Health Association of BC (2021). Food Access British Columbia, Victoria, BC.
FOOD ACCESS REPORT    3

ABOUT THIS REPORT
REGIONAL HEALTH AUTHORITIES
Public health leads representing all Regional Health Authorities help with some capacity in the development and dissemination
of the survey. The regional health authorities are responsible for advocating for the development, implementation and ongoing
review of food security, policies, programs and services within their geographic area. They also provide leadership in food
security strategies and programs that facilitate community engagement and community-driven awareness, planning and
delivery of local initiatives, while supporting the monitoring and evaluation of food security programs within the region and for
province-wide collaboration and coordinated initiatives.

MCCONNELL FOUNDATION
This project was made possible with funding from the McConnell Foundation. The McConnell Foundation is a private Canadian
foundation that develops and applies innovative approaches to social, cultural, economic and environmental challenges. In
response to the COVID-19 pandemic, the Foundation established a $1 Million fund to support food security in communities
across Canada. The envelope was split into two components: $500,000 to support emergency food response over the short-
term (three months) and another $500,000 to support medium-to long-term responses, with a view to strengthening domestic
food systems to ensure greater food system resilience in the country.

PLACESPEAK
PlaceSpeak is a location-based public engagement platform, created in British Columbia, which empowers decision-makers to
engage with people within specific geographical or jurisdictional boundaries, such as a neighbourhood, municipality or region.
Whether for community planning, transportation infrastructure, schools or public health, decision-makers need to know that
they are hearing from real people - not from bots or trolls. PlaceSpeak’s citizen-centric model puts real people at the heart of the
process, while ensuring that privacy always comes first. PlaceSpeak’s pioneering civic network provides authentic, defensible
and reliable public and stakeholder feedback; while keeping people informed, strengthening public trust, and ultimately building
stronger, healthier, and engaged communities.

FOOD ACCESS REPORT     4

ACKNOWLEDGEMENTS
The Public Health Association of BC (PHABC) would like to          Our research team would like to thank all the organizations
acknowledge that we are a provincial organization, and our         doing front-line food access programming. You are essential
work supports communities and nations across BC. The               workers to our province. We would like to give a special thank
manager of this project is a settler residing on the homeland of   you to the respondents that took the time to complete the
Lekwungen (Lək̓ʷəŋən) people, now known as the Songhees            survey; this project wouldn’t have been possible without you.
and Esquimalt Nations.
                                                                   PHABC would like to thank our funders and supporters
PHABC would like to acknowledge the research team for their        including; the Victoria Foundation, the Ministry of Social
dedication to this report and the hundreds of organizations that   Development and Poverty Reduction, and the McConnell
provide food access across BC. Thank you to Aaren Topley for       Foundation. We would like to give a special thank you to First
the project management, analysis, and writing of this report;      Nations Health Authority for support in distributing this survey.
to Rebekah Erikson for research support and dissemination of
the survey; Lisa Richardson for conducting the environmental Finally, thank you to the public health leaders specifically;
scan; Chelsea Woodhouse, for the communications and Laurel Burton, Jessica Newman, Megan Dark, Brenna Ayliffe,
design of this report; Christina Harding, copy editing and Anne Todd, Claire Gram, and Lauren McGuire-Wood.
execution management; Ron White, Erin Champion, Colin
Dring, Yinghong (Amy) Wu, Samantha Gambling for research
support; and Shannon Turner and Richard Han for their
continued guidance and support throughout this process.
FOOD ACCESS REPORT   5

FORWARD

Community service organizations that provide food access
across British Columbia (BC) act as a social safety net to
support individuals, families, and communities’ ability to meet
their daily food needs. The ongoing COVID-19 pandemic has
simultaneously exposed the socio-economic vulnerabilities of
our society and shown that non-profits, who often play a vital
role in our communities, are under-resourced and supported.

Despite current difficulties, many of these organizations are
compelled to tell their story of resiliency and to build community
through good food and dignified food access principles. It
is their dedication to supporting all British Columbians that
deserves recognition and the resources to help mend the
holes in the current social safety nets.

This project was conceptualized with the desire to provide a
baseline understanding of the characteristics and landscape of
food access programming across BC. It was developed with the
intention to be used as a stepping stone for further discussion
and concrete action, and to ensure that organizations providing
food access are given the opportunity to have a voice at the
decision-making tables and in food insecurity discourse.

Aaren Topley
Provincial Manager, Public Health Association of BC
FOOD ACCESS REPORT   6

TABLE OF CONTENTS
INTRODUCTION���������������������������������������������������������������������������������������������������������������������������7
BACKGROUND�����������������������������������������������������������������������������������������������������������������������������8
SNAPSHOT: ABOUT THE FOOD ACCESS SECTOR ���������������������������������������������������������������9
DEMOGRAPHICS OF SURVEY RESPONDENTS������������������������������������������������������������������� 11
    THE ROLE OF FOOD IN ORGANIZATIONAL MANDATES �����������������������������������������������13
    FISCAL OPERATIONS�����������������������������������������������������������������������������������������������������������14
    PARTNERSHIPS �������������������������������������������������������������������������������������������������������������������15
IMPACTS DURING COVID-19 ���������������������������������������������������������������������������������������������������17
FOOD ACCESS MODELS ���������������������������������������������������������������������������������������������������������20
    PROGRAM TYPE�������������������������������������������������������������������������������������������������������������������20
    PROGRAM COST�������������������������������������������������������������������������������������������������������������������21
    DIGNITY AS PART OF MODEL �������������������������������������������������������������������������������������������24
    PROGRAM DESIGN AND STRUCTURE�����������������������������������������������������������������������������25
    PROGRAM REQUIREMENTS FOR PARTICIPATION �������������������������������������������������������27
    PRINCIPLES OR RATIONALE BEHIND NON-REQUIREMENTS�������������������������������������29
    PRINCIPLES OR RATIONALE BEHIND REQUIREMENTS�����������������������������������������������30
    FOOD PROCUREMENT �������������������������������������������������������������������������������������������������������31
    TYPES OF FOOD SOURCING���������������������������������������������������������������������������������������������32
    RURAL AND REMOTE COMMUNITIES�������������������������������������������������������������������������������37
RECOMMENDATIONS���������������������������������������������������������������������������������������������������������������39
PHASE II ANALYSIS�������������������������������������������������������������������������������������������������������������������43
CONCLUSION�����������������������������������������������������������������������������������������������������������������������������44
APPENDIX A: METHODS�����������������������������������������������������������������������������������������������������������45
APPENDIX B: SURVEY �������������������������������������������������������������������������������������������������������������47
REFERENCES�����������������������������������������������������������������������������������������������������������������������������54
FOOD ACCESS REPORT   7

INTRODUCTION
Food security is a basic human right; and food that is nutritionally
dense and culturally appropriate should be readily available for
anyone to access, no matter their socio-economic status. The
ongoing COVID-19 Pandemic has revealed the food access
vulnerabilities in Canada and British Columbia (BC). This report
was borne out of the need to better understand and support
food access programming and organizations in BC and was
made possible through funding from the Provincial Ministry of
Social Development and Poverty Reduction via the Victoria
Foundation’s Food Security Provincial Initiatives Fund, and a
McConnell Foundation grant.

The report consists of two parts, a survey of organizations
providing food access programming, and an analysis of the
survey results, complete with a set of recommendations that
provincial government and funders can adopt to support food
access services and programs. The term Food Access
Organizations will be used to describe community service
organizations that provide food provisions through programs
such as good food boxes, food hampers, meal programs and
community kitchens that feed people1. Some organizations
may provide food access or food programming as one aspect
of their mandate, while others are entirely devoted to providing
those services; but all will be referred to as food access
organizations for the purposes of this report.

The distinction between respondents and participants will also
be important to note for the reader of this report. Respondents
will refer to food access organizations who responded to the
Food Access Survey while Participants will refer to clients
who are serviced be the food access organizations.

FOOD ACCESS REPORT    8

BACKGROUND
In March 2020, a global pandemic was declared by the World      To better understand the needs and concerns of these food
Health Organization. Countries across the globe began to        access organizations, the Public Health Association of BC
implement measures to stop the spread of COVID-19. In           (PHABC) conducted an online survey between February
British Columbia, Canada, restrictions were set in place that   3rd and March 3rd, 2021 using the community engagement
ultimately led to high rates of unemployment, not seen since    platform PlaceSpeak. Following the survey; PHABC, with
the recession in the early 1980’s2. The Federal Government      support from partner organizations, conducted a foundational
of Canada, in response to the pandemic, created multiple        analysis of the survey findings to characterise and understand
programs including the Canadian Recovery Benefit, the           the current landscape of food access organizations across
Canadian Emergency Wage Subsidy, and extended the               British Columbia. The methods and limitations of the survey
Employment Insurance Benefits to help individuals who are       are available in Appendix A.
experiencing employment hardship due to COVID-19.
                                                                This report is intended as the first phase of analysis on this
Food access organizations have expressed impacts to their subject. The end of the report offers a proposed phase 2, where
programs due to increased unemployment and ongoing further analysis should be conducted, which is dependent on
COVID-19 restrictions, with the unemployment rate in BC funding.
climbing from 5% prior to the pandemic to 13.4% in May 20203.
They have had to adapt their models; including limiting in-
person access, increasing home delivery services, and other
types of modifications to meet the COVID-19 restrictions. While
the provincial and federal governments have provided some
additional funding for food access organizations intended to
help during the COVID-19 pandemic; several different network
conversations with a variety of food access organizations
across BC revealed that this funding has not met their needs
and administrative requirements of the funding applications
have reduced these organizations’ ability to access these
resources.
FOOD ACCESS REPORT    9

SNAPSHOT: ABOUT THE FOOD ACCESS SECTOR
“Food security exists when all people, at all times, have physical and economic access to
sufficient, safe and nutritious food that meets their dietary needs and food preferences for an
active and healthy life”4

Food access is only one part of food security. The availability      The prevalence of household food insecurity is highest in
of food, ability to utilize provisions, and stability of food        Northern BC. In this region, 16.4% of the population experiences
access over time, alongside additional factors, all affects a        some level of food insecurity11. The greatest cost of accessing
person’s food security.5 Food access organizations aim to            healthy food resides in the Northwest of BC, with a monthly
support food security by providing programs and activities that      cost of $1,184 for a family of four in 201712. The prevalence
reflect appropriate food quality, quantity, safety, and cultural     of food insecurity in a first-world country provides evidence
preferences of their clients. These considerations to food           of the erosion of Canada’s social safety net programs and
access have an impact on household or individual outcomes            highlights the need for governments to intervene and support
in food security.6                                                   a basic human right for its most marginalized communities and
                                                                     individuals.
Households that include children under the age of 18 are the
most prevalent group experiencing food insecurity nationally,        According to a 2020 report by Vantage Point on the impacts of
provincially, and regionally.7 In British Columbia (BC), one in      COVID-19 on the non-profit sector; vulnerable participants now
six children under the age of 18 have experienced some level         have less access to food, which had previously been provided
of food insecurity.8 Between 2009 to 2017 the monthly cost of        as in-person services, and organizations are struggling with
a household to purchase an adequately healthy diet rose from         the additional logistics needed to facilitate participants’ safe
$872 for a family of four to $1,0199. This resulted in families      access to food; including increased expenses, supply chain
experiencing nearly $150 in increased monthly food expenses          management stresses, and delivery logistics13. One of the
over the eight-year period10. As the cost of healthy eating rises,   ‘new’ normal recommendations outlined in the report was for
access to nutritious food disproportionally affects low-income       funders to include food access and security as an essential
earners as food insecurity becomes a reflection of the ability to    part of programming and services, rather than an add-on to
afford healthy food, rather than the cost of the food itself.        in-person programming14.
10 FOOD ACCESS REPORT       FOOD ACCESS REPORT   10

FOOD ACCESS ACROSS BRITISH COLUMBIA
           SURVEY RESULTS
FOOD ACCESS REPORT 11
DEMOGRAPHICS OF SURVEY RESPONDENTS
To accurately depict the landscape of food access organizations in BC, a portion of the Food Access Survey was designed to
capture demographic information from the respondents; including the health authority regions they serve, the role food plays
within their organization’s mandate, their fiscal operations, and their partnerships with other organizations.
168
HEALTH AUTHORITY REGIONS
The survey was completed by a total of 168 food access
organizations, with responses coming in from food access
organizations working across all five of the Regional Health
Authorities service boundaries. Out of the 168 respondents, 27 food access organizations
identified as working within the Fraser Health Authority Region,
44 within the Interior Health Authority Region, 40 within the
surveyed across British
Island Health Authority Region, 19 within the Northern Health Columbia
Authority Region, and 38 within the Vancouver Coastal Health
Authority Region.
# of survey respondents by health region
44 Interior Health
40 Island Health
38 Vancouver Coastal Health
27 Fraser Health
19 Northern HealthFOOD ACCESS REPORT 12
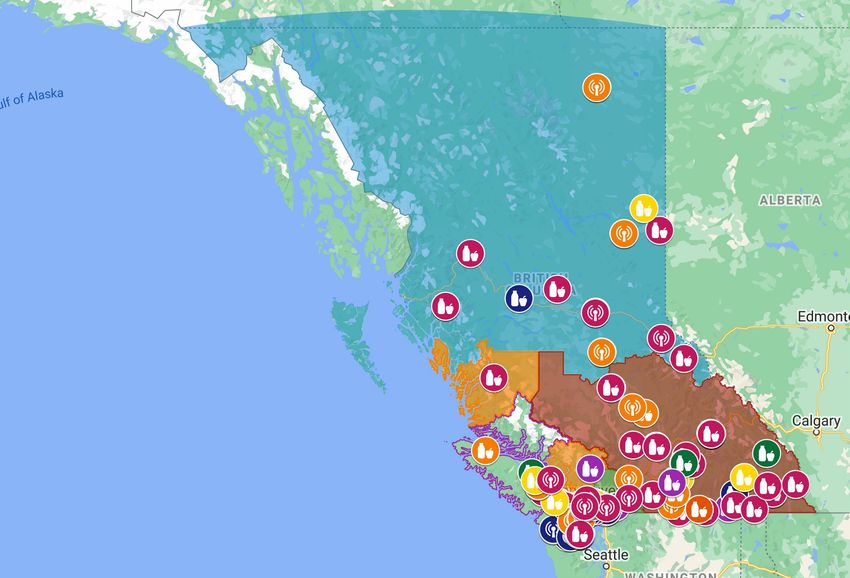
DEMOGRAPHICS OF SURVEY RESPONDENTS
MAP OF RESPONDENTS WHO
COMPLETED THE SURVEY
LEDGEND
# of satellite sites
per organization
5+ 2
4 1
3 0
main office
satellite sites
SEE THE FULL ONLINE MAP HERE
Only consenting organizations present
Source: PHABC 2021 Food Access Survey, N=130FOOD ACCESS REPORT 13
DEMOGRAPHICS OF SURVEY RESPONDENTS
THE ROLE OF FOOD IN
ORGANIZATIONAL MANDATES 45% food is one aspect/not a
common aspect of their work
but not in every program
Food access organizations who responded to the survey
varied in breadth and scope; from ones who had food as a
core function of their mandate, to programs that offered food
as a means to ensure engagement in other non-food related
40% food is a core part of their work
and is embedded in every part
of their programming
programming.
Respondents were asked about the role food plays within
their mandate. From the food access organizations surveyed;
10% food is one aspect of their work
and is embedded in every part
of their programming
food either played a small role in their work or acted as a core
function of their programming. 45% of respondents noted that
5%
food access is one aspect or not a common aspect of their work food only became part of
and not in every program, while 40% of respondents noted their work because of the
that food access is a core part of their work and is embedded COVID-19 pandaemic
in every part of their programming (Figure 1).
Figure 1: Role Food Plays in Organizations Mandate
Source: PHABC 2021 Food Access Survey, N=168
“ We firmly believe that food is a human right. We also believe that food is culture, our connection
to each other and the Earth, nutrition, a creative outlet, enjoyable, communal, spiritual, political,
comfort and a way we show care for one and other.”
“ If people need to stand in food line-ups or don’t have access to food, they aren’t able to participate
in arts and culture programming so we work to address these issues by providing meals / food /
snacks along with our arts programming.”FOOD ACCESS REPORT 14
DEMOGRAPHICS OF SURVEY RESPONDENTS
FISCAL OPERATIONS
The annual budgets, as reported by the respondents, varied To better understand the funding supports used by food access
extensively. While 76% of all respondents indicated they have an organizations, respondents were asked which type of funding will
annual budget of under $401,000, 13% indicated they have an support their operations for the 2021 calendar year; grants, cash or
annual budget of over $1 million. More respondents (34%) indicated cheque donations, and/or core funding in the form of an annualized
their annual budget fit in the under $50,000 category than any other operational budget. 82% of respondents indicated grants supported
category (Figure 2). their organization, 73% indicated they receive cash or cheque
donations to run their programs, while core funding was only
indicated by 39% of respondents as a source of funding for their
programs (Figure 3).
Estimated Annual Budget
of Organizations
Funding Types to Support
Organization Operations
under $50K 34%
$51K - 100K 16%
$101K - 400K 26% 82% 73% 39%
$401K - 1M 11%
$1M and over 13% GRANTS CASH OR CORE
CHEQUE FUNDING
DONORS
Respondents could select more than one option
Figure 2: Estimated Annual Budget of Surveyed Organizations Figure 3: Funding Type that Supports Organizations Operations in 2021
Source: PHABC 2021 Food Access Survey, N=168 Source: PHABC 2021 Food Access Survey, N=168FOOD ACCESS REPORT 15
DEMOGRAPHICS OF SURVEY RESPONDENTS
PARTNERSHIPS
Partnerships are a vital aspect of program development and The top four partnerships selected were other non-profits
execution. When food access organizations partner with other at 76%, community members or engaged citizens coming
non-profits, they can share expertise, resources, expand their together to help at 74%, Food industry at 73%, and faith-based
outreach, build community support, enhance their capacity, group or organization at 60% (Figure 4).
and aid in distribution.15 16 17 18
Only 27% of respondents indicated Neighbour Houses, 27%
Respondents were asked to indicate the types of partners indicated Friendship Centres or other Indigenous groups,
that are involved in their food access programs, which could 14% indicated researchers/academics, and 13% indicated
include organizations that donate money or in-kind support, First Nations governments as partners with their food access
provide volunteers to make or distribute the food, provide their organizations (Figure 5).
building as a food pick-up location, or other types of support.
The following are the types of partner organizations respondents were able to select
when completing the survey:
• Food Industry (farmers, processes producers, • Researchers/academics
including food businesses that donate food) • Municipalities
• Businesses (not involved in the food sector) • Federal Government
• Neighbourhood Houses • First Nations governments
• Friendship Centres or other Indigenous organizations • Provincial Government
• Faith based group or organization • Health Authority
• Other non-profits
• Community members or engage citizens coming
together to helpFOOD ACCESS REPORT 16
DEMOGRAPHICS OF SURVEY RESPONDENTS
PARTNERSHIPS
MOST COMMON LEAST COMMON
Type of Partnership Type of Partnership
76% non-profits 27% neighbour houses
community members or engaged friendship centres and other
74% citizens coming together to help 27% indigenous groups
food industry
73% (farmers, processes producers, including food
businesses that donate food) 14% research/academics
faith based groups or
60% organizations 13% First Nations governments
Respondents could select more than one option Respondents could select more than one option
Figure 4: Most Common Type of Partnership Figure 5: Least Common Type of Partnership
Source: PHABC 2021 Food Access Survey, N=168
Source: PHABC 2021 Food Access Survey, N=168FOOD ACCESS REPORT 17
IMPACTS DURING COVID-19
It is undeniable that the impacts of the COVID-19 pandemic
have had a far-reaching effect on our society. Food access
92%
organizations have required a major reorganization of their of organizations have had to modify their
services to support individuals and communities who have
become or continue to be food insecure and this survey aimed
food programs during COVID-19
to understand the specific impacts COVID-19 has had19.
69%
Almost every single survey respondent (92%) indicated the of organizations saw an increase in
need to modify their food programs during COVID-19. The
majority of organizations established new programs because
participants or access to program(s) due
of COVID-19 (65%), including organizations that began doing to COVID-19
food programming because of the pandemic and organizations
that added additional food programming as their response
65%
(Figure 6). Of the respondents in the Vancouver Coastal
of organizations had to established new
Health Authority Region, Fraser Health Authority Region, and
Island Health Authority Region, all introduced the most new programs as a result of COVID-19
programs at 86%, 74%, and 68% respectively. According to the
responses, there is a major difference between new program Respondents could select more than one option
development in those regions versus Interior Health Authority Figure 6: Impacts of COVID-19 on Food Program Development
Region and the Northern Health Authority Region (Figure 7). Source: PHABC 2021 Food Access Survey, N=168
For example, there is a 41% difference between new programs
started in the Interior Health (45%) versus Vancouver Coastal
Health (86%).FOOD ACCESS REPORT 18
IMPACTS DURING COVID-19
Of the 168 respondents, 69% reported an increase in
participation demand during COVID-19. Through an optional ORGANIZATIONS THAT
open-ended question, some of the 31% who did not report
an increase in participation demand indicated they saw
ESTABLISHED A NEW PROGRAM AS
shifts in program participant numbers instead due to new
RESULT OF COVID-19
participants attending combined with regular participants not- by Health Region
returning. Other organizations attributed the non-increase
in participants to government support for individuals and
families impacted by COVID-19. Others indicated they saw 86% Vancouver Coastal
a decrease in participation when their food access program
transitioned back to a pick-up model from the home delivery
model that was established at the beginning of the pandemic. 74% Fraser
These responses indicated the need to understand the impact
Canadian Emergency Response Benefit (CERB) and other
government financial support programs have had on food 68% Island
insecurity as well as possible disproportionate impacts being
experienced by socio-economic disadvantaged, marginalized,
racialized or otherwise vulnerable groups despite the creation
of CERB.
47% Northern
In responding to the following question: “Please share with us
any participation numbers that you have comparing pre and
45% Interior
post COVID-19 - the more specific you can be the better.”
respondents provided a variety of data ranging from different Figure 7: Organizations that Established a New Program as Result of COVID-19
Source: PHABC 2021 Food Access Survey, N=168
temporal frequencies from weeks versus month to different
kinds of participation data; including the number of participants
accessing the service, the number of meals or hampers,
the weight of food donated, or the cost of food purchased.
There was no standard method of collection or analysis of
these responses and therefore this question was unable to be
appropriately interpreted in this report.FOOD ACCESS REPORT 19
IMPACTS DURING COVID-19
Respondents Reflections on Why They Didn’t Experience an Increase in Participants:
“ When COVID fears [first] started to circulate, we saw a 39% increase
in meal consumers, and experienced more clients coming forward for
hampers (we offered delivery, but were unable to continue this service
due to volunteer burn out- fuel prices). The increase in hampers was
not necessarily due to new families coming forward, rather clients taking
advantage of the delivery option.”
“ Our participation numbers have gone down because we have had
reduced seating for our weekly community meal. We have had lower
participation as well because the majority of our regular participants are
seniors.”
“ We have seen a reduction in the number of two-parent families who
access our food bank since the onset of the pandemic. We attribute this
reduction to the variety of financial assistance options provided to this type
of family by the federal and provincial governments.”FOOD ACCESS REPORT 20
FOOD ACCESS MODELS
PROGRAM TYPE
Responses to the question“what type of food access programs The least selected model types included school breakfast,
do you currently offer?” show the wide variety of program lunch, or snack programs at 26%, farmers market or market-
models in place across the province. Left includes the list of
style program at 23%, programs providing culturally harvested,
food access programs provided on the survey alongside the selected, or prepared food at 23%, and daycare food and
percentage of respondents who indicated they deliver the school break programs at 11%. This survey was not targeted
model type: towards school or daycares, with only 3 schools completing the
survey, and therefore the low responses in that category may
Food hampers were the most selected program model type at not be accurate to the number of school or daycares offering
76%, gift cards followed at 54%, and meals served as part of food programs in the province20.
a community service program came in at 51%.
The following is a list of food access programs provided on the survey alongside the
percentage of respondents who indicated they deliver the model type:
76% Food hampers with donated produce and 36% Community garden programs
staples
35% Meal served as part of a community service
54% Gift cards for groceries or meals program
51% Grocery type food offered as part of a 35% Other: food education program
community service program
26% School breakfast, lunch, or snack program
49% Hot meals 23% Programs providing culturally harvested,
41% Frozen meals selected, or prepared food
40% Cold meals this includes sandwiches etc. 23% Farmer’s market or market-style program
39% Good food box with local produce and 11% Daycare food program
staplesFOOD ACCESS REPORT 21
FOOD ACCESS MODELS
PROGRAM COST
When asked if there was an associated cost to accessing food
programs provided by the Respondents’ organizations, the
majority of programs were offered with no cost to the participant
(85%), 17% had a standard fee for participants, 16% had a COST TO PARTICIPANTS
sliding scale for participation, and 22% provided the program
as a social enterprise (Figure 8). It is important to note that
respondents were able to select more than one option when
responding to this question.
85% Free*
22%
Respondents had the option to describe their model type in
detail. Of the respondents, 123 indicated their organizations Social Enterprise
provided a free program. A Google search was also conducted of
the remaining 45 organizations surveyed, of which 19 indicated
they offered free programs on their website. Therefore, the
researchers have concluded a total of 142 respondents (85%)
17% Fee-Based
offer a free program and the data has been modified to reflect
16%
this.
Sliding Scale
Respondents were given space to describe their food access
program model in detail. In an analysis of the responses;
*modified data due to an error in the online survey
respondents who charge for access to food do so to financially See page 22 & 23 for full breakdown by health region
sustain their program models. While many offer their programs Respondents could select more than one option
for free, the sliding scale model allowed people to pay what Figure 8: Cost to Participants
Source: PHABC 2021 Food Access Survey, N=168
they could and subsidized those who could not. Sliding scale
models for local produce programs, such as Community
Supported Agriculture or Good Food Box programs, have been
shown to have the benefits of social inclusion for low-income
participants and a method of creating economic viability to
sustain the model21.FOOD ACCESS REPORT 22
FOOD ACCESS MODELS
PROGRAM COST
FREE MODEL
93%* Fraser
“
89%* Vancouver Coastal
We give food to whoever asks.
No qualifying or rules. They ask or call. 84%* Northern
We give what we can.
84%* Interior
75%* Island
*modified data due to an error in the online survey
Source: PHABC 2021 Food Access Survey, N=142
SOCIAL ENTERPRISE MODEL
“
30% Island
Monthly program providing fresh
produce at wholesale prices to people 26% Northern
who purchase it and sponsored clients.
Community agencies, businesses and 24% Vancouver Coastal
individuals sponsor boxes for individuals
or families identified by schools, social 16% Interior
agencies etc. 11% Fraser
Source: PHABC 2021 Food Access Survey, N=36FOOD ACCESS REPORT 23
FOOD ACCESS MODELS
PROGRAM COST
SLIDING SCALE MODEL
33% Island
“
16% Northern
Community meals are sold on a cost-
recovery basis (using a flexible model of 15% Fraser
pay more if you can, less if you can’t.
11% Interior
3% Vancouver Coastal
Source: PHABC 2021 Food Access Survey, N=26
FEE MODEL
21% Northern
“
18% Vancouver Coastal
We purchase in bulk and sell at cost
or less than cost. This program includes 18% Island
canned goods, meat, toilet paper, etc.
16% Interior
15% Fraser
Source: PHABC 2021 Food Access Survey, N=29FOOD ACCESS REPORT 24
FOOD ACCESS MODELS
DIGNITY AS PART OF MODEL
In analyzing responses to the optional open-ended questions in direct decision making, and still, others discussed providing
included in the section on food access organizations’ mandate, opportunities for participants to contribute and connect with
program types, and access types (Appendix B), a recurring each other through the program. The theme of dignity can
theme of dignity as part of the model type was identified. Some be seen as a core value to many of the organizations that
respondents discussed how their models worked to empower completed the survey and should be an area further explored
participants through ‘dignified food access’, others discussed when understanding food access program types and their
involving people with lived experience (i.e., people who have impacts on participants.
directly experienced the impacts of poverty and food insecurity)22
Respondents reflections of Dignity as Part of the Model Type:
“ We use the offering of food to reflect back upon our neighbours their inherent
dignity, deservedness, and welcome within the [neighbourhood]...”
“ Rather than relying on handouts and donations, they support the idea of food access
centres being appropriately funded and include food access programs (in a respectful
and dignified manner), food skills programs such as cooking and gardening, and
advocacy programs to help change things at the systemic level.”
“ Connecting kitchens with the Indigenous Food Sovereignty Hub, community gardens,
and urban farms, and agricultural migrant workers keeps the control of ingredients
and cooking in the hands of those in need, builds solidarity, and removes dependence
on colonial food systems and supply chains.”FOOD ACCESS REPORT 25
FOOD ACCESS MODELS
PROGRAM DESIGN AND LEADERSHIP MODEL
STRUCTURE
To better understand how food access organizations were
designed and who is involved in the program delivery;
respondents were asked whether their organizational structure
82% STAFF-DRIVEN
staff and management shape
was community-driven or leadership-driven. Community- the mandate and models of the
driven allows for people who are accessing the program(s) to organization
help shape the mandate and the models of the organization.
Leadership-driven is when staff and management decide
the mandate and models of the organization along with its
implementation. Respondents had the ability to check all
56% COMMUNITY-DRIVEN
that apply. 40% of respondents selected both organizational
structure types; indicating there is some nuance and cross-
over between organizational structures that could be further people who are accessing the
explored in the future. Leadership-driven organizations were program(s) help to shape the
selected the most overall at 82% and community-driven was mandate and models of the
selected least among respondents at 56%. organization
Figure 9: Leadership Model
Source: PHABC 2021 Food Access Survey, N=168FOOD ACCESS REPORT 26
FOOD ACCESS MODELS
PROGRAM DESIGN AND STRUCTURE
Respondents were asked to indicate the role their participants play in their food access program models. Across all Health
Authority Regions, the majority of program models included participation from individuals who also received the services.
Organizations operating within the Interior Health Authority and Vancouver Coastal Health Authority Regions reported more
involvement by their participants in the running of the program compared to other Health Authority Regions, at 59% and 58%
respectively. Conversely, the Northern Healthy Authority Region had the most amounts of participants in their programs who
were also staff members at 37% (figure 10).
STAFF VOLUNTEERS
people who receive services are sometimes staff people who receive services are sometimes
volunteers or run programs/workshops
37% Northern 59% Interior
29% Vancouver Coastal 58% Vancouver Coastal
28% Island 48% Fraser
20% Interior 47% Northern
4% Fraser 45% Island
Respondents could select more than one option
Figure 10: Participants Role in Programs
Source: PHABC 2021 Food Access Survey, N=91FOOD ACCESS REPORT 27 FOOD ACCESS MODELS PROGRAM REQUIREMENTS FOR PARTICIPATION To better understand how participants accessed the food On further analysis, respondents had specific population programs; respondents were asked what requirements or requirements based on their organizations’ mandates. For documents are required for participation in the program. Two example, some organizations work with sex workers or at- options were given with the respondent able to select both, risk youth, therefore most of their participants reflect those along with open-ended text boxes to describe their requirements demographics. These organizations provide food as part of in more detail. These two options were “people require ID or wrap-around services to clients; food isn’t a core part of the some type of requirement to access the program,” and “anyone mandate but is present in some of their programming due to can access the food programs without any questions.” 52% of their participants’ also experiencing food insecurity. Therefore, respondents selected the anyone can access with no question’s requirements are sometimes necessary if an organization is response but then went on to describe a series of requirements providing wrap-around services while working with a specific that participants needed to meet to access the program. population. Therefore, in the analysis their responses were modified to reflect that they do set requirements for participants. This modified the total of respondents representing organizations that allowed anyone to access their program without question to 39% (Figure 11).
FOOD ACCESS REPORT   28

FOOD ACCESS MODELS

PROGRAM REQUIREMENTS FOR PARTICIPATION

          OPEN ACCESS                                                            ID REQUIRED
   anyone can access the food programs                       people require ID or some type of requirement
          without any questions                                         to access the program

 64%   Northern                                              36%            Northern

 50%   Island                                                50%            Island

 46%   Fraser                                                54%            Fraser

 37%   Vancouver Coastal                                     63%            Vancouver Coastal

 32%   Interior                                              68%            Interior

                                       Figure 11: Food Access Requirements
                                  Source: PHABC 2021 Food Access Survey, N=168
FOOD ACCESS REPORT 29
FOOD ACCESS MODELS
PRINCIPLES OR RATIONALE BEHIND NON-REQUIREMENTS
Organizations that selected “Anyone can access the food required them to collect information from participants they did
programs without any questions” were given opportunity to not feel reflected their mandate and core values. Three quotes
describe their principles behind their policy. An analysis of have been extracted from the survey results to highlight
their responses indicates respect and dignity as some of their organizations’ rationale behind not setting requirements for
driving principles behind their work. One organization used participation.
the space to express concern at an instance where a funder
Respondents reflections on non-requirements to access:
“ We are a low to no barrier services. Respect, dignity, and partnership
for and with clients is of utmost importance. We don’t make folks prove
poverty or need.”
“ We believe in dignified access so we don’t ask any questions about
income. We have had one funder that requires more information (which
we weren’t too pleased about).”
“ We basically need to know that they are local. But, we are pretty lenient,
as we know we get a large number of transients that need help too.
Honestly, it is a gut call.”FOOD ACCESS REPORT 30
FOOD ACCESS MODELS
PRINCIPLES OR RATIONALE BEHIND REQUIREMENTS
Organizations that required participants to present ID or take advantage of their organizations’ resources and limited
indicated some other requirements to access their food capacity. For comparison, three quotes have been extracted
programs were given space to discuss their rationale for from respondents to highlight their specific requirements and
setting up requirements. In the analysis of their responses, rationale for the existence of those requirements.
these organizations indicated concerns that participants may
Respondents reflections on Requirements to Access:
“ We require applicants to provide the contact info of a staff member at a referral agency (a
neighbourhood house, housing society, medical provider, social worker, student enrolment
services, etc) just so we can ensure the food is going to those who need it. After we received
the initial application with their information and determine if we can deliver to them, we require a
signed waiver/membership agreement...”
“ We ask for ID, and income/expenses, but no one is turned away if they cannot provide either. This
is asked for those who use our hamper program only. Again, no one is turned away. Unfortunately
there are people who travel to various food banks in our area, picking up multiple hampers,
many selling the food once they receive it. We do not have a infinite amount of resources, so we
want to ensure (through ID) that we are serving those in our area...”
“ With the hampers, we do verify ID to ensure it is the right person who had the appointment
instead of someone else. Also, because of the way we are organized, we verify address and
direct people to their own city’s [food access organization], minimizing travel (with COVID-19
going on) and double dipping across multiple of our sister locations.”FOOD ACCESS REPORT 31
FOOD ACCESS MODELS
FOOD PROCUREMENT
82% using
food
donated food and/or rescued
Donated food plays a major role in food access programming
across the province. To better understand food procurement
sources, respondents were asked to indicate the various
methods of food procurement their organizations undertake.
82% of respondents indicated that their organizations use 80% purchasing food from grocery stores
or warehouses
donated food. This was closely followed by 80% of respondents
indicating they purchase food from grocery stores and
warehouses. Food harvested for community purposes and
bought directly from farmers were the least popular types of
food procurement sources, at 47% and 38% respectively.
Regionally; the Interior Health Authority (55%) and Island
47% using food harvested for community
purposes
Health Authority (53%) Regions both source substantially
more of their food products from local farmers compared to
the Fraser Health Authority (22%), Northern Health Authority
(26%) and Vancouver Coastal Health Authority (18%) Regions
(Figure 12).
38% purchasing
farmers
local food directly from
Respondents could select more than one option
View the detailed breakdown by health region on page 32
Figure 12: Type of Food Sourcing
Source: PHABC 2021 Food Access Survey, N=168
“ The regional food centers like ourselves [could] make better use of local produce
by creating value added products to extend the local season. We could also
connect with other food hubs doing aggregation and distribution to move food
between regions.”FOOD ACCESS REPORT 32
FOOD ACCESS MODELS
TYPES OF FOOD SOURCING
USING DONATED FOOD PURCHASING FOOD FROM GROCERY
AND/OR RESCUED FOOD STORES OR WAREHOUSES
89% Fraser 85% Fraser
84% Vancouver Coastal 84% Northern
84% Northern 82% Interior
82% Interior 78% Island
73% Island 74% Vancouver Coastal
USING FOOD HARVESTED FOR PURCHASING LOCAL FOOD
COMMUNITY PURPOSES DIRECTLY FROM FARMERS
59% Interior 55% Interior
53% Northern 53% Island
48% Fraser 26% Northern
43% Island 22% Fraser
34% Vancouver Coastal 18% Vancouver CoastalFOOD ACCESS REPORT 33
TYPE OF SUPPORT NEEDED
“
Respondents were asked to describe the most critical funding
or sustainability needs for their organization. The responses to Our funding is only till the end of
this qualitative question were themed and coded to facilitate March, so we need more funding
analysis. The top three themes identified in the analysis were to continue programs.”
organizations that required additional funding to purchase
food (29%), for staff salary (28%), and for core funding (10%)
(Figure 13). 5% of respondents explicitly expressed concern When respondents were asked “how long do you think you
at the prospect of the Government of Canada’s Emergency will be able to sustain your organization’s food operations?”,
Community Support Fund (ECSF) ending on March 31st, approximately half (54%) of respondents expressed that they
2021. The conclusion of this funding program is likely to result could sustain their organization for 1 year +, while the other half
in these organizations having to dismiss or terminate staff and/ (46%) expressed either that they would not be able to sustain
or end their operations entirely. their organization for up to year or that they didn’t know.
HOW LONG DO YOU THINK YOU
MOST CRITICAL TYPE OF FUNDING WILL BE ABLE TO SUSTAIN YOUR
OR SUSTAINABILITY NEEDS ORGANIZATION’S FOOD OPPERATIONS
82% 28% 10%
FOOD STAFF CORE 54% 46%
PURCHASE SALARY FUNDING more than 1 year less than 1 year (20%)
& I don’t know (26%)
Descriptive question that was themed and coded
Figure 13: Most Critical Type of Funding or Sustainability Needs
Source: PHABC 2021 Food Access Survey, N=168 Figure 14: How long do you think you will be able to sustain your organization’s food opperations
Source: PHABC 2021 Food Access Survey, N=168FOOD ACCESS REPORT 34
TYPE OF SUPPORT NEEDED
Respondents reflections on Most Critical Funding or Sustainability Needs:
“ Our most critical sustainability is the need for multi-year funding that pays
for staffing/wages; rent; utilities; insurance. We have sufficient infrastructure
currently although we would love to have our own dedicated space rather than
renting so we could make appropriate renovations as needed.”
“
Operational funding (paying coordinators for programs), as well as supporting
food costs. We try purchase all our food from local farmers, so donated food
goods from public are not helpful.”
“ We are desperate for funding to pay for a staff member to run the program
effectively. We rely on volunteers but need staff to take responsibility and
leadership.”FOOD ACCESS REPORT 35
TYPE OF SUPPORT NEEDED
Respondents were also asked to describe the type of TYPES OF NETWORKING, TRAINING AND
networking, training, and organizational support they feel they ORGANIZATIONAL SUPPORT NEEDED
need (Figure 15). 60% of respondents expressed a desire to
network and learn from other organizations doing similar work.
ability to network and learn from
60%
Because of the high variability between food access program
designs and delivery, as identified in this report, any networking other organizations doing similar food
opportunities offered must reflect these differences. access work
“Look at the knowledge bases different organizations
have, and think of ways they could best collaborate so
we can be efficient as possible.”
54% ability to network and learn from other
organizations in your region
54% of respondents expressed a desire for more training
opportunities, although one indicated the need to have
more staffing capacity to be able to attend training. It should
training for staff (i.e. program development,
be noted that those training opportunities, much like the
networking opportunities, require consideration and catering
to the different program types and geographic regions across
43% communications, social enterprise, anti-oppresion,
policy leadershop, etc)
BC to ensure impactful changes. This is discussed further in
the rural and remote communities’ subsection of this report. Descriptive question that was themed and coded
Figure 15: Types of Networking, Training and Organizational Support Needed
Source: PHABC 2021 Food Access Survey, N=168
“
...We live on the Sunshine Coast, so are rural - training [opportunities]
available from the Lower Mainland (our closest neighbour) don’t necessarily
apply as resources available are so different.FOOD ACCESS REPORT 36
TYPE OF SUPPORT NEEDED
TRAINING THEMES
32% Organizational
Respondents were asked to describe the type of training their
Social Justice
food access organizations would like to receive. The responses
to this qualitative question were themed and coded to facilitate
11% (decolonization and anti-oppresion)
analysis. Three main themes were identified and include
organizational training as the most common training desired
32%; including training on program design and development, 9% Client Management
social enterprise development, and administrative skills
development. This was followed by social justice training at
11%, and food safety, first aid, naloxone, and other related
services training, advocacy and policy leadership training, and
9% Advococy and Policy Leadership
client management training, including non-violent intervention,
all represented 9% of responses (Figure 16).
9% Food Safe, First Aid, Naloxone, etc
Respondents could select more than one option
Figure 16: Types of Professional Training that Food Access Organizations Would like to Offer their Staff
Source: PHABC 2021 Food Access Survey, N=168
“
I feel there is enough training opportunities but inadequate capacity to do
them (ie. reimbursement for time required to undertake training). There is also
a very good network of people (BC food security gateway). All the pieces are
in place in our community, except funding people to actually “do” the work.”FOOD ACCESS REPORT 37
PROGRAM DESIGN AND STRUCTURE
RURAL AND REMOTE COMMUNITIES
In several questions; including “Please expand on the Multiple respondents wrote specifically about the challenges
most critical type of funding or sustainability needs your of accessing donated food in a rural or remote community.
organizations has at the moment?” and “Is there anything else Food access organizations are often not able to access food
we should know as we begin to plan how to support regional from larger city centres because there may be pre-established
food access programs?”, respondents from rural and remote relationships between urban food access organizations and
communities described unique challenges to operating food the food producers that take priority, or the rural or remote
access programs in their regions. Concerns described include organization cannot handle the sheer volume of food being
challenges with accessing donated food, the cost of fuel for donated from urban food producers. Travel also presented
program delivery, and resources and support designed for itself as an operational barrier for the rural and remote food
urban centres not being relevant to their organizations. access organizations due to the long distances and fuel costs
associated to be able to access the donated food.
“
Respondents reflections on the Challenges Rural and Remote Communities Face:
often times the smaller centers can’t take advantage of the larger city centers for food recovery or
donation efforts, either the bigger facilities have already created that partnership and are territorial
about it OR we just can’t participate since we are so small and can’t handle the volume of food
“
from the recovery from big box stores.”
Northern communities in BC that do not have big shopping centres (Wholesale Club, No Frills)
have to travel an hour + to do big bulk shopping trips.”
“ We do need more funding for food and travel to deliver food to people who cannot leave their
communities (many of the local reserves have been on lockdown during parts of the pandemic).
People need support to build food sovereignty in their communities so they are not reliant on
finding food at grocery stores that may be hundreds of km away.”FOOD ACCESS REPORT 38
PROGRAM DESIGN AND STRUCTURE
RURAL AND REMOTE COMMUNITIES
Respondents in some rural and remote communities also expressed the need to connect with peers in similar settings to
network and share best practices related to running food access programs in non-urban settings. Best practices developed in
urban centres may not relevant to rural and remote communities and should not be assumed to.
“ we are a small rural community organization. We need to make ongoing
decisions about our operations with little access to best practice or ability to
assess computer technologies etc. The focus of our network organizations
is urban based, rural service models would be appreciated.”FOOD ACCESS REPORT 39
RECOMMENDATIONS
The responses from the Food Access Survey help to shed light on the extent and scope of food access organizations in the province.
These organizations are often on the front-lines of the communities they serve and should be considered a vital part of the social
safety net of British Columbia that deserves consistent support23. The following recommendations are based on the analysis of the
survey results and target decision-makers; specifically funders and the provincial government, as important actors in creating a future
where all British Columbians can access nutritiously dense and culturally appropriate food in a dignified manner.
RECOMMENDATIONS FUNDERS*
PROVINCAL
GOVERNMENT
1 Provide ongoing multi-year funding to food access organizations across BC
2 Increase staff salary allowances in grant application budgets
3 Standardize data collection and regularly produce reports related to food access
4
Develop a network of food access organizations to convene on similar practices
and include specialized training opportunities to network members
(i.e. Food Safe, Restorative justice, etc.)
5 Develop a specific strategy to support rural, remote and Indigenous communities
6
Find ways to include support for all organizations providing food access in
different planning and strategic documents throughout the provincial government
a. Build upon the mandate to increase food security overall by engaging with all
organizations providing food access in BC
b. Prioritize providing local food procurement contracts in the Ministry of Social
Development and Poverty Reduction’s mandate
*Defined as a person, group or organization that provides funding to pursue projects, events and activities of interest to the granting body. Funders include (but are not limited to):
organizations, businesses, philanthropists and governments.You can also read