FOOD AND NUTRITION SECURITY VULNERABILITY TO MAINSTREAM HYDROPOWER DAM DEVELOPMENT IN CAMBODIA - INLAND FISHERIES RESEARCH AND DEVELOPMENT ...
←
→
Page content transcription
If your browser does not render page correctly, please read the page content below
FOOD AND NUTRITION SECURITY VULNERABILITY TO
 MAINSTREAM HYDROPOWER DAM DEVELOPMENT
                IN CAMBODIA

    INLAND FISHERIES RESEARCH AND DEVELOPMENT INSTITUTE
                  FISHERIES ADMINISTRATION
       MINISTRY OF AGRICULTURE, FORESTRY AND FISHERIES
                          June 2013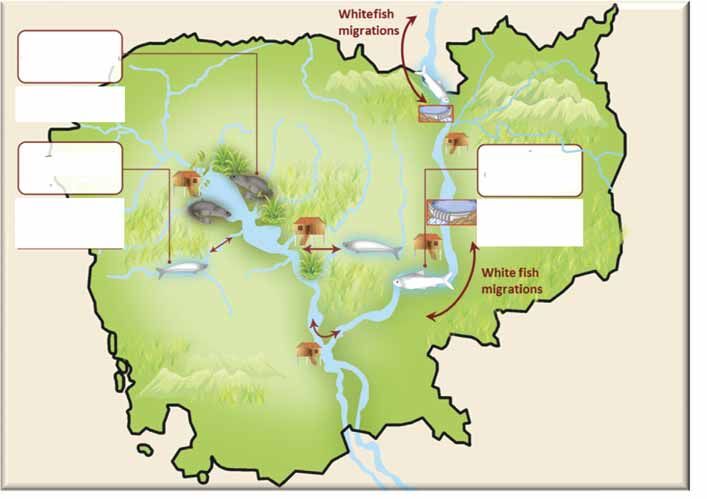
FOREWORD

F   or centuries the mighty Mekong has provided a secure source of food and nutrition to the peoples of South
    East Asia. In more recent times, the huge potential energy of the Mekong has also been seen as a source
of power, and many hydro‐electric schemes have been considered to tap the energy of this mighty river.
However, the potential to produce power and the resource to provide food are not entirely compatible. When
considering the requirements of today's population, wise decisions will need to be made in order to secure
the most benefits for the people of Cambodia. These decisions need to be based on sound, accurate facts.

This study has considered the likely impacts of building dams on the Mekong, using various scenarios based
upon current proposals and plans. These impacts include the likely effect of such dams on fish migrations to
and from spawning grounds; the subsequent effect on breeding and therefore fish stocks; the potential
changes to food security arising from changes to yields on capture fisheries, and lastly, the potential impacts
on the diet and nutrition, focusing particularly on those who depend on fish for essential elements of their
food intake.
Armed with this knowledge and a full understanding of the impacts of any decision to dam the Mekong,
Cambodia's leaders will be better prepared to properly weigh the consequences of their decisions.

The Fisheries Administration is grateful for the support received from development partners in carrying out
this study. DANIDA, Oxfam and WWF have generously provided funds to enable the work to be carried out.
I am also grateful for the close working partnership which developed between the FiA staff and these
organisations during the course of the study. This close working partnership enabled many problems to be
faced and inevitable obstacle to be overcome in a timely manner.

Prof. NAO THUOK Ph.D.
Delegate of the Royal Government of Cambodia,
Director General, Fisheries Administration,
Ministry of Agriculture, Forestry and Fisheries,
Kingdom of Cambodia

                                                                                                                 II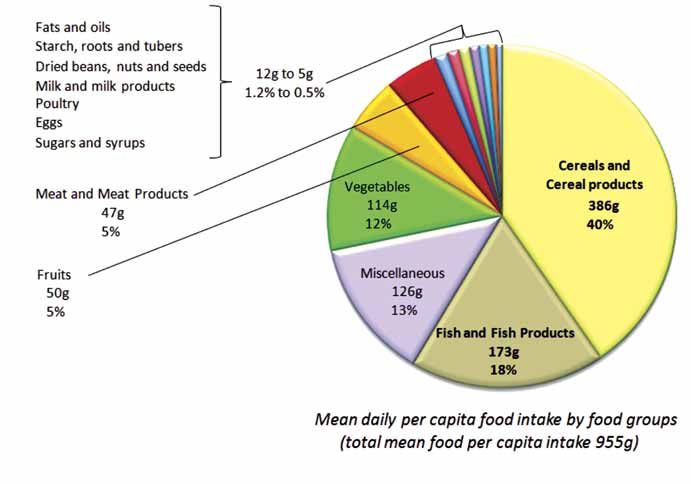
TABLE OF CONTENTS
FOREWORD………………………………………………………………..............………………………….…………..……………………………II

LIST OF TABLES……………………………………………………………….............………………………….….…..………………...…………. IV

LIST OF FIGURES……………………………………………………………………..............………………................………………………….V

ACKNOWLEDGEMENT……………………………………………………..............……………….................…………………………........VI

LIST OF ABBREVIATIONS…………………………………………………………..............………….................………………..………….VII

EXECUTIVE SUMMARY……………………………………………………………...............……………..............…………….………….VIII

1. INTRODUCTION………………………………………….......…………………….............……………................……………..…………1

2 MAIN FINDINGS……………………………………….......…...………………………………...........................………………..…………3
  2.1 IMPORTANCE OF FISH TO FOOD AND NUTRITION IN CAMBODIA.........................………………..…………......3
        2.1.1 The Cambodian diet ‐ food consumption.........…………..…………............................…..…………..…………3
        2.1.2 The Cambodian diet – energy and nutrition..............………………..........................................…………11
  2.2 FISH CATCHES DERIVED FROM THE CONSUMPTION STUDY………….............................................…………17
  2.3 ESTIMATED CHANGES OF THE SUPPLY/AVAILABILITY OF FISH AND OTHER AQUATIC ANIMALS UNDER
     CAMBODIAN DAM DEVELOPMENT SCENARIOS…………...................................................................…………19
        2.3.1 Modelling approach and hypotheses…………........................................................................…………19
        2.3.2 Predicted changes to capture fisheries yield………….............................................................…………23
        2.3.3 Predicted changes to the supply of aquatic resources for consumption…………...........................…25
  2.4 THE POTENTIAL IMPACT OF HYDROPOWER DAM DEVELOPMENT ON FOOD AND NUTRITION SECURITY
      IN CAMBODIA………….......................................................................................................................…………32
        2.4.1 Ecological zone impacts………….............................……................................................................……32
        2.4.2 Impacts on rural versus urban areas.....................……...............................................................……32
        2.4.3 Impacts by gender............................…….....................................................................................……32
        2.4.4 Impacts on age groups and pregnant women............................…….............................................…33

3 CONCLUSIONS............................……..........................................................................................................……34

Citation:
IFReDI 2013: Food and nutrition security vulnerability to mainstream hydropower dam development in
Cambodia. Synthesis report of the FiA/Danida/WWF/Oxfam project “Food and nutrition security vulnerability
to mainstream hydropower dam development in Cambodia”.Inland Fisheries Research and Development
Institute, Fisheries Administration, Phnom Penh, Cambodia.44 pp.

Report prepared by IFReDI, with inputs from R. Johnstone, E. Baran, Chheng P., Touch B.T., So N. and NaoThuok

                                                                                                                                                            III
LIST OF TABLES
Table 1: Average daily fish consumption (grams) per individual and percent of total food intake: Cambodia,
         2011       ...................................................................................................…….............................................4
Table 2: Average annual fish consumption of fish per person and per year. Cambodia, 2011.........................…5
Table 3 Proportion contribution of fish to energy and nutrient intake: Cambodia, 2011........................……........15
Table 4: Annual fish catch estimated from the present fish consumption survey........................……....................18
Table 5: Predicted loss of total yield in fish and other aquatic animals in the absence of any dam
         development............................…….............................................................…….........................................23
Table 6: Losses in yield of inland fish and other aquatic animals for each scenario compared to a scenario
         without mainstream dams. Percentages.....................................................……............................……..23
Table 7: Losses in yield of inland fish and other aquatic animals for each scenario compared to a scenario
         without mainstream dams. Tonnes.....................……..............................................……............................24
Table 8: Baseline situation and consequences of Cambodian mainstream dam construction on the
         availability and consumption of aquatic resources by 2030........................................................……......28

                                                                                                                                                                          IV
LIST OF FIGURES
    Figure 1: Average one‐day individual food intake (in grams) and percent of total food intake by groups:
               Cambodia, 2011............................…….....................................……..................…….....................................3
    Figure 2: Average daily per capita consumption of fish (in grams) per sub group.......................……......................4
    Figure 3: Fish sub‐groups as percentage of total fish intake............................……..................................................5
    Figure 4: Average daily per capita fish consumption disaggregated by inland and marine fish.......................…6
    Figure 5: Average daily consumption of fish per sub‐group and ecological zone.......................……........................7
    Figure 6: Average daily consumption of fish in rural and urban areas.......................…….........................................8
    Figure 7: Average daily consumption of inland fish disaggregated by sub‐groups and urban and rural areas........8
    Figure 8: Average daily consumption of inland fish disaggregated by sub‐group and gender.............................9
    Figure 9: Average daily per capita fish consumption by age.................................................................................10
    Figure 10: Average daily per capita fish consumption by fish sub‐group..............................................................10
    Figure 11: Fish as a percentage of total food intake..............................................................................................11
    Figure 12: Percentage contribution of food groups to total intake of protein by individuals............................12
    Figure 13: Percentage contribution of food groups to total intake of fats by individuals.....................................12
    Figure 14: Percentage contribution of food groups to total intake of iron by individuals.....................................13
    Figure 15: Percentage contribution of fish sub‐groups to total nutrition of households.....................................14
    Figure 16: Animal protein intake and breakdown of fish sub‐group contribution.................................................14
    Figure 17: Proportion meeting recommended daily allowances (RDAs) by age group and pregnant women:
               Cambodia, 2011.......................................................................................................................................16
    Figure 18: Fish groups, migrations and sensitivity to dam development...............................................................21
    Figure 19: Estimated spawning channel area (km2) accessible to white fish species under each
               development scenario and for each spawning habitat distribution hypothesis......................................22
    Figure 20: Predicted annual yield of inland fish and other aquatic animals under each development scenario
               and hypothesised distribution of long‐distance migrants’ spawning habitats.........................................25

V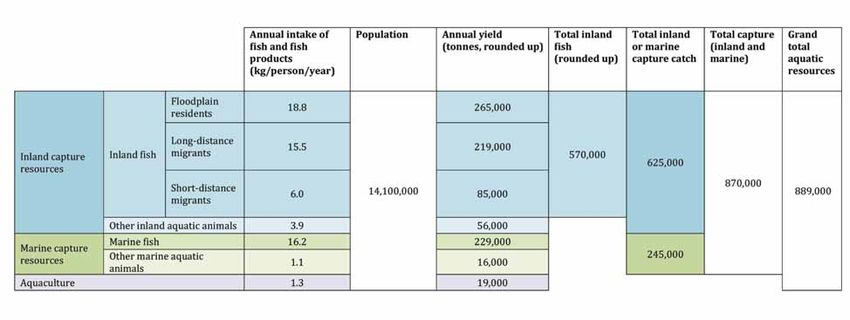
ACKNOWLEDGEMENT

The Fisheries Administration, Ministry of Agriculture Forestry and Fisheries wishes to thank all
stakeholders for their valuable contribution and collaboration in conducting the study on understanding
the “Food and Nutrition Security Vulnerability to Mainstream Hydropower Dam Development in
Cambodia”.
Special acknowledgement is given to Danida, OXFAM and WWF for financial and technical support in
conducting the study. Particular acknowledgement is extended to the leaders of the Ministry of Agriculture
Forestry and Fisheries for making this important research project possible.
We also wish to thank national and international experts, for their valuable input and hardwork to produce
this comprehensive document. Last but not least, we thank representatives from line Ministries,
Universities, Institutes, local authorities, local communities, NGOs, and civil society all of whom actively
provided inputs to validate the findings of this important study.

                                                                                                          VI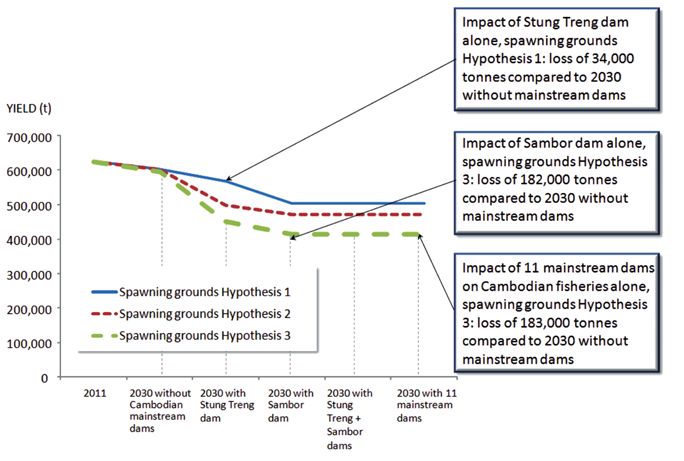
LIST OF ABBREVIATIONS

       Danida   : Danish International Development Agency
       DHA      : Docosahexaenoic acid
       EPA      : Essential Eicosapentaenoic acid
       FiA      : Fisheries Administration
       H1       : Hypothesis 1
       H2       : Hypothesis 2
       H3       : Hypothesis 3
       HPP      : Hydropower Project
       IFReDI   : Inland Fisheries Research and Development Institute
       LMB      : Lower Mekong Basin
       MD       : Mainstream dam
       MRC      : Mekong River Commission
       OAAs     : Other aquatic animals
       RDA      : Recommended daily allowance
       SB       : Sombor
       ST       : Stung Treng
       UMD      : Upper Mekong mainstream dam
       UNICEF   : United Nation Children's Emergency Fund
       WFP      : World Food Program
       WWF      : World Wide Fund for Nature

VII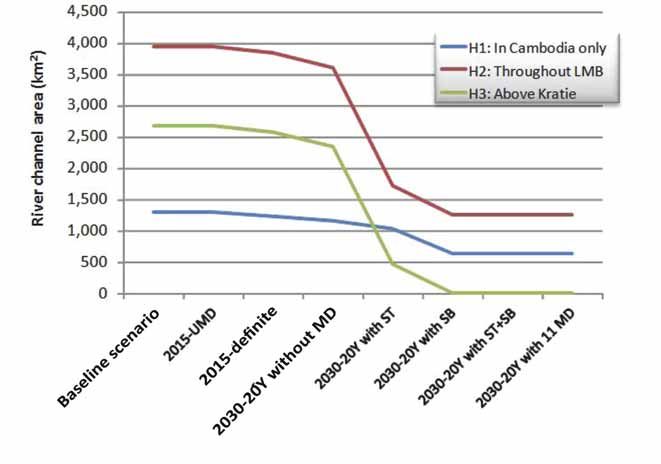
EXECUTIVE SUMMARY

T   he ‘Food and Nutrition Security Vulnerability to Mainstream Hydropower Dam Development in Cambodia’
    project examined national food and nutrition vulnerability arising from the potential construction of the Stung
Treng (ST) and Sambor (SB) dams.
This project consisted of three components: i) an assessment of the food consumption in households nationwide,
ii) an assessment of the impacts of Cambodian mainstream dams on fish yield, and iii) an assessment of the
impacts of Cambodian mainstream dams on fish consumption and food security in Cambodia. The project was
implemented, under IFReDI’s responsibility, from June 2011 to September 2012 by a multidisciplinary team
(hydrological modeller, dam specialist, fishery scientists, nutritionists, surveyors) supervised by an external
Technical Advisory Group.
The Household Food Consumption Survey was carried out in 1,200 households nationwide, in five of the ecological
zones in the country (Phnom Penh, Coastal, Plains, Plateau/Mountain and Tonle Sap) and was done taking into
consideration the stratification framework of the National Institute of Statistics for the National Census.

2011 BASELINE ASSESSMENT OF NUTRITION IN CAMBODIA
The purpose of this baseline was two fold: i) to assess the current food consumption and energy and nutrient
intake of Cambodians; ii) to assess the relative contribution to food and nutrition security made by three major
ecological groups of fish species of various sensitivity to dam development:
      ‐ floodplain residents or “blackfish” such as snakeheads (តោីរ៉ស់ តោីឆ្ដោ), which are resilient to dam impacts;
      ‐ short‐distance migrants or “greyfish” such as Kryptopterus chiveyi (តោីកំផ្លៀវស្ទឹង), which are restricted to
        local tributaries and are sensitive to dam development on tributaries and
      ‐ long‐distance transboundary migrants or “whitefish” such as Henicorhynchus spp. (តោីរៀល), which are
        very sensitive to dam development.
The contribution of other aquatic animals (OAAs) was also considered in this assessment.

Conclusions
The Cambodian diet is a combination of rice, fish and vegetables, reaching 955 grams per person per day.
Aquatic resources are the second largest dietary component at 173 grams per person and per day, accounting
for 18% of the total food intake. Aquatic resources are also the major contributor of animal protein intake1 (76%,
of which half is freshwater capture fish).
Inland fish consumption amounts to 110 g/person/day or 40.3 kg/person/year, while that of marine fish reaches
16.2 kg/person/year. The consumption of other aquatic animals (marine + freshwater) is 5.1 kg/person/year. The
smallest contribution to the diet comes from the aquaculture sector, with 1.3 kg/person/year only (2%). These
results are consistent with the results of the previous fish consumption studies in Cambodia.
Of the inland fish, floodplain resident fish (i.e. black fish) comprise 30% of total fish intake, followed by
long‐distance transboundary migrants (whitefish) very sensitive to dam development (25% of total fish intake).
The overall per capita consumption of floodplain resident fish is relatively higher than other fish categories due
to their availability throughout the year.
In the Cambodian diet, rice is the major energy contributor (60% of the total energy intake), followed by aquatic
resources (12% to the total energy intake). Fish and other aquatic animals contribute 37% of total protein intake
per person, 28% of total fats intake per person and 37% of total iron intake per person. As the overall intake of
fat in the Cambodian diet is very low, the fat and protein contributed by fish is very important. The survey results

1
    All foods of animal origin (for example: meat, eggs, dairy)
                                                                                                              VIII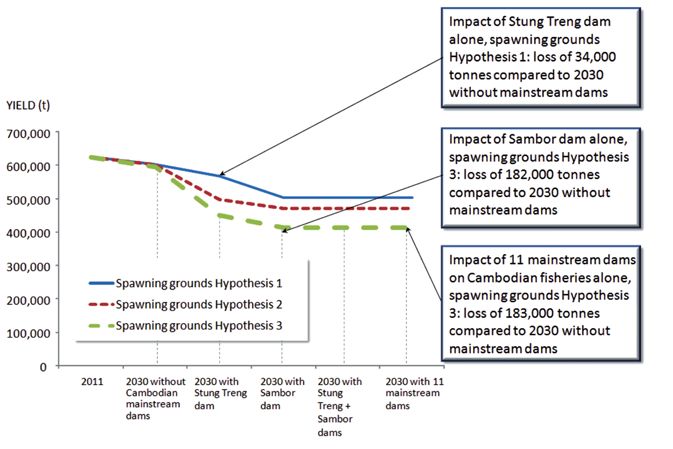
also show that only 25% of the population have the necessary levels of energy and only 19% have the required
levels of iron.
Across all ecological zones, fish and fish products are generally eaten more than any other of the body building
foods such as meat or poultry. Higher consumption of fish is observed in the Coastal and Tonle Sap ecological
zones, while the lowest consumption is observed in the Mountains and Plateaus.
In terms of gender, the consumption of fish and fish products by men and women is similar.
Disaggregation by age group shows that the consumption pattern is the same for all age classes; only the quantity
consumed varies. Proportionately, pre‐school children have their fish intake dominated largely by inland fish and
fish products. Adolescents and pregnant women are also relatively more dependent on the availability of inland
fish for their overall food security.

ASSESSMENT OF FISH CATCHES BASED ON THE CONSUMPTION STUDY
The individual fish consumption figures above multiplied by the current Cambodian total population
(i.e.14,100,000 persons) indicates that the yield of inland fish amounts to 570,000 tonnes per year. When
complemented by other aquatic animals, this amounts to 625,000 tonnes of inland capture resources harvested
each year. These results are consistent with previous estimates.
Marine resources amount to 254,000 tonnes per year (more specifically 229,000 tonnes of fish and 16,000 tonnes
of other marine aquatic animals).
This brings the figure for capture fisheries to 870,000 tonnes per year, and the grand total for aquatic resources
in Cambodia to 889,000 tonnes per year (including 19,000 tonnes of aquaculture products).
Impact of mainstream dams on the fish yield
The study built into a model:
       ‐ the predicted future yields of inland fish and other aquatic animals;
       ‐ the predicted future quantities from the aquaculture sector and from imports;
       ‐ the losses from non‐consumptive disposal (exports, utilization for aquaculture feed and fertilizer, and
         post‐harvest waste);
       ‐ the expected changes in river hydrology and accessible wetland habitats, and;
       ‐ the population growth.
for each development scenario and for each hypothesis about reservoir production yield.

Conclusions
In 2030 the human population of Cambodia is expected to reach 20 million (+43%), which will be the most
significant obstacle to improve or sustaine food security.
In the absence of mainstream dams and regardless of population growth, the increased output from the
aquaculture sector and forecasted declines in exports will be balanced by losses experienced by capture fisheries
in response to dam development on tributaries and irrigation development in the lower part of the basin (i.e.
loss of wetlands producing capture fish). The supply of aquatic resources appears relatively insensitive to the
level of aquaculture production from dam reservoirs. Thus the aquaculture sector would not compensate for
losses to supply arising from Cambodian mainstream dam impacts.
Given the population growth, the relative stability of the farmed fish supply and the decline of the capture fish
yield for reasons other than mainstream dams (i.e. 4‐5% decline), the study predicts fish consumption will be
reduced by 30.6% by 2030 even in the absence of mainstream dams.

  IX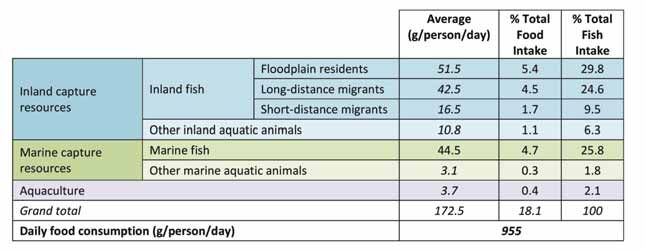
The development of the Stung Treng dam alone is predicted to reduce yields of fish and other aquatic animals by
6% to 24% or 34,000 – 145,000 tonnes.
The Sambor dam alone is predicted to reduce yields of fish and other aquatic animals by 16% ‐ 31 % or 98,000 –
182,000 tonnes compared to 2011 baseline values.
The combination of the Stung Treng and Sambor dams is predicted to reduce yields of fish and other aquatic
animals by a similar amount (98,000 – 182,000 tonnes) because the Sambor dam alone would then block all fish
migrations upstream (maximum impact regardless of other upstream dams).
Mainstream Cambodian dams are therefore predicted to reduce the supply of inland fish and other aquatic
animals by between 34,000 to 182,000 tonnes from the baseline values. The uncertainty range depends mainly
upon the hypothesized distribution of long‐distance migrants’ spawning habitat, which highlights the importance
of new research on spawning areas.

Predicted annual yield of inland fish and other aquatic animals under each development scenario and hypothesized
distribution of long‐distance migrants’ spawning habitat.

IMPACT OF MAINSTREAM DAMS ON THE FISH CONSUMPTION
The model developed for the study integrates all the factors driving the production of overall aquatic resources
(i.e. capture yields, aquaculture production, imports, exports and losses) and their trends up to 2030.
When all the fish production factors and the population growth are integrated, the future consumption of aquatic
resources per capita is expected to decline even in the absence of dams.

                                                                                                            X
In the absence of mainstream dams, the per capita supply of inland fish and OAAs is expected to decline from
approximately 63 kg per capita in 2011 to approximately 44 kg per capita by 2030.
However the construction of Cambodian mainstream dams would reduce this supply by a further 6 to 34%
depending on the scenario considered. This would result in fish consumption dropping to 29‐41 kg/person/year
(as opposed to 63 kg/person/year in 2011).
IMPACT OF MAINSTREAM DAMS ON FOOD SECURITY AND HEALTH
The above results imply that after the construction of the mainstream dams there will be a further reduction of
the already low number of individuals who have adequate levels Recommended Daily Allowance (RDA) of energy,
protein and iron.
A reduction of 34% of the available fish and fish products for consumption would have a dramatic impact on the
proportion of the population living in the plains who are able to obtain their RDA, and who are already considered
as the least nutrient‐secure ecological zone.
A reduction in the availability of fish and specifically of long‐distance migrants, which is important for the provision
of iron, would have a strong detrimental impact on the rural population driving iron security even lower and
posing a risk to public health.
Children, especially in rural areas, will also be directly affected by the reduction of inland fish availability. School
children could be considered as the most food‐insecure age group. The data on pregnant women’s nutrition
shows that they are the most vulnerable group to protein reduction, with the lowest rate of protein RDA
satisfaction.
Therefore, the predicted reduction of per capita supply of inland fish and OAAs is expected to result in:
‐ negative effects on public health that affect strongly some of the most vulnerable population groups,
such as those living in remote rural areas and school children;
‐ aggravation of existing malnutrition and creation of more people who cannot obtain the recommended
daily allowance of key nutrients, thus exposing more people to health risks.
XI1
INTRODUCTION
The ‘Food and Nutrition Security Vulnerability to Mainstream Hydropower Dam Development in Cambodia’
project examined national food and nutrition vulnerability arising from the potential construction of the Stung
Treng (ST) and Sambor (SB) dams.
The project was co‐funded by the Fisheries Administration, World Wild Fund for Nature (WWF), Oxfam and
DANIDA. The research activities were coordinated by the Inland Fisheries Research and Development Institute
(IFReDI) of the Fisheries Administration.
This project consisted of three components: i) an assessment of the food consumption in rural households
nationwide, ii) an assessment of the impacts of Cambodian mainstream dams on fish yield, and iii) an assessment
of the impacts of Cambodian mainstream dams on fish consumption and food security in Cambodia. The project
was implemented from June 2011 to September 2012 by a multidisciplinary team (hydrological modeller, dam
specialist, fishery scientists, nutritionists, surveyors) supervised by an external Technical Advisory Group.
The project took into consideration the five ecological zones in the country; namely, Phnom Penh; Plains (Kandal,
Kampong Cham, Prey Veng, Svay Rieng and Takeo provinces); Tonle Sap (Banteay Meanchey, Kampong Thom,
Battambang, Pursat, Kampong Chhnang and Siem Reap provinces); Plateau/mountains (Kampong Speu, Kratie,
Pailin, Mondul Kiri, Otdor Meanchey, Preah Vihear, Ratanak Kiri, and Stung Treng provinces); and the Coastal zone
(Kep, Preah Sihanouk, Koh Kong, and Kampot provinces).
The household food consumption survey focused on indicators of food security, taking a representative sample
of households nationwide consisting of 1,200 households.
The project built upon previous studies by improving and updating estimates of fish consumption and yield for
Cambodia and by disaggregating these estimates according to ecological zone and province, and by the three
groups (guilds) of fish species (floodplain residents, short‐distance migrants and long‐distance migrants). The
project also employed the latest hydrological and fisheries impact models available for the region.
This allowed for a more refined assessment of dam impacts on food and nutrition security in Cambodia,
accounting for the differences in the impact vulnerability of the three major fish group types. The study represents
the first attempt to undertake a food consumption survey at the national level. The results provide valuable food
and nutrition security data relevant to other development projects and programs both nationally and regionally.
The current report is a summary of the findings of the two main scientific reports of the project:
‐ Touch Bunthang, Chheng Phen, So Nam, Wilma Hurdata, and Nao Thuok. 2012. Baseline Assessment of
Diet and Nutrition in Cambodia 2011. Report for the project “Food and nutrition security vulnerability to
mainstream hydropower dam development in Cambodia“, Inland Fisheries Research and Development
Institute (IFReDI), Fisheries Administration, Phnom Penh, Cambodia. 124 pp.
‐ Halls A.S., Chheng Phen, So Nam, and Nao Thuok. 2012. Impacts of mainstream dams on fish yield and
consumption in Cambodia. Report for the project “Food and nutrition security vulnerability to mainstream
hydropower dam development in Cambodia“, Inland Fisheries Research and Development Institute
(IFReDI), Fisheries Administration, Phnom Penh, Cambodia. 90 pp.
1FISH GROUPS IN THE MEKONG AND SENSITIVITY TO DAM DEVELOPMENT Three main fish groups (or “guilds”) having very different migration patterns are to be distinguished. The group of floodplain residents or “blackfish” is made of species with limited lateral migrations and no longitudinal migrations; these tough fish do not leave floodplains and wetlands, and spend the dry season in local ponds. This group includes Channidae (Snakeheads), Clariidae, Bagridae or Anabantidae. It is not very sensitive to dam development. The group of long‐distance migrants or “whitefish” is made of species that undertake long‐distance migrations, in particular between lower floodplains and the Mekong mainstream. This group includes many cyprinids (e.g. Henicorhynchus spp. and Cirrhinus sp.) but also most Pangasidae catfishes. This group is very sensitive to dam development, in particular on the mainstream. The group of short‐distance migrants or “greyfish” is made of species that are not grey in colour but ecologically intermediate between the two previous groups; this group corresponds to fishes that do not spend the dry season in floodplain ponds, but do not undertake long‐distance migrations either. When the flood recedes, they leave the floodplain and tend to spend the dry season in local tributaries. This group is sensitive to dam construction on tributaries, but not on the mainstream. Examples of blackfishes: Examples of whitefishes: Examples of greyfishes: Anabas testudineus Cirrhinus siamensis Belodontichthys truncatus Channa striata Paralaubuca typus Mystus albolineatus Clarias batrachus Pangasius krempfi Kryptopterus cheveyi 2
2
MAIN FINDINGS
2.1 IMPORTANCE OF FISH TO FOOD AND NUTRITION IN
CAMBODIA
2.1.1 THE CAMBODIAN DIET ‐ FOOD CONSUMPTION

T   he Cambodian diet is a combination of rice, fish and vegetables in this order of consumption at both individual
    and household levels. The total average daily per capita2 food consumption is 955 grams per person per day
(Figure 1).

Fish and fish products intake (from both inland and marine sources, plus aquaculture and other aquatic animals)
is the second largest dietary component at 172.5 grams per person per day, accounting for 18% of the total food
intake.

Figure 1: Average one‐day individual food intake (in grams) and percent of total food intake by groups:
Cambodia, 2011

Inland fish, which includes floodplain residents, long‐distance migrants and short‐distance migrants, is consumed
at 110.5 grams or 11.6% of the total food intake and two‐thirds (64%) of the total consumption of fish and aquatic
animals. Other freshwater aquatic animals represent 10.8 g/person/day or 6.3% of the total fish intake. In
2
    Per capita = per person
                                                                                                             3
comparison, marine fish (including Other marine Aquatic Animals ‐ OAAs) is consumed at 47.6 grams per person
and per day or 5% of the total food intake and just over one‐fourth (27.6%) of the total fish intake (Table 1).
Therefore, inland fish is consumed in much larger quantities than marine fish.
Table 1: Average daily fish consumption (grams) per individual and percent of total food intake: Cambodia, 2011
Of the inland fish, floodplain residents are consumed more than
Fish and fish products is the second
any other type of fish at 51.5 grams per person and per day,
largest dietary component at 173
which is 5% of the food intake and 30% of the total fish intake.
grams per person per day;
This dominant category is followed by long‐distance migrants
(42.5 g/person/day), short‐distance migrants (16.5 g/person/ Floodplain resident fishes are con-
day) and aquaculture fish (3.7 g/person/day). One of the sumed more than any other type of
reasons for the higher consumption of floodplain residents is fish, followed by whitefish;
that they are available all year round, while long‐distance Aquaculture intake represents 2.1%
migrants are seasonal. While floodplain residents are consumed of the total fish intake, which is
mainly fresh, long‐distance migrants are also largely processed lower than the contribution of any
into products such as fish sauce, fish paste, or fermented and/or other fish or other aquatic animals
smoked. group to food intake
Aquaculture fish is the least consumed at 3.7 grams, which represents 0.4% of the total food intake and 2% of
the total fish intake only. Intake of inland OAAs is higher than intake of aquaculture fish at 10.8 grams (Figure 2).
Figure 2: Average daily per capita consumption of fish (in grams) per sub group
4Figure 3 shows the percentage of each fish sub‐group in terms of total fish consumption, clearly demonstrating
the importance of inland fish and the proportion of both floodplain residents and long‐distance migrants as part
of fish and fish products consumption.
When these daily figures are converted to annual
figures, Cambodian people consume on average 63 kg
of fish and aquatic products (fresh water fish, marine
fish and other fish products) per person and per year.
The consumption of inland fish amounts to 40.3
kg/person/ year, while that of marine fish reaches
16.2 kg/person/ year. The consumption of all inland
capture resources (i.e. harvested freshwater fish and
other freshwater aquatic animals) reaches 44.3
kg/person/year. The overall consumption of other
aquatic animals (marine + freshwater) is substantial,
at 5.1 kg/person/year, i.e. 8% of the consumption of
all aquatic products, and is four times more important
than the consumption of aquaculture products (1.3
kg/person/year only).
Figure 3: Fish sub‐groups as percentage of total fish intake
Table 2: Average annual fish consumption of fish per person and per year. Cambodia, 2011
These results are very much in line with the results of the previous fish consumption studies in Cambodia:
‐ Ahmed et al. (19983) found an average per capita consumption of fresh inland fish of 43.5 kg per year.
‐ Hortle (20074) found 36.8 kg/person/year of inland fish and other inland aquatic animals consumed,
while the current study finds 44.3 kg/person/year (i.e. 20.3% more). The difference can be explained by
the fact that Hortle’s figure includes a number of extrapolations for provinces not surveyed, whereas the
present study has national coverage.
3
Ahmed M., Hap Navy, Ly Vuthy, Tiongco M. 1998 Socioeconomic assessment of freshwater capture fisheries in
Cambodia: report on a household survey. Mekong River Commission, Phnom Penh, Cambodia. 186 pp.
4
Hortle K.G. 2007 Consumption and the yield of fish and other aquatic animals from the Lower Mekong Basin. MRC
Technical Paper No.16, Mekong River Commission, Vientiane, Lao P.D.R. 87 pp.
52.1.1.1 CONSUMPTION OF FISH ACROSS ECOLOGICAL ZONES Across all ecological zones fish and fish products are generally eaten more than Across all ecological zones any other of the body building foods such as meat or poultry. Higher fish and fish products are consumption of all kinds of fish (i.e. marine + freshwater) is observed in the generally eaten more than Coastal area at 247.5 grams and Tonle Sap area due to their proximity to large any other of the body fishing areas. The lowest consumption is observed in the Mountains and building foods such as Plateaus zone at 143.2 grams per day (Figure 4). meat or poultry; Figure 4: Average daily per capita fish consumption disaggregated by inland and marine fish Consumption of inland fish including OAAs is higher than consumption of marine fish across all ecological zones except for the coastal area. The highest consumption of inland fish and OAAs is in the Tonle Sap zone at 147.9 grams/person/day while the lowest is in Mountain and Plateaus at 89.4 grams per capita per day. Consumption is similar in Phnom Penh and Coastal areas at 104 and 105.1 grams per capita per day, respectively. High consumption of inland fish is also observed in the Plains zone at 134.6 grams per capita per day. The breakdown of the composition of the inland fish consumed shows that floodplain residents are consumed the most in the Tonle Sap (77.2 grams per capita per day), Coastal (60.1 grams per capita per day) and Phnom Penh (45.2 grams per capita per day) zones. Long‐distance migrants are consumed more in the Plains (58.5 grams per capita per day) and the Mountains and Plateau areas (32.7 grams per capita per day). These differences reflect the fish consumption patterns, with floodplain residents eaten fresh or whole whereas long‐distance migrants are often processed. People in mountainous areas away from water bodies naturally consume more processed fish such as dried fish and fish paste (prahoc). Aquaculture fish is consumed least across all the different ecological zones and consumption of OAAs is higher than the consumption of aquaculture fish everywhere except in Phnom Penh (Figure 5). 6
Figure 5: Average daily consumption of fish per sub‐group and ecological zone

Marine fish is naturally consumed more in the Coastal area at 134.8 grams per capita per day, followed by
Mountain and Plateau areas at 51.8 grams per capita per day. The Phnom Penh and Tonle Sap areas feature similar
consumption rates at 48.4 grams and 41.8 grams per capita per day, respectively. The lowest intake of marine
fish is recorded in the Plains zone at 25.4 grams per capita per day.
Distance from the coast and purchasing power are among the main factors that influence accesses to marine
fish; hence, consumption of marine fish is higher in the larger urban areas such as Phnom Penh, Battambang and
Siem Reap.

2.1.1.2 CONSUMPTION OF FISH IN URBAN VERSUS RURAL AREAS

In urban areas the total average food intake is 962.3 grams per person per day of
which 180.7 grams is fish. In rural areas the total average food intake per person per   Fish comprises
                                                                                        18% of total food
day is 909 grams, of which 164 grams is fish. In both cases, fish comprises about 18%
                                                                                        intake in both rural
of the total food intake.                                                               and urban areas
Consumption of inland fish including aquaculture fish and OAAs is slightly higher in
rural areas at 127.2 grams than in urban areas at 122.7 grams per capita per day.
Consumption of marine fish in urban areas is higher at 52.96 grams, while in rural areas it is much lower at 35.7
grams per capita per day (Figure 6).

                                                                                                            7
Figure 6: Average daily consumption of fish in rural and urban areas The breakdown of inland fish consumption shows that people eat floodplain residents Inland fish and more than any other fish both inside and outside urban areas, and is closely followed whitefish in by the consumption of long‐distance migrants, especially in rural areas. The higher particular is consumption of long‐distance migrants in rural areas could be at least partly attributed consumed more in to the ability to store the processed long‐distance migrants for longer periods of time rural areas even in the absence of cold storage. Aquaculture fish is the least consumed among inland fish in both rural and urban areas at 2.9 grams and 4.5 grams per capita per day, respectively (Figure 7). Figure 7: Average daily consumption of inland fish disaggregated by sub‐groups and urban and rural areas 8
2.1.1.3 CONSUMPTION OF FISH ACCORDING TO GENDER

Figure 8: Average daily consumption of inland fish disaggregated by sub‐group and gender

In terms of weight, males consume marginally more fish at 180.4 grams per capita per day than females at 166
grams per capita per day (probably in proportion to body weight). However, fish and fish products account for a
similar proportion in the diet of both genders (19% of total food intake for females and 18% for males
respectively). Consumption of OAAs is higher than the consumption of aquaculture fish for both genders
(Figure 8).

2.1.1.4 CONSUMPTION OF FISH ACCORDING TO AGE

Disaggregation by age group shows that across all ages, the majority of fish and fish products consumed by each
of the age groups are from inland origin (Figure 9).
The 20‐59 year olds are the biggest consumers of fish and fish products at 196.2 grams per day. Proportionally,
pre‐school children also have their fish intake dominated largely by inland fish and fish products. Pregnant women
consume 190.7 grams of fish and fish products per day, 160.9 grams of which is from inland origin.

                                                                                                           9
Figure 9: Average daily per capita fish consumption by age In terms of consumption of the different inland fish‐subgroups according to age, the data shows that floodplain residents dominate in the composition of inland fish and fish products consumption. However, it is closely followed by the amount of long‐distance migrants consumed across all ages (Figure 10). Generally speaking, the consumption pattern is the same for all age classes; only the quantity consumed varies. Figure 10: Average daily per capita fish consumption by fish sub‐group 10
Adolescents and pregnant women eat more inland fish than any of the other age groups in terms of a percentage
of their total food intake, which makes them more dependent on the availability of inland fish for their overall
food security (Figure 11).

Figure 11: Fish as a percentage of total food intake

2.1.2 THE CAMBODIAN DIET – ENERGY AND NUTRITION

In the Cambodian diet, rice and fish are the most frequently eaten food groups. Rice is consumed almost three
times a day and fish about two to three times a day.
As the dominant food group in the Cambodian diet, rice is the major energy contributor with about 1,095 kcals
or 60% of the total energy intake, followed by aquatic resources contributing about 12% to the total household
energy intake in a day.
However, fish and fish products are the main contributors of protein5 at 36.59% of total intake per capita, fats at
27.8% of total intake per capita, and iron at 37.3% of total intake per capita (Figure 12, Figure 13, Figure 14).
Rice is the second biggest contributor of protein at 35% of the total intake per capita, 17% of the fats, and 32%
of the iron per capita.

                                  FISH AND FISH PRODUCTS CONTRIBUTE:
                                37% of total intake of PROTEIN per person
                                     28% of total FAT intake per person
                                    37% of total IRON intake per person

5
 Protein–from both animal and plant origins

                                                                                                            11
Figure 12: Percentage contribution of food groups to total intake of protein by individuals Figure 13: Percentage contribution of food groups to total intake of fats by individuals 12
Figure 14: Percentage contribution of food groups to total intake of iron by individuals

                                                                              Whitefish accounts for 12%
In terms of the contribution of different fish sub‐groups to nutrition, the
data shows that floodplain residents contribute 11.7% of the total daily       of total household fat intake
household protein intake, followed by long‐distance migrants with 9.5%        Whitefish accounts for 21%
(Figure 15).                                                                  of total household iron
In addition, about one‐fourth (27%) of the total household fat intake comes   intake
from fish consumption, with long distance‐migrants accounting for the
largest share (11.8%).
Further to this, long‐distance migrants account for 20.9% of the total household iron intake almost one‐third
(34%) of which is contributed by fish.
This data demonstrates the importance of fish, and long‐distance migrants in particular, to the protein and
especially fat and iron intake in the Cambodian diet.

                                                                                                         13
Figure 15: Percentage contribution of fish sub‐groups to total nutrition of households Aquatic resources are the major contributor of animal protein intake6 with more than three‐fourths (76%) of the total animal protein intake. Meat and meat products together with poultry contribute less than one‐fourth of the total animal protein intake with about 20% and 4%, respectively. Thus, as already established in the section above, fish is the main contributor of the macronutrients, protein, fats and the micronutrients especially iron. Among the fish sources, inland fish contributes the most to animal protein intake, at 55%. Floodplain residents provide the highest percentage (about 23%) followed by long‐distance migrants (19%) while aquaculture fish contributes the least with only about 2%. Marine fish together with other aquatic animals from marine sources contribute almost 21% (Figure 16 below). Figure 16: Animal protein intake and breakdown of fish sub‐group contribution 6 All food of animal origin (for example: meat, eggs, dairy) 14
In terms of the different ecological zones, the contribution of fish to total animal protein intake varies. In the
Tonle Sap zone, fish accounts for 76% of the total animal protein intake with inland fish accounting for 58% of
the total fish intake. Those living in Mountains & Plateaus also consume more fish than other animal protein
sources, with fish accounting for 70% of total animal protein intake, while meat and meat products contribute
only 24%, and poultry 6%. In the Coastal zone, marine fish accounts for 25% of the total fish intake.
In Phnom Penh, fish contributes relatively less to animal protein intake, accounting for 66% of the total. This is
due to the relatively higher intake of meat and meat products (26%) and poultry (8%) compared to those living
in the other ecological zones.
The data on the role of fish in nutrition shows that fish is the major contributor to protein, fat and iron intake in
the Cambodian diet. In addition, it also provides 12% of the total energy intake by individuals (Table 3).
Table 3: Proportion contribution of fish to energy and nutrient intake: Cambodia, 2011
                         Energy and Nutrients             % Of Total Individual Intake
                         Energy (Kcal)                                 12%
                         Fats (g)                                      28%
                         Protein (g)                                   37%
                         Iron (g)                                      37%

The most important role of fish in terms of energy is the fact that when energy needed by the body cannot be
supplied by rice and other carbohydrate‐rich foods, the body metabolizes the protein from fish to sustain its
caloric needs for the proper functioning of various physiological and biochemical processes such as digestion and
metabolism.
As the overall intake of fat in the Cambodian diet is very low, the fat
                                                                          89% of people obtain
and protein contributed by fish is very important. The low fat intake of
                                                                          recommended levels of PROTEIN,
Cambodians is the reason for the low calorie levels, which result in
                                                                          and aquatic resources contribute
protein‐calorie deficiency (marasmus) and is the major reason for
                                                                          37% of this protein intake
stunted growth and development in Cambodia.
                                                                          Only 25% of people obtain
Disaggregating by ecological zone, adequate energy intake is highest
                                                                          recommended levels of ENERGY,
when consumption of energy‐giving foods, body‐building foods and
                                                                          and aquatic resources contribute
fish is also high as in the case of Coastal areas where adequate levels
                                                                          about 12% of this intake
are obtained by about half (52%) of the households. This zone can
therefore be considered to be the most food secure.                       Only 19% of people obtain
                                                                          recommended levels of IRON, and
Households in other ecological areas have lower levels of adequate
                                                                          aquatic resources represents 37%
energy intake—along with lower consumption of energy‐giving foods
                                                                          of this intake
and fish—ranging from one‐fifth (21%) to about more than one‐fourth
(28%). The least food secure are the Tonle Sap and the Plains areas, where only one‐fifth (21%) of individuals
obtain adequate levels of energy.
The nutrition survey data also shows that adequate protein intake is high with 89% of individuals obtaining the
required levels. This high result reflects the impact of fish on nutrition, which outweighs by far any other
protein‐rich food, as fish contributes more than half (55%) to the total individual animal protein intake.
However, the data also shows that only 25% of the population obtains the necessary levels for energy and only
19% obtains the required levels for iron. There are no established levels for intake of fats in Cambodia; however,
intake levels are recognized as low.

                                                                                                              15
An analysis of the number of children and women who obtain the Recommended Daily Allowance (RDA) shows that in terms of energy, school children have the lowest rate of RDA satisfaction. For iron levels, the under 5 year olds and pregnant women are amongst the most deficient; and finally in terms of proteins, pregnant women are the most vulnerable group (Figure 17). Figure 17: Proportion meeting recommended daily allowances (RDAs) by age group and pregnant women: Cambodia, 2011 Therefore, while the low adequacy levels for energy and iron are a concern, the intake of fats must also be highlighted. ‘Fats’ are an important dietary component, which in the context of the Cambodian diet, are directly linked to the supply of fish. The fat of fish contains essential Omega‐3 and 6 fatty acids such as linoleic and linolenic acids, precursors of the essential eicosapentaenoic acid (EPA) and docosahexaenoic acid (DHA). These nutrients are not synthesized by the body and must be obtained from food. DHA in particular –‘Smart fat’–is a key compo‐ nent of the phospholipids membranes of the eyes and brain and is essential for brain and eye development in infants and children; it also reduces heart disease, lowers blood pressure, and strengthens the immune system. DHA is essential for normal growth and development, healthy skin and reproduction. 16
2.2. FISH CATCHES DERIVED FROM THE CONSUMPTION STUDY

A   ccording to the Cambodian National Institute for Statistics, the estimated population of Cambodia was
    12,014,343 in 2000 and is expected to grow to 15,104,768 by 2015. This gives a figure of 14,095,147 people
in 2011 (rounded up to 14,100,000). The total fish yield can be derived by multiplying the individual fish
consumption figures above by the total population (Table 4).
Thus, the latest catch estimate, based on the current study, amounts to 570,000 tonnes of inland fish per year.
When complemented by other aquatic animals, this amounts to 625,000 tonnes of inland capture resources
available for consumption each year.
These results are very much in line with previous estimates:
      ‐ In 2011 according to national statistics, the catch reached 490,000 tonnes (i.e. 16% difference only);
      ‐ According to Hortle (20077), the average inland fish catch in Cambodia, estimated from other
        consumption studies, amounts to about 482,000 tonnes (and 587,000 tonnes when other aquatic animals
        are included). However, we must highlight that this figure includes conservative extrapolations for
        provinces that are not covered in Hortle’s review but that are covered in the current study; and
      ‐ In their 2008 study encompassing the previously overlooked production of black fish (i.e. local resident
        fish species) in rainfed rice fields, Hortle et al; 20088. came to the conclusion that the total fish production
        in Cambodia would range between 524,000 and 616,000 tonnes per year of fish and other aquatic
        animals.

7
 Hortle K.G. 2007 Consumption and the yield of fish and other aquatic animals from the Lower Mekong Basin.
MRC Technical Paper No.16, Mekong River Commission, Vientiane, Lao P.D.R. 87 pp.
8
  Hortle K.G., Troeung R., S. Lieng 2008 Yield and value of the wild fishery of rice fields in Battambang Province,
near the Tonle Sap Lake, Cambodia. MRC Technical Paper No. 18, Mekong River Commission, Vientiane, Lao
P.D.R. 62 pp.

                                                                                                                17
18
Table 4: Annual fish catch estimated from the present fish consumption survey2.3 ESTIMATED CHANGES OF THE SUPPLY/AVAILABILITY OF FISH
AND OTHER AQUATIC ANIMALS UNDER CAMBODIAN DAM
DEVELOPMENT SCENARIOS
2.3.1 MODELLING APPROACH AND HYPOTHESES
T he total quantity of fish and OAAs available for consumption in Cambodia was estimated from the yield of
fish and OAAs from inland (i), marine (m) and aquaculture (a) adjusted for imports (I), exports (E), waste (W),
other utilisation (U), using the following formula:
C=(Yi+Ii‐Ei‐Wi‐Ui)+(Ym+Im‐Em‐Um)+Ya+Ia‐Ea‐Wa‐Ua)Eq.1
The available figures were reviewed in detail to obtain the current baseline and the 2030 possible forecasts for:
‐ Yield of inland fish and Other Aquatic Animals (Yi)
‐ Other sources and disposal of fish and OAAs
‐ Yield of marine fish and OAAs (Ym);
‐ Yield from aquaculture (Ya);
‐ Exports (E);
‐ Imports (I);
‐ Other utilisation (U);
‐ Waste (W)
in order to assess the amount of fish actually accessible to people for consumption. Thus, the model does not
only focus on river fish, but on all sources of fish (including marine fish and aquaculture fish) and other freshwater
and marine aquatic animals.
The project also reviewed:
‐ dam development scenarios until 2030
‐ the baseline area of fish habitats (rivers, floodplains and rain‐fed wetlands);
‐ the proportions of white, grey and black fish in the total fish yield (inland fish yield, imports and sources
of disposal were disaggregated by the three main guilds of fish (i.e. whitefish/greyfish/blackfish) to
account for differences in their response to dam development in the river system)
‐ estimates of dam reservoir fish production
‐ estimates of Cambodian human population size and growth
then modelled, for 2030 and the three hypotheses regarding the distribution of spawning sites basinwide (see
below):
‐ the impacts of each development scenario on fish habitat area and accessibility;
‐ the hydrological consequences of each dam development scenario and its impacts on the flood index
(FI), flood timing and duration (these parameters were shown to be important to fish production)
‐ the yield created by dam reservoirs
All these parameters were then integrated into the model in order to predict for each dam development
scenario:
‐ the change in total fish yield in 2030 compared to the baseline;
‐ the total quantity of fish and OAAs available for consumption, integrating predicted future quantities of
fish and OAAs from the aquaculture sector, imports and disposal (exports, utilisation for aquaculture
feed and fertilizer, and post‐harvest waste).
19Three hypotheses concerning the distribution of long‐distance migrants’ spawning habitat in the main channel
and its tributaries (excluding the Tonle Sap River and Lake) were considered in the assessment:
Hypothesis 1: All spawning habitat is uniformly distributed in main channels and tributaries of Cambodia (low
impact scenario).
Assuming that long‐distance migrants spawn only in river channels in Cambodia, the total area of river channels
available for spawning under the baseline (1,310 km2) would decline by a maximum of almost 50%. Tributary
dams would remove approximately 11% of the spawning area by 2030. An additional 10% of the channel area
would be removed by the Stung Treng HPP, while Sambor would remove approximately 40% of the available area.
Hypothesis 2: Spawning habitat is uniformly distributed in main channels and tributaries throughout the Lower
Mekong Basin (medium impact scenario).
Dams are expected to deny long‐distance migrants access to
upstream spawning and refuge habitats. Therefore, the Dams will deny long-distance migratory
aggregated yield of long‐distance migrant species is assumed to fish access to spawning grounds
vary linearly with the available spawning habitat area (SHA). The yield of long-distance migratory fish
is in direct relation to the availability
Under the hypothesis that long‐distance migrants’ spawning
of spawning grounds
habitat exists throughout the Lower Mekong Basin,
approximately two‐thirds of the spawning area would be lost if Sambor HPP is developed, compared to a 56%
loss for Stung Treng HPP. Relatively minor losses (less than 10%) of spawning area would be expected from the
development of tributary dams by 2030.
Hypothesis 3: All spawning habitat is uniformly distributed in main channels and tributaries of the LMB above
Kratie (high impact scenario).
Under the hypothesis that all spawning habitat for long‐distance migrant species exists upstream of Kratie, modest
(approximately 12%) reductions to the baseline spawning habitat area would be expected from tributary dam
development by 2030. However, the development of Stung Treng HPP would deny access to the majority (more
than 80%) of the spawning area, while the development of Sambor HPP would effectively remove all long‐distance
migrants’ spawning area from the system.
20You can also read