Food-scanner applications in the fruit and vegetable sector
←
→
Page content transcription
If your browser does not render page correctly, please read the page content below
LANDTECHNIK 76(1), 2021, 52–67

DOI:10.15150/lt.2021.3264

Food-scanner applications in the fruit and
vegetable sector
Simon Goisser, Sabine Wittmann, Heike Mempel

In the past few years, portable and smartphone-based diagnostic technologies have found
their way into the agri-food industry. The aim of this research was to evaluate the perfor-
mance of portable near-infrared (NIR) spectrometers, so called food-scanners, with regard to
their predictive accuracy of important quality parameters of fruit and vegetables. Food-scan-
ner measurements were performed in combination with destructive measurements of the
corresponding quality trait (sugar content, dry matter, relative water content) on a wide range
of produce from the fruit and vegetable assortment. This study evaluated dry matter content
of apple, avocado, blueberry, table grape and tangerine, which yielded cross validation re-
sults (r²) of up to 0.95, 0.87, 0.94, 0.92 and 0.92 respectively. Furthermore, the evaluation of
food-scanner spectra for the prediction of sugar content of blueberry, kiwi, mango, persim-
mon, table grape, tangerine and tomato yielded cross validations (r²) of up to 0.95, 0.84, 0.80,
0.75, 0.95, 0.93, and 0.87. Furthermore, relative water content of ginger obtained a cross val-
idation correlation of r² = 0.91. The results show that these traits can be predicted with a high
degree of accuracy using non-destructive measurements performed with three commercially
available food-scanners SCiOTM, F-750 Produce Quality Meter, and H-100F. Consequently,
food-scanners can be used as objective measurement tools along the supply chain of fresh
produce to quickly determine fruit quality. In addition, a practical example shows the poten-
tial of these instruments for non-destructive quality assessment in incoming goods control
at fruit and vegetable wholesalers over a time period of several weeks. Furthermore, possible
areas of application of food-scanners along the supply chain of fresh produce are discussed,
possibilities for practical applications are presented and time-saving means are highlighted.

Keywords
NIR spectroscopy, food-scanner, non-destructive measurement, quality control

Near-infrared (NIR) technology has many specialist areas of application today. A common application is
in the control of chemical, petrochemical and pharmaceutical products. Within the chemical industry,
NIR spectrometers are also used in process control and for incoming goods inspection of raw materials.
Another area of NIR application is waste separation, where a wide variety of composites and types of
plastic are detected and separated through sorting lines. Furthermore, NIR technology is used in pro-
cess control in the food industry and in the quality analysis of agricultural products (Pasquini 2003).
Within these fields of application and in addition to the control of products for human consumption,
quality determination of raw materials is of particular importance. NIR spectrometers therefore are
used for quality measurements of cereals, flour, and milk. Further raw products such as feed are ana-
lyzed for moisture, protein and raw fiber content using these devices. The technology is also suitable
for determining the water content in numerous agricultural products (Cozzolino 2009). Various pre-

received 15 August 2020 | accepted 23 December 2020| published 24 March 2021
© 2021 by the authors. This is an open access article distributed under the terms and conditions of the Creative Com-
mons Attribution License (http://creativecommons.org/licenses/by/4.0).
LANDTECHNIK 76(1) 53

vious experiments on horticultural produce illustrated the potential of using NIR spectroscopy for the
prediction of important fruit quality parameters, e.g. sugar content and acidity in apples, oranges, kiwi-
fruit, peaches, as well as kiwifruit dry matter and firmness of peaches and kiwifruit (Wang et al. 2015).
Within the last few years, mobile smartphone-based diagnostic technologies have found their way
into the agri-food sector. Those devices could replace expensive and bulky laboratory equipment in
the near future. Various start-up companies are involved in the development of these measurement
tools (Rateni et al. 2017). In particular, the technology of miniaturized and portable NIR spectrosco-
py has great potential in various areas of application due to its non-destructive use and the link to
machine-learning algorithms. Individual companies are already targeting applications in the food in-
dustry. They refer to their spectrometers as food-scanners, which provide information on the nutrient
content, allergens and contaminations and are intended to determine relevant information on food
fraud, food counterfeiting and food quality within a few seconds (Spectral Engines 2020, Tellspec
2020). Other companies are focusing slightly larger yet portable NIR devices specifically designed
for the measurement of internal quality parameters such as sugar content and dry matter of various
kind of fruit (Felix Instruments 2020, Sunforest 2020). First scientific studies, which employed
these portable and miniaturized instruments, indicate good performance and prediction results for a
variety of produce and quality parameters, e.g., dry matter content of apple, kiwifruit and stone fruit
(Kaur et al. 2017), dry matter and oil content of avocado (Ncama et al. 2018), dry matter and sugar
content of mango (Santos Neto et al. 2017), and sugar content of pear (Choi et al. 2017).
 A recent qualitative study conducted with actors of the German fresh produce supply chain high-
lights the potential that these food-scanners could unlock by facilitating future quality control on
various levels along the supply chain through non-destructive, objective and fast measurements (Go-
isser et al. 2020a).

Measurement procedure and data collection of important quality attributes within
the assortment of fruit and vegetables
In order to evaluate the applicability of these new types of devices within the practice of fruit and
vegetable trade, food-scanners were tested on a large range of available produce within the fruit and
vegetable retail sector. Additional fruit and vegetables, of which the application of NIR spectrometers
for the prediction of quality traits have not yet been thoroughly researched in the scientific literature
(e.g., blueberry, ginger), were analyzed during the course of these studies. Further special features,
such as the prediction of relevant quality parameters of thick-skinned fruit (e.g., mango, avocado,
citrus fruit) as well as the non-destructive measurement through packaging film were taken into
account. Experiments focused on the two quality parameters sugar content and dry matter, as these
quality traits often serve as indicators for ripeness and eating quality of fruit. In case of ginger, rela-
tive water content of tubers was examined as indicator of freshness.
 Fruit analyzed during the course of this research are listed in Table 1. Batches of different size of
apple, avocado, blueberry, kiwi, mango, persimmon, table grape, and tangerine were purchased from
local retail stores as well as fruit wholesale and analyzed at laboratories of the University of Applied
Sciences Weihenstephan-Triesdorf in Freising, Germany. In order to obtain the widest possible range
of the respective quality parameters of interest, care was taken to integrate different fruit qualities
when produce was procured (Table 1). Additional measurements for the determination of quality
parameters through packaging film of table grapes and tomatoes were performed during incoming
LANDTECHNIK 76(1) 54

goods control of a German fruit and vegetable trading company. For the measurement of ginger, fresh
plant material of a local plant nursery was obtained and transported to University facilities for sub-
sequent analysis.
 During the course of these studies, three commercially available miniaturized and hand-held NIR
spectrometers were used: the SCiOTM (version 1.2, Consumer Physics, Hod HaSharon, Israel); the
F-750 Produce Quality Meter (Firmware v.1.2.0 build 7041, Felix Instruments, Portland, USA) and the
H-100F (Sunforest, Incheon, Korea). All three devices measure in direct contact with fruit samples
and utilize interactance mode, therefore only light transmitted through the sample tissue is detected
and more information about the actual sample composition and constituents is obtained (Pasquini
2003). The obtained spectra are used to calculate absorbance spectra, which then is utilized for fur-
ther analysis. The detailed characteristics and operating parameters of these food-scanners, such as
spectral resolution and sampling interval, have been elaborately described by Kaur et al. (2017).

Table 1: Products and respective quality parameters examined in this study including reference methods and the
source of quality variation

 Product Quality parameter Reference method Source of variation in quality
 Apple Dry matter Drying oven Integration of various cultivars
 Avocado Dry matter Drying oven Combination of different fruit calibres
 and origins
 Blueberry Dry matter / Brix Drying oven / refractometer Pooling of various origins and growing
 methods (traditional / organic)
 Ginger Water content Weight loss measurement Examination of freshly harvested
 ginger during convective drying
 Kiwi (green & gold) Brix Refractometer Merging of fruit with differences in
 external appearance
 Mango Brix Refractometer Combination of air freighted and
 traditionally transported fruit
 Persimmon Brix Refractometer Pooling of various origins and growing
 methods (traditional / organic)
 Dry matter / Brix / Drying oven / refractometer Incorporation of various cultivars and
 Table grape (green) Brix through PE film origins
 Tangerine Dry matter / Brix Drying oven / refractometer Integration of various cultivars
 Tomato Brix through PE film Refractometer Combination of various cultivars, types
 (cherry, salad) and origins

 In order to develop NIR prediction models, the first step was the collection of NIR fruit spectra
using the respective food-scanner. In contrast to measurements under laboratory conditions, all ex-
periments were performed under condition as realistic and practically relevant as possible. Various
factors, such as differences in ambient and fruit temperature (e.g., 4 °C - 22 °C) and variations in
lighting conditions, which are often found in incoming goods control of wholesalers and retailers,
were therefore integrated into these prediction models. For mango, avocado, tangerine, tomato, apple,
kiwi and persimmon, the exact location of spectra collection was used for subsequent reference meas-
urement, whereas for table grapes, blueberries and ginger one spectra per specimen was taken and
the whole berry/tuber was used for reference measurement afterwards. For measurements through
packaging film, small pre-cut polyethylene (PE) film samples were placed between fruit sample and
food-scanner during the recording of spectra.
LANDTECHNIK 76(1) 55

 Spectra collected with the F-750 was transferred from the SD-Card to a computer for further
chemometrical analysis using the associated Model Builder Software (version 1.3.0.192 BETA). Ac-
cording to the manufacturer, the software applies non-linear iterative partial least squares (NIPALS)
regression and uses the leave-one-out method for cross validation. Absorbance spectra in second
derivative form in the wavelength range 729 – 975 nm was utilized for building of prediction models,
since these settings are used as standard by the software.
 Similarly, absorbance spectra recorded with the SCiOTM was correlated to fruit quality parame-
ters using the cloud-based browser application The Lab (Consumer Physics). The cloud application’s
default pre-processing settings of spectra were used in this study, namely logarithm, averaging all
four scans per sample, first derivative (window of 35 and polynom degree of 2), selecting the full
wavelength range from 740 - 1070 nm and subtracting the average. The application uses every tenth
spectra for cross-validation. The algorithm was set to partial least square regression (PLSR) and addi-
tional options for outlier detection as well as additional filters were disabled.
 For the H-100F, recorded spectra were exported from the Sunforest H-100 Laboratory Programm
(Sunforest). The device provides absorbance spectra in second derivative form in the wavelength
range from 650 – 950 nm. Due to the lack of evaluation software provided by the manufacturer, spec-
tra were analyzed with the multivariate data analysis software The Unscrambler® (version 10.5.1,
Camo, Oslo, Norway). The H-100F was only used for the evaluation of tangerines, and the two scans
per fruit were averaged prior to multivariate analysis. Following the procedure of the F-750, no fur-
ther pre-processing was applied, and 20 random samples were used for cross-validation.
 Coefficient of correlation after cross-validation (r²CV) as well as the root mean square error after
cross-validation (RMSECV) derived from the respective software were used for performance evalua-
tion of the various prediction models (Table 2).
 The determination of reference values of the respective quality parameters was performed imme-
diately after collection of fruit spectra. Sugar content in terms of Brix was analyzed by cutting out the
area of spectra collection (in case of table grapes and blueberries the whole berry was used), squeez-
ing the fruit tissue with a garlic press and measuring the mixed juice with a digital refractometer
(HI 96801, Hanna Instruments, Woonsocket, USA). Dry matter of the area of spectra collection was
measured gravimetrically (for table grapes and blueberries whole berries were analyzed). Fresh fruit
tissue was weighed and subsequently dried in an oven at 45 °C (avocado) and 80 °C (table grape,
blueberry, tangerine, apple) for 48 h. The final dry weight was used for calculation of dry matter as
the percentage of dry weight to initial wet weight of each specimen. In order to determine the rela-
tive water content of ginger, small tubers fresh from the nursery were examined. Measurement was
performed on five consecutive days during which tubers were stored at room temperature (19.8 °C ±
0.9 °C) and relative humidity of 48% ± 3%. After collection of food-scanner spectra, tubers were
weighed, and the current weight noted. At the end of day five, dry weight of tubers was determined
gravimetrically by drying the tubers in an oven at 80 °C for 48 h. Relative water content was then
calculated using the equation provided by Ceccato et al. (2001), on the assumption that fresh tubers
showed full turgor weight on day one:

 �
 �
 �
LANDTECHNIK 76(1) 56

Performance of prediction models for fruit quality parameters
Prediction results with respect to r²CV and RMSECV obtained from multivariate analysis for every
quality parameter and respective food-scanner are listed in Table 2.
 Overall, the correlation of spectra with sugar content of fruit yielded good results. Prediction mod-
els of high accuracy (r²CV > 0.90) were obtained for blueberries (Figure 1A) and table grapes. Like-
wise, the measurement through thick-skinned fruit such as tangerines provided very good results.
Further good correlations of sugar content were obtained for mango and kiwi (r²CV = 0.78 - 0.84),
whereas the prediction of persimmon sugar content yielded better results using the F-750 (r²CV =
0.75) compared to the SCiOTM (r²CV = 0.63). Nevertheless, all values of root mean square errors (RM-
SECV), which serve as indicator of prediction error, ranged from 0.36 to 0.92 °Brix and can therefore
be deemed acceptable for a non-destructive evaluation of fruit quality. Results from this study are
comparable to findings reported in the literature, such as the determination of sugar content of kiwi
(McGlone and Kawano 1998), mango (Schmilovitch et al. 2000), table grapes (Donis-González et
al. 2020) and tangerines (McGlone et al. 2003a) using NIR spectrometers.

Table 2: Performance of selected food-scanners in predicting internal fruit quality of various types of fruit using PLS
algorithm. r²CV: r² of cross-validation; RMSECV: root mean square error of cross-validation; PC: principal components

 Product Parameter F-750 SCiOTM H-100F n r²CV RMSECV PC
 Apple1
 Dry matter X 100 0.95 0.53 6

 Avocado2 Dry matter X 195 0.85 1.50 6
 Dry matter X 195 0.87 1.42 16
 Blueberry1 Brix X 275 0.90 0.68 9
 Brix X 275 0.95 0.47 12
 Dry matter X 100 0.92 0.59 7
 Dry matter X 100 0.94 0.51 6
 Ginger2 Relative water content X 150 0.91 6.44 5
 Kiwi (green)1 Brix X 120 0.84 0.63 8
 Kiwi (gold) 1 Brix X 120 0.78 0.80 7
 Mango1
 Brix X 140 0.80 0.58 6

 Persimmon1 Brix X 45 0.75 0.76 5
 Brix X 45 0.63 0.92 3
 Table grape (green)1 Brix X 80 0.94 0.51 7
 Brix X 150 0.95 0.57 5
 Brix (through PE film) X 75 0.93 0.65 7
 Dry matter X 80 0.92 0.55 7
 Dry matter X 160 0.92 0.46 4
 Tangerine1 Brix X 80 0.93 0.36 6
 Dry matter X 174 0.92 0.53 5
 Tomato1
 Brix (through PE film) X 177 0.87 0.57 7

1) Various cultivars used for model building 2) Individual cultivars used for model building
LANDTECHNIK 76(1) 57

 Prediction models for sugar content in persimmon obtained the lowest accuracy in our study. These
results are inferior to previous literature reports (Jannok et al. 2014). Additionally, we examined the
predictive capability of table grape sugar content through packaging film with the F-750 and obtained
prediction models similar to those without packaging (Figure 1B). Similarly, the determination of toma-
to sugar content through packaging film yielded prediction models of comparable performance to those
reported in earlier experiments (Goisser et al. 2018). A thorough literature review showed that the
prediction of internal quality parameters of fruit through packaging material has not yet been studied.

 20
 A 24
 B

 Predicted sugar content (°Brix)
 18
 Predicted sugar content (°Brix)

 16 20

 14
 16
 12

 10
 r²CV = 0.90 r²CV = 0.93
 RMSECV = 0.68 12
 RMSECV = 0.65
 8

 6 8
 6 11 16 8 12 16 20 24
 Measured sugar content (°Brix) Measured sugar content (°Brix)

 30 120
 Predicted dry matter content (%)

 C D
 Predicted rel. water content (%)

 26 100

 22 80

 18 60

 r²CV = 0.85 r²CV = 0.91
 14 40
 RMSECV = 1.50 RMSECV = 6.44

 10 20
 10 14 18 22 26 30 20 40 60 80 100 120
 Measured dry matter content (%) Measured rel. water content (%)

Figure 1: Correlation between NIR food-scanner spectra and quality parameter for A) sugar content of blueberries;
B) sugar content of grapes through packaging film; C) dry matter content of avocado; D) relative water content of
ginger

 Prediction models developed for dry matter content in various types of fruit yielded good results
(r²CV = 0.85 - 0.95). Models of high accuracy could be derived for dry matter of apples, blueberries, ta-
ble grapes and tangerines (r²CV > 0.92; RMSECV = 0.46 - 0.59). Our prediction models derived for dry
matter in apples are superior to findings of Møller et al. (2013) and similar to results of McGlone et
al. (2003b). Results from our experiments yielded better correlations for the prediction of table grape
dry matter compared to findings reported in the literature (Donis-González et al. 2020), whereas the
performance for dry matter prediction in intact tangerines was analogous to results of Guthrie et al.
(2005). The portable devices used in our study performed good in predicting dry matter of blueberries
(r²CV > 0.92). However, no comparable reports were found for dry matter prediction of blueberries
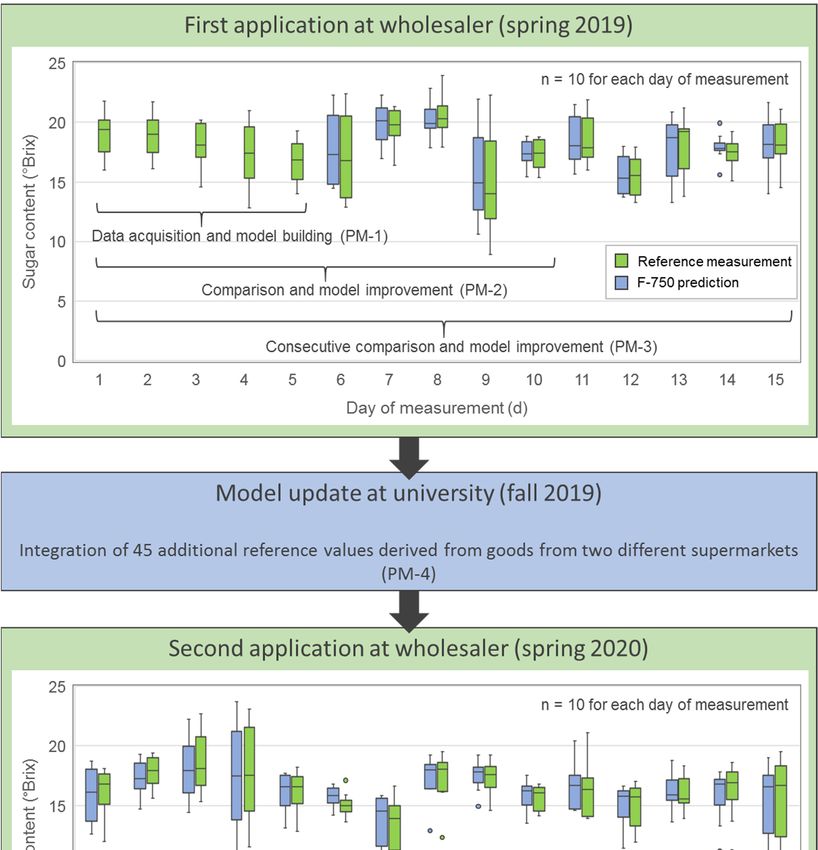
LANDTECHNIK 76(1) 58

within the scientific literature. The prediction of dry matter content of avocado (Figure 1C) resulted
in models of slightly lower accuracy (r²CV = 0.85 - 0.87) and higher prediction errors (RMSECV = 1.42
- 1.50). This slight deviation in model accuracy compared other fruit could be explained by the dark
skin of avocados, since a large part of NIR radiation is intercepted, which results in loss of spectral
information. Nevertheless, our findings are in line with results achieved by Olarewaju et al. (2016)
for the prediction of avocado dry matter.
 The determination of the relative water content of ginger (Figure 1D) obtained good results (r²CV
= 0.91; RMSECV = 6.44). Comparable findings have been reported by Li et al. (2011) by applying PLS
models and using a laboratory spectrometer for the determination of moisture content in ginger.
 For almost all quality parameters examined, in particular sugar content and dry matter of various
important fruit types, the developed prediction models yielded a high and therefore practical accu-
racy. In most cases, relatively small sample sizes were used to create prediction models. With regard
to the utilization of these devices along the fruit and vegetable supply chain, the creation of new and
separate prediction models is easy and can be realized quickly. It should be noted that the number of
principal components has been automatically chosen by the respective software, which in some cases
(e.g. avocado dry matter and blueberry sugar content for SCiOTM) resulted in a very high number of
PLS factors. Additionally, the models were validated using cross-validation from the same sample set.
Due to the variability within some of the presented prediction models as well as the high number of
PCs, validation with external samples must be performed to guarantee model robustness for practical
applications. This is especially important if quality is predicted for fruit varieties or fruit origins not
yet present within the sample pool.

Validation in practice – utilizing a food-scanner for incoming goods control
In order to demonstrate the potential of food-scanners for the quality assessment during incoming
goods control, a practical experiment was carried out. For this purpose, the F-750 Produce Quality
Meter from Felix Instruments was selected in coordination with the fruit trader and used in two con-
secutive years within an incoming goods quality control department of a German fruit trader for the
prediction of table grape sugar content. Table grapes are usually marketed as a type of produce with
no particular focus on cultivars. Therefore, the GLOBALG.A.P. number (GGN) was used as principal
indicator of grapes emanating from different producers and therefore of different orchard origin. The
procedure is described in Figure 2, the performance of the various prediction models built during the
experiment is shown in Table 3. In order to illustrate the time saved by using a food-scanner, the time
required for destructive and NIR measurements was recorded and compared (Table 4).
 In a first step, data was collected during three consecutive weeks of quality assessment in the
spring of 2019. Within the first week, NIR spectra of ten green table grapes per day were recorded
and the respective sugar content was measured destructively using a digital refractometer (HI 96801,
Hanna Instruments, Woonsocket, USA). Using the resulting 50 reference values and fruit spectra, a
first prediction model (PM-1) was developed with the software provided by Felix Instruments (Model
Builder Software version 1.3.0.192 BETA). During the second week of quality assessment, NIR predic-
tions for sugar content of ten green table grapes were performed and the actual sugar content of each
table grape was destructively determined with the refractometer. As illustrated by the comparative
Boxplot in Figure 2 only slight deviations between F-750 predictions and destructive measurements
of the overall daily quality could be detected.
LANDTECHNIK 76(1) 59

Table 3: Performance of various prediction models built with the F-750 Produce Quality Meter and Model Builder
Software for the prediction of table grape sugar content during the practical experiments. r²CV: r² of cross-validation;
RMSECV: root mean square error of cross-validation; r²V: r² of validation by external samples; RMSEV: root mean
square error of validation by external samples

 Model label No. of cultivar No. of GLOBALG.A.P. numbers n r²CV RMSECV r²V RMSEV
 PM-1 2 3 50 0.87 0.74 0.75 0.84
 PM-2 2 5 100 0.96 0.56 0.93 0.65
 PM-3 2 9 150 0.95 0.57 - -
 PM-4 2 13 195 0.95 0.52 0.92 0.77
 PM-5 2 19 345 0.93 0.62 - -

Figure 2: Procedure for utilizing the F-750 Produce Quality Meter for the non-destructive measurement of sugar
content of green table grapes during incoming goods control at a German fruit wholesaler
LANDTECHNIK 76(1) 60

 The additional data collected during the second week was used for the improvement of the first
prediction model (PM-1), which led to the building of a second prediction model (PM-2) using the
provided software.
 During the third week, the procedure from the second week was repeated. The comparison be-
tween F-750 prediction and destructive measurement showed high conformity (Figure 2). At the end
of the third week of the first experiment part, all data was pooled in a third prediction model (PM-3).
 In preparation for the next practical application, the third prediction model (PM-3) was updated at
the University of Applied Sciences Weihenstephan-Triesdorf in the fall of 2019 by adding 45 addition-
al spectra and reference values of green table grapes bought from two different local supermarkets.
Data was again pooled and a fourth prediction model was developed (PM-4).
 In the spring of 2020, the updated prediction model (PM-4) was again used during quality assess-
ment of incoming goods at the same wholesale company for a second three-week practical experiment.
Every day, fruit spectra, NIR predictions for sugar content and destructive reference measurements
of ten green table grapes were performed and recorded. Analog to the first practical application, the
NIR prediction model in 2020 was updated weekly by integrating the recorded spectra and reference
values. As indicated by the second Boxplot in Figure 2, the second experiment initially showed only
a slight deviation of prediction and reference values. The overall coverage of the daily fruit quality
using non-destructive NIR predictions can be described as very satisfying. Furthermore, the contin-
uous improvements resulted in an increase of conformity of NIR prediction values and real reference
values towards the end of the three-week period. At the end of the second practical experiment, all
data was aggregated in a final fifth model (PM-5). The models PM-1 and PM-2 developed in 2019 have
been tested for model robustness using the data of the consecutive week for model validation. Simi-
larly, PM-4 was validated using the data collected in 2020 (Table 3).
 In an additional experiment the time needed to measure the sugar content of 25 table grapes
via refractometer and food-scanner was recorded and compared (Table 4). An essential advantage of
the NIR measurements is the fact that the measurements can be carried out non-destructively and
directly on the working platform and therefore no additional working time is required for cleaning
of equipment and transport to an adjacent laboratory. Furthermore, no additional equipment (e.g.,
paper towels, knife, cutting board, deionized water) is needed when measurements are performed via
food-scanner compared to a refractometer.

Table 4: Comparison of the time required for sugar measurements using refractometer and NIR-device

 Measurement procedure Refractometer F-750 Produce Quality Meter
Number of samples 25 25
Measurement time / sample (s) 30 15
Time for cleaning and transport / sample (s) 15 0
Total time (min) 18:45 6:15

 The presented experiment illustrates the great potential of portable and miniaturized NIR food-scan-
ners for a non-destructive quality assessment of internal fruit quality during incoming goods control.
As shown on the example of table grapes, the creation of new prediction models is easy and can be
realized quickly by utilizing the software provided by device manufacturers. Furthermore, the exper-
iment demonstrated that prediction models of high accuracy built for specific type of fruit can be used
LANDTECHNIK 76(1) 61

at a later time while still showing high conformity with destructive measurements. Moreover, fruit
of origin previously not included within the data pool, as illustrated through the growing number of
new producers, could be predicted with high accuracy. Treating this new data as samples for external
validation resulted in high model robustness for PM-2 and PM-4. In addition, the experiment shows
that prediction models can be updated quickly and easily at any time by entering small new data sets.
Compared to conventional destructive measurements, which are usually necessary to determine the
respective quality parameters, food-scanners are comparatively easy to handle and demonstrated to
save valuable working time. In addition, fewer produce has to be destroyed for quality assessment.
The ability to measure non-destructively through the packaging film with high prediction accuracy,
as indicated in previous experiments (Table 2) makes these devices attractive for use along the fruit
and vegetable supply chain. Although only a practical validation for the prediction of table grape sug-
ar content is shown in this study, we assume that it is similarly feasible for other fruits at reasonable
expense. Thus, a practical application could become quite realistic for the future. In order to guaran-
tee model robustness and prediction accuracy, a periodic validation and re-calibration is necessary.

Potential applications along the supply chain of fruit and vegetables
Based on our findings there are numerous possible applications for food-scanners along the fresh
produce supply chain.
 At the producer level, food-scanner can be used to monitor fruit quality during growth and matur-
ing of fruit. Due to the portability of these devices, some of the relevant ripening parameters can be
determined directly on the plant and harvest predictions can be derived at an early stage. Further-
more, harvesting operations in large orchards can be better coordinated. Certain manufacturers of
portable NIR devices have specialized in this area of application and already offer devices specifically
designed for various types of fruit (Felix Instruments 2020). Therefore, important ripening parame-
ters such as sugar content and dry matter of tropical fruit (e.g., avocado, mango, kiwi) can be predict-
ed in a non-destructive way. Once these products have been transported, food-scanners can be used to
verify fruit quality at the next level of the supply chain. Some produce, especially fruit from overseas,
are ripened in special ripening facilities just after arrival in the importing country. The possibility
of non-destructive quality assessment enables fruit wholesalers to better control and organize these
post-ripening processes.
 During incoming goods control of fruit and vegetables at wholesale companies, defined quality
criteria must be satisfied. For various types of fruit, statutory minimum requirements are specified
(Table 5). Compliance with these standards and additional requirements imposed by retail chains is
necessary for an efficient marketing of produce within the European market (UNECE 2019). However,
these parameters can often not easily be determined, especially in the case of packaged produce. As
stated in the latest draft of the OECD guidelines, NIR spectrometers comprise the ability to simul-
taneously predict various fruit quality parameters from a single NIR spectrum, therefore serving
as “multidimensional predictors of consumer acceptance” (OECD 2018). The prediction results of
various quality parameters using food-scanners in our studies indicate the potential of food-scanners,
however further validations have to be performed. Following this, several quality parameters of fruit
types provided with limited values could be predicted in a non-destructive way with high accuracy
(e.g., avocado, kiwi, table grape, citrus). As we demonstrated for table grapes and tomatoes, there is
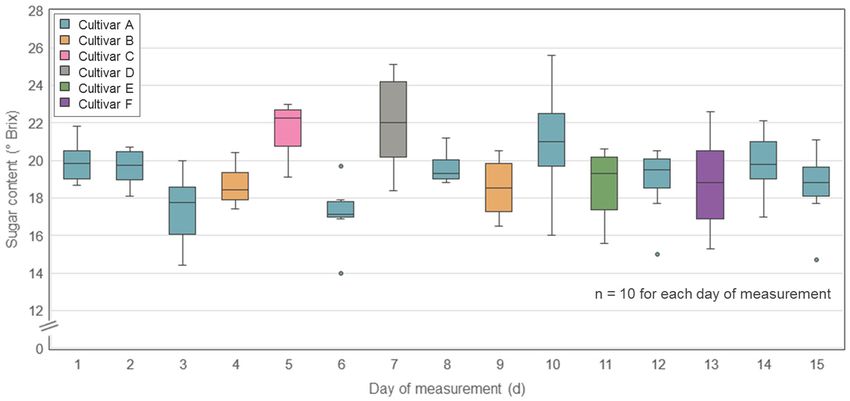
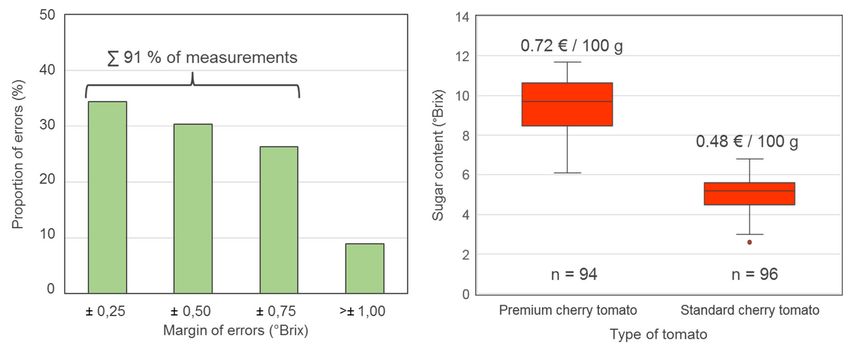
LANDTECHNIK 76(1) 62

great potential for the assessment of fruit quality through packaging film, which could facilitate in-
coming goods control even further.

Table 5: Overview of fresh fruit and vegetables with specific limits of fruit quality parameters according to the United
Nations Economic Commission for Europe (UNECE 2019).

 Produce Limiting parameter Respective document number (UNECE 2019)
 Apple Brix FFV-50
 Avocado Dry matter FFV-42
 Citrus fruit Brix, sugar/acid ratio, juice content FFV-14
 Kiwi Brix, dry matter FFV-46
 Melon Brix FFV-23
 Peach, Nectarine Brix, firmness FFV-26
 Pineapple Brix FFV-49
 Table grape Brix, sugar/acid ratio FFV-19
 Watermelon Brix FFV-37

 Portable NIR spectrometers can be integrated into the practical quality control process and the
quality of produce can be examined on site directly on the pallet. On the one hand, workflow can be
facilitated, which on the other hand saves valuable working time. Additionally, the application of
food-scanners allows better objective, reliable and thus comparable quality recording in contrast to
oftentimes subjective evaluations by test personnel (Goisser et al. 2020a).
 An extensive evaluation of the data that was recorded during incoming goods control of a German
fruit and vegetable wholesaler shows the additional benefit of implementing NIR food-scanners. In
this way, the daily recorded an already digitized values can be used to identify differences in delivered
produce quality non-destructively, as illustrated by predictions of the F-750 Produce Quality Meter
(Figure 3A). In order to protect the anonymity of the cooperation partner, the varieties are not listed in
detail in the example shown. The comparison of the destructively determined and non-destructively
measured sugar content values of table grapes during our incoming goods control experiment showed
that the vast majority of the measured values (> 90%) were within an error range of ± 1 °Brix (Figure
3B). During incoming goods control at wholesalers, a reliable statement about the averaged sample is
more relevant than the quality of a single product. Therefore, the accuracy determined in our experi-
ments can be deemed appropriate for the determination of averaged values of a larger sample. Due to
this measurement accuracy, fluctuations in the course of the season, individual supplier performance
and quality differences depending on the region of origin can be recorded quickly. If necessary, ap-
propriate measures (e.g., special advertising, discount campaigns) can be initiated.
 Food-scanners can also be used for end-consumers as well as retail stores to distinguish entry-level
products from premium products within the assortment of fruit and vegetables. Differences between
these products are often primarily communicated through the layout and design of packaging. We
used the data collected during the course of our incoming goods control project and combined the
destructively recorded sugar contents of different commercial tomato varieties with the respective
retail prices (Figure 3C). As illustrated, fruit qualities that can be clearly distinguished from one an-
other are already offered at different prices. Oftentimes, these differences in internal fruit quality are
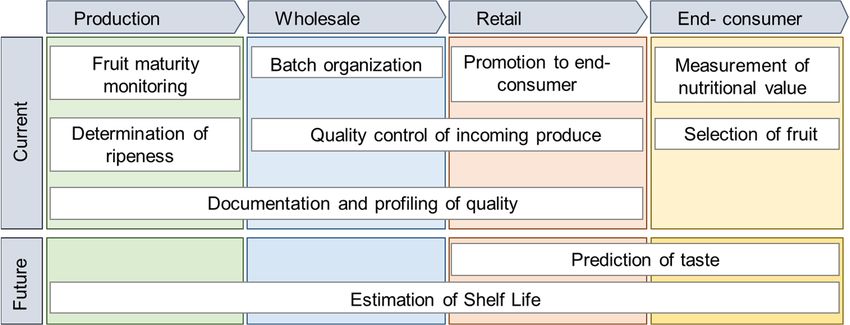
LANDTECHNIK 76(1) 63

not visible for unexperienced end-consumers, which makes the different pricing strategies difficult to
understand. By using food-scanners in retail stores, these differences in internal fruit quality can be
communicated to the end-consumer, e.g. by demonstrating live measurements in combination with
sensory tasting of fruit. Dynamic pricing strategies, as described by Duan and Liu (2019), which are
based on a transparent fruit quality, could help retailers to profit from high-quality produce in the
future. However, handling of these devices by unexperienced consumers is a challenge and must be
taken carefully into account. Incorrectly performed measurements and false results could cause se-
vere brand damage for retail markets and producers and lead to unnecessary food waste and recalls
(Pöpping and Bourdichon 2018).

 A

 B C

Figure 3: (A) Differences in sugar content of table grapes measured on 15 days during incoming goods control using
the F-750 Produce Quality Meter; (B) margin of errors for food-scanner measurements compared to destructive mea-
surements; (C) distinction of different types of tomato due to their sugar content and retail price (according to data
from 2020, calendar week 33) using the F-750 Produce Quality Meter

 Figure 4 summarizes the possible applications of food-scanners along the fresh produce supply
chain. In order to allow a reasonable handling by end-consumers, additional aspects such as handling
by inexperienced people and the correct interpretation of the displayed measurements must be taken
into account (Pöpping and Bourdichon 2018). With regard to future application of these devices, the
estimation of shelf life of fruit and vegetable became the focus of attention within the last few years.
First studies conducted on selected produce such as apple (Correa et al. 2015), asparagus (Sánchez
LANDTECHNIK 76(1) 64

et al. 2009) or lettuce (Giovenzana et al. 2014) indicate the possibility of modelling the shelf life of
produce by using NIR spectrometry. Another future area of food-scanner application could be the pre-
diction of sensory taste patterns. The results of initial studies on the combination of NIR spectra with
sensory analysis on apples and grapes indicate that taste patterns and consumer preferences can be
recognized using NIR spectroscopy (Mehinagic et al. 2003, Parpinello et al. 2013).
 With regard to the development of new prediction models for the utilization of these devices in
daily practice, as illustrated by the presented case study, a broad range of fruit quality and respective
reference values must be considered in order to retain good prediction models. As demonstrated in
previous studies (Wedding et al. 2013, Fan et al. 2019), the integration of biological and seasonal
variability of fruit can help to build more robust and reliable prediction models and thereby unlock a
great potential of non-destructive quality assessment via NIR food-scanners in practical applications
for fresh produce.

Figure 4: Areas of food-scanner applications along the fresh produce supply chain in current and future quality control

Conclusions
Our study illustrated the possible application of food-scanner at various levels of the fresh produce
supply chain. Measurements made possible by food-scanners add value to the quality assessment
within the trade of fruit and vegetables. Therefore, the quality of fresh produce can be communi-
cated and tracked quickly and objectively along the supply chain. Our study also shows that further
simplifications with regard to the practical use of these devices will be possible in the future. As
demonstrated, food-scanners can be used for the building of various prediction models from data
collected during incoming goods control or measuring fruit quality directly through packaging film.
With regard to the use and benefit of these devices for end-consumers, further applications, such as
the prediction of taste, are of great interest. Food-scanners could help to cluster the sensory quality
of fruit into taste profiles (e.g., sweet, sour, fruity), which overall enables both retailers and end-con-
sumers to select the desired quality in a targeted manner.
 With regard to future investigations, the combination of information derived from NIR spectroscopy
with additional data such as temperature and humidity during storage could constitute a new method
of shelf life estimation of fresh produce. Using an improved assessment of shelf life at an early stage,
the flow of produce along the supply chain can be controlled more specifically. Consequently, produce
not suitable for the fresh market can be sent to alternative paths of food processing (e.g., smoothies,
juices, dried produce), which helps saving valuable resources and avoids redundant food loss.
LANDTECHNIK 76(1) 65

References
Ceccato, P.; Flasse, S.; Tarantola, S.; Jacquemoud, S.; Grégoire, J.-M. (2001): Detecting vegetation leaf water content
 using reflectance in the optical domain. Remote Sensing of Environment 77, 22-33.
 https://doi.org/10.1016/S0034-4257(01)00191-2
Choi, J.-H.; Chen, P.-A.; Lee, B.; Yim, S.-H.; Kim, M.-S.; Bae, Y.-S.; Lim, D.-C.; Seo, H.-J. (2017): Portable, non-destructive
 tester integrating VIS/NIR reflectance spectroscopy for the detection of sugar content in Asian pears.
 Scientia Horticulturae 220, 147-153. https://doi.org/10.1016/j.scienta.2017.03.050
Correa, A.R.; Quicazán, M.C.; Hernandez, C.E. (2015): Modelling the Shelf-life of Apple Products Accoring to their
 Water Activity. Chemical Engineering Transactions 43, 199-204. https://doi.org/10.3303/CET1543034
Cozzolino, D. (2009): Near infrared spectroscopy in natural products analysis. Planta medica 75, 746-756.
 https://doi.org/10.1055/s-0028-1112220
Donis-González, I.R.; Valero, C.; Momin, M.A.; Kaur, A.C.; Slaughter, D. (2020): Performance Evaluation of Two
 Commercially Available Portable Spectrometers to Non-Invasively Determine Table Grape and Peach Quality
 Attributes. Agronomy 10, 148. https://doi.org/10.3390/agronomy10010148
Duan, Y.; Liu, J. (2019): Optimal dynamic pricing for perishable foods with quality and quantity deteriorating
 simultaneously under reference price effects. International Journal of Systems Science: Operations & Logistics 6,
 346-355. https://doi.org/10.1080/23302674.2018.1465618
Fan, S.; Li, J.; Xia, Y.; Tian, X.; Guo, Z.; Huang, W. (2019): Long-term evaluation of soluble solids content of apples with
 biological variability by using near-infrared spectroscopy and calibration transfer method. Postharvest Biology and
 Technology 151, 79-87. https://doi.org/10.1016/j.postharvbio.2019.02.001
Felix Instruments (2020): Food science instruments. https://www.felixinstruments.com/food-science-instruments/
 portable-nir-analyzers/f-750-produce-quality-meter/, accessed on 21 June 2020
Giovenzana, V.; Beghi, R.; Buratti, S.; Civelli, R.; Guidetti, R. (2014): Monitoring of fresh-cut Valerianella locusta Laterr.
 shelf life by electronic nose and VIS-NIR spectroscopy. Talanta 120, 368-375.
 https://doi.org/10.1016/j.talanta.2013.12.014
Goisser, S.; Fernandes, M.; Ulrichs, C.; Mempel, H. (2018): Non-destructive measurement method for a fast quality
 evaluation of fruit and vegetables by using food-scanner. DGG-Proceedings 8, 1-5.
 https://doi.org/10.5288/DGG-PR-SG-2018
Goisser, S.; Mempel, H.; Bitsch, V. (2020): Food-Scanners as a Radical Innovation in German Fresh Produce Supply
 Chains. 101 - 116 Pages / International Journal on Food System Dynamics, Vol 11, No 2 (2020) / International
 Journal on Food System Dynamics, Vol 11, No 2. https://doi.org/10.18461/IJFSD.V11I2.43
Guthrie, J.A.; Walsh, K.B.; Reid, D.J.; Liebenberg, C.J. (2005): Assessment of internal quality attributes of mandarin
 fruit. 1. NIR calibration model development. Aust. J. Agric. Res. 56, 405. https://doi.org/10.1071/AR04257
Jannok, P.; Kamitani, Y.; Kawano, S. (2014): Development of a Common Calibration Model for Determining the
 Brix Value of Intact Apple, Pear and Persimmon Fruits by near Infrared Spectroscopy. Journal of Near Infrared
 Spectroscopy 22, 367-373. https://doi.org/10.1255/jnirs.1130
Kaur, H.; Künnemeyer, R.; McGlone, A. (2017): Comparison of hand-held near infrared spectrophotometers for fruit dry
 matter assessment. Journal of Near Infrared Spectroscopy 25, 267-277.
 https://doi.org/10.1177/0967033517725530
Li, J.; Xue, L.; Liu, M.H.; Lv, P.; Yan, L.Y. (2011): Determination of Moisture Content in Ginger Using PSO Combined with
 Vis/NIR. AMR 320, 563-568. https://doi.org/10.4028/www.scientific.net/AMR.320.563
McGlone, V.A.; Fraser, D.G.; Jordan, R.B.; Künnemeyer, R. (2003a): Internal quality assessment of mandarin fruit by
 vis/NIR spectroscopy. Journal of Near Infrared Spectroscopy 11, 323-332. https://doi.org/10.1255/jnirs.383
McGlone, V.A.; Jordan, R.B.; Seelye, R.; Clark, C.J. (2003b): Dry-matter—a better predictor of the post-storage soluble
 solids in apples? Postharvest Biology and Technology 28, 431-435.
 https://doi.org/10.1016/S0925-5214(02)00207-7
McGlone, V.A.; Kawano, S. (1998): Firmness, dry-matter and soluble-solids assessment of postharvest kiwifruit by
 NIR spectroscopy. Postharvest Biology and Technology 13, 131-141.
 https://doi.org/10.1016/S0925-5214(98)00007-6
LANDTECHNIK 76(1) 66

Mehinagic, E.; Royer, G.; Bertrand, D.; Symoneaux, R.; Laurens, F.; Jourjon, F. (2003): Relationship between sensory
 analysis, penetrometry and visible–NIR spectroscopy of apples belonging to different cultivars. Food Quality and
 Preference 14, 473-484. https://doi.org/10.1016/S0950-3293(03)00012-0
Møller, S.M.; Travers, S.; Bertram, H.C.; Bertelsen, M.G. (2013): Prediction of postharvest dry matter, soluble solids
 content, firmness and acidity in apples (cv. Elshof) using NMR and NIR spectroscopy: a comparative study.
 Eur Food Res Technol 237, 1021-1024. https://doi.org/10.1007/s00217-013-2087-6
Ncama, K.; Magwaza, L.S.; Poblete-Echeverría, C.A.; Nieuwoudt, H.H.; Tesfay, S.Z.; Mditshwa, A. (2018): On-tree
 indexing of ‘Hass’ avocado fruit by non-destructive assessment of pulp dry matter and oil content. Biosystems
 Engineering 174, 41-49. https://doi.org/10.1016/j.biosystemseng.2018.06.011
OECD (2018): OECD fruit and vegetable scheme. Guidelines on objective tests to determine quality of fruit and
 vegetables, dry and dried produce
Olarewaju, O.O.; Bertling, I.; Magwaza, L.S. (2016): Non-destructive evaluation of avocado fruit maturity using near
 infrared spectroscopy and PLS regression models. Scientia Horticulturae 199, 229-236.
 https://doi.org/10.1016/j.scienta.2015.12.047
Parpinello, G.P.; Nunziatini, G.; Rombolà, A.D.; Gottardi, F.; Versari, A. (2013): Relationship between sensory and NIR
 spectroscopy in consumer preference of table grape (cv Italia). Postharvest Biology and Technology 83, 47-53.
 https://doi.org/10.1016/j.postharvbio.2013.03.013
Pasquini, C. (2003): Near Infrared Spectroscopy: Fundamentals, Practical Aspects and Analytical Applications. Journal
 of the Brazilian Chemical Society 14, 198-219. https://doi.org/10.1590/S0103-50532003000200006
Pöpping, B.; Bourdichon, F. (2018): Consumer food testing devices: threat or opportunity? New Food 21, 30-33
Rateni, G.; Dario, P.; Cavallo, F. (2017): Smartphone-Based Food Diagnostic Technologies: A Review. Sensors (Basel,
 Switzerland) 17. https://doi.org/10.3390/s17061453
Sánchez, M.-T.; Pérez-Marín, D.; Flores-Rojas, K.; Guerrero, J.-E.; Garrido-Varo, A. (2009): Use of near-infrared
 reflectance spectroscopy for shelf-life discrimination of green asparagus stored in a cool room under controlled
 atmosphere. Talanta 78, 530-536. https://doi.org/10.1016/j.talanta.2008.12.004
Santos Neto, J.P. dos; Assis, M.W.D. de; Casagrande, I.P.; Cunha Júnior, L.C.; Almeida Teixeira, G.H. de (2017):
 Determination of ‘Palmer’ mango maturity indices using portable near infrared (VIS-NIR) spectrometer.
 Postharvest Biology and Technology, 130, 75-80. https://doi.org/10.1016/j.postharvbio.2017.03.009
Schmilovitch, Z.; Mizrach, A.; Hoffman, A.; Egozi, H.; Fuchs, Y. (2000): Determination of mango physiological indices by
 near-infrared spectrometry. Postharvest Biology and Technology 19, 245-252.
 https://doi.org/10.1016/s0925-5214(00)00102-2.
Spectral Engines (2020): Food Scanner. The world’s smartest, fastest and easiest way to measure food content.
 https://www.spectralengines.com/products/nirone-scanner/foodscanner, accessed on 21 June 2020.
Sunforest (2020): Portable Nondestructive Fruit Quality Meter. http://sunforest.kr/index.php?sm_idx=eng,
 accessed on 3 August 2020
Tellspec (2020): Empowering a Healthier World. with Real-Time Analysis Using Portable Low-Cost Sensors.
 https://tellspec.com/, accessed on 21 June 2020
UNECE, 2019: Fresh Fruit and Vegetables - Standards.
 http://www.unece.org/trade/agr/standard/fresh/ffv-standardse.html, accessed on 21 June 2020
Wang, H.; Peng, J.; Xie, C.; Bao, Y.; He, Y. (2015): Fruit Quality Evaluation Using Spectroscopy Technology: A Review.
 Sensors 15, 11889-11927. https://doi.org/10.3390/s150511889
Wedding, B.B.; Wright, C.; Grauf, S.; White, R.D.; Tilse, B.; Gadek, P. (2013): Effects of seasonal variability on FT-NIR
 prediction of dry matter content for whole Hass avocado fruit. Postharvest Biology and Technology 75, 9-16.
 https://doi.org/10.1016/j.postharvbio.2012.04.016
LANDTECHNIK 76(1) 67

Authors
M.Sc. Simon Goisser, Research assistant at University of Applied Sciences Weihenstephan-Triesdorf, Department of
Greenhouse Technology and Quality Management, Am Staudengarten 10, 85354 Freising, Germany
M.Sc. Sabine Wittmann, Research assistant at University of Applied Sciences Weihenstephan-Triesdorf, Department of
Greenhouse Technology and Quality Management, Am Staudengarten 10, 85354 Freising, Germany
Prof. Dr. Heike Mempel, Professor at University of Applied Sciences Weihenstephan-Triesdorf and head of the
department of Greenhouse Technology and Quality Management, Am Staudengarten 10, 85354 Freising, Germany.
E-Mail: heike.mempel@hswt.de

Acknowledgements
The research of this publication was financed by the QS Science Funds in Fruit, Vegetables and Potatoes. The preparatory
work for the study presented here was carried out within the framework of the alliance “Wir retten Lebensmittel” [We
Save Foodstuffs], which was funded by the Bavarian Ministry of Food, Agriculture and Forestry. The authors address
special thanks to STEP Systems GmbH from Nuremberg, Germany for their loan of two food-scanner devices during the
course of these studies.
You can also read