FOOD SYSTEMS AT RISK: TRENDS AND CHALLENGES - A SCIENTIFIC HANDOUT - Cirad
←
→
Page content transcription
If your browser does not render page correctly, please read the page content below
FOOD SYSTEMS AT RISK:
TRENDS AND CHALLENGES
    A SCIENTIFIC HANDOUT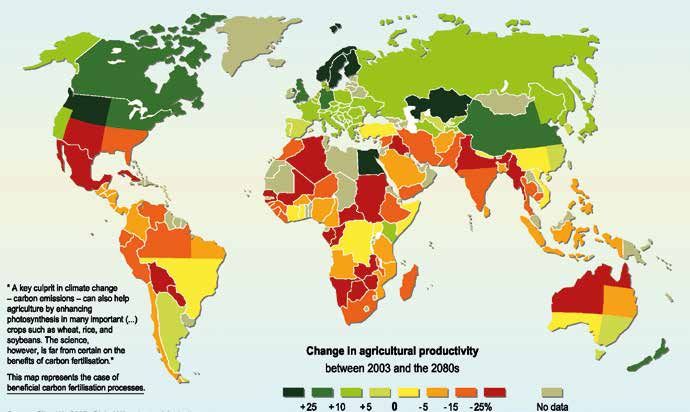
Bendjebbar Pauline, Bricas Nicolas, Giordano Thierry, 2019. Food systems at risk. A scientific handout for the High Level
Event of the Global Network against Food Crises: Food & Agriculture in times of crisis, Brussels, 2-3 April 2019. Montpellier,
Cirad. 48 p.

The views expressed in this information product are those of the author(s) and do not necessarily reflect the views or policies
of CIRAD.
ISBN 978-2-87614-747-8
© CIRAD, 2019
FOOD SYSTEMS AT RISK:
TRENDS AND CHALLENGES
   A SCIENTIFIC HANDOUT

                          3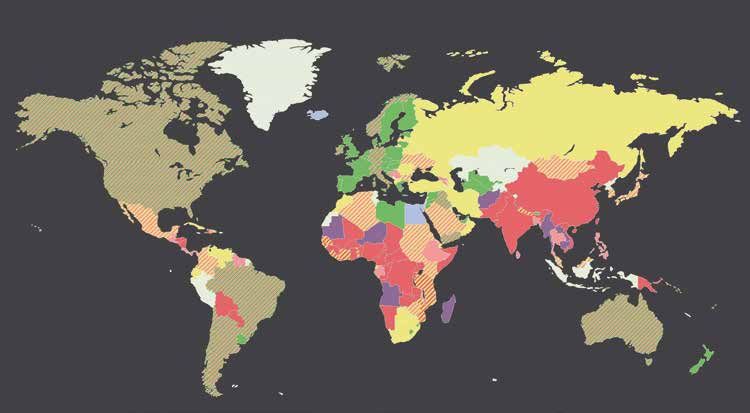
AG R I F O OD SYS TEM AT RISK: NE W TRE NDS A ND CHA L L EN G ES
A SCIENTIFIC HANDOUT

        ACKNOWLEDGEMENTS
                   This booklet was coordinated by Nicolas Bricas, Pauline Bendjebbar and Thierry Giordano from Cirad with the
                   contributions of Ward Anseeuw, Habibou Assouma, Julie Betbeder, Aurélie Binot, Vincent Blanfort, Thierry Brunelle,
                   Christian Cilas, Marc Corbeels, Christian Corniaux, Lionel Dabbadie, Benoit Daviron, Julien Demenois, Patrice
                   Dumas, Sandrine Dury, Guillaume Duteurtre, Céline Dutilly, Stefano Farolfi, Laurène Feintrenie, Muriel Figuié, Franck Galtier,
                   Laurent Gazull, Pierre Girard, Etienne Hainzelin, Amandine Hertzog, Alexandre Hobeïka, Alexandre Ickowicz, Jean-Yves Jamin,
                   Frédéric Lançon, Sylvaine Lemeilleur, Olivier Lepiller, Bruno Losch, Élodie Maître d’Hôtel , Eric Malézieux, Paule Moustier,
                   Marie-Gabrielle Piketty, René Poccard-Chapuis, Ninon Sirdey, Guillaume Soullier, Jean-Michel Sourisseau, Ibra Touré,
                   Elodie Valette, Abdrahmane Wane from CIRAD, Géraldine Chaboud (Montpellier SupAgro), Yves Martin-Prével (IRD),
                   Pierre Fabre, Patrick Herlant and Philippe Thomas (European Commission, Devco), Joint Research Centers (European
                   Commission), Ekaterina Krivonos and colleagues from FAO.

                   Laurence Laffont made the graphic design of the booklet, and Agnès Stienne made some of the maps.

                   This work benefitted from European Commission funds through the FAO Agrintel facility.

 4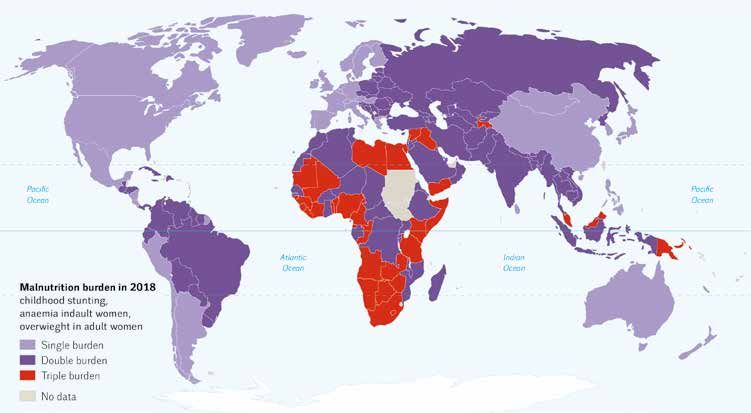
TA B L E O F C O N T E N T S
Acknowledgements                                            P4     4 . Environmental trends
Table of contents                                           P5
                                                                   Climate change.................................................P 21
The paradox of Food Security                                P9
                                                                   Natural resources and biodiversity loss.............P 23
                                                                   Soil degradation and pollution..........................P 25

                                                                   5. From trends to risks

                                                                   Food production capacity..................................P 29
1 . Food systems                                                   Readiness to face instability..............................P 31

Food systems definition......................................P 9   Nutrition: the triple burden...............................P 33
Four main categories of drivers are shaping                        Food safety.......................................................P 35
food systems pathways.......................................P 9    International markets.......................................P 37

2. Demographic trends                                              Disasters, conflicts, displacements....................P 39

A fast growing population in some countries.....P 11               CONCLUSION
Population will grow in urban areas..................P 13          An unprecedented combination of risks............P 41
Population will also grow in rural areas in LIC....P 15            Towards resilient food systems.........................P 43

3. Socio-economic trends

Emerging middle class, but remaining poverty...P 17
Employment and income generation.................P 19              References                                                      P 44

                                                                                                                                            5
AG R I F O OD SYS TEM AT RISK: NE W TRE NDS A ND CHA L L EN G ES
A SCIENTIFIC HANDOUT

                                                                                                                                                                                                                               Figure 1: Food availability per capita.
                           4000
         In Kcal/cap/day                                                                                                                                                                                                       Source: FAOSTAT.
                           3500

                           3000

                           2500

                           2000

                           1500

                                                                                                                                                                                                                 2011
                                  1961
                                         1963
                                                1965
                                                       1967
                                                              1969
                                                                     1971
                                                                            1973
                                                                                   1975
                                                                                          1977
                                                                                                 1979
                                                                                                        1981
                                                                                                               1983
                                                                                                                      1985
                                                                                                                             1987
                                                                                                                                    1989
                                                                                                                                           1991
                                                                                                                                                  1993
                                                                                                                                                         1995
                                                                                                                                                                1997
                                                                                                                                                                       1999
                                                                                                                                                                              2001
                                                                                                                                                                                     2003
                                                                                                                                                                                            2005
                                                                                                                                                                                                   2007
                                                                                                                                                                                                          2009

                                                                                                                                                                                                                        2013
                                                 World                                    Africa                                    North America                                      South America
                                                 Asia                                     Europe                                    Oceania

                                                                            Figure 2: Undernourishment.
                                                                              Data source: FAO, SOFI, 2018.
 6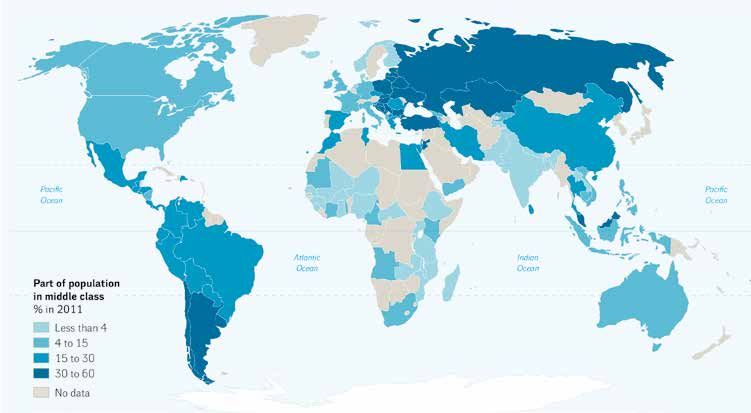
GE N E RA L IN TRO D U CTI ON

The paradox of Food Security
Food production per capita has never been higher (Figure 1).              Many reasons explain this reversal, and many more might
Food production has increased faster than population growth.              threaten food security of Low Income Countries (LIC) and
On average, food production is higher than nutritional needs              Lower Middle Income Countries (LMIC) (Map 1) in the decades
and should continue to be.                                                to come.
As a result, food security has improved over the same period.
But a turning point occurred in 2015 (Figure 2).

                                                   Map 1: Low Income and Lower Middle Income Countries.

         821                                       Data source: World Bank

      million of
  undernourished
       people
    in the world
       in 2017
           Low income economies =
           GNI per capita $995 or less
           Lower middle income economies =
           GNI per capita between $996 to $3,895
           Upper middle income economies =
           GNI per capita between $3,896 to $12,055
           High income economies =
           GNI per capita $12,056 or more

                                                                                                                Cartography: Agnès Stienne
                                                                                                                                             7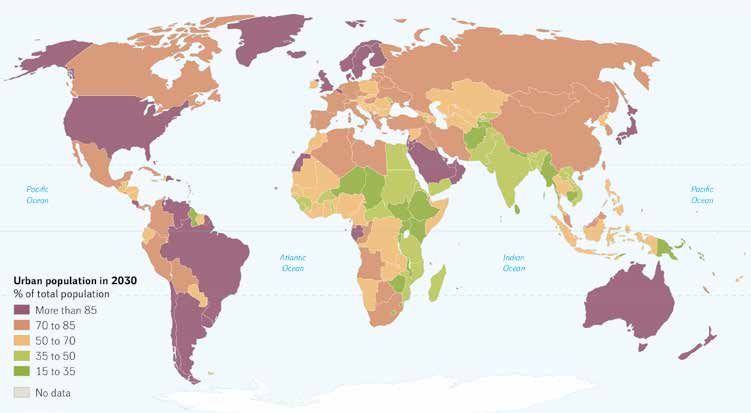
AG R I F O OD SYS TEM AT RISK: NE W TRE NDS A ND CHA L L EN G ES
A SCIENTIFIC HANDOUT

                              Figure 3: Food system wheel.
                              Source: FAO, 2018.

                                                                                                   AGGREGATION
                                                                                                                  PR
                                                                                         ON                         OC
                                                                                       TI                             ES
                                                                                     UC             R OF DIVERSE
                                                                                                 IOU             AC
                                                                                              AV

                                                                             OD

                                                                                                                        SI
                                                                                                                   T

                                                                                                                          NG
                                                                                             H

                                                                           PR
                                                                                            E

                                                                                                                   OR
                                                                                      B

                                                                                                                     S
                                                            CORE SYSTEM

                                                                                                                                DISTR
                                                                                                                                     IBUTION
                                                                                                                            CO
                                     AI R

                                                                                                                              NS
                                                                                                                                U
                                                                                                                   M
                                                                                                                    PT
                                                                                                                      IO
                                                                                                                        N
                                            SO
                                            I LS

                                                   EC
                                                     OS
                                                       YS
                                                            TE
                                                                 MS
                                                                          AN                                                          TE
                                                                                                                                    MA
                                                                               DG
                                                                                    EN E                                     C LI
                                                                                           T ICS
                                                                                                         WATER

 8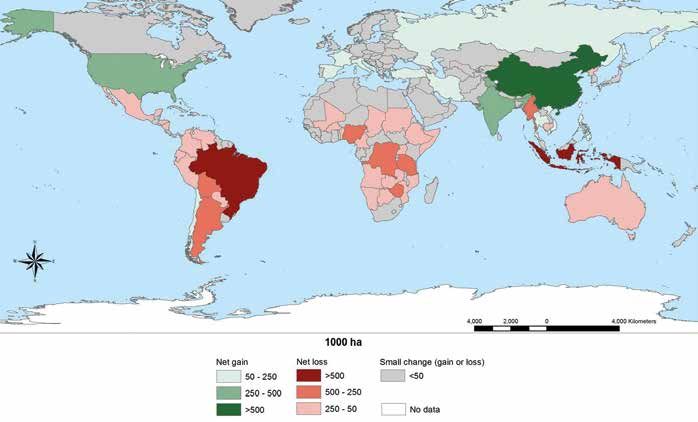
1. FO O D SYSTEM S

1 Food systems
n   Food systems definition                                          n Four main categories of drivers
Food systems (FS): “the entire range of actors and their             are shaping food systems pathways
interlinked value-adding activities involved in the production,
                                                                     Four main categories of drivers (not an exhaustive list) that
aggregation, processing, distribution, consumption and
                                                                     may put food systems at risk are considered:
disposal of food products that originate from agriculture,
forestry or fisheries, and parts of the broader economic, societal   Demographic drivers such as population growth and
and natural environments in which they are embedded” .               urbanization, are impacting on food demand: quantity, quality
                                                                     and type of food. They also drive the need for job creation.
Food systems are made of “sub-systems (e.g. farming
system, input supply system, processing system, etc.)                Socio-economic drivers such as income and socio-cultural
and interact with other key systems (e.g. energy system,             factors, poverty and inequalities, trade and financial systems,
trade system, health system, etc.)”. They hinge on actors,           are influencing diet and access of consumers to food.
relationships and networks (Figure 3).
                                                                     Environmental drivers such as biodiversity losses, pollution or
They generate environmental and socio-economical outcomes,           climate change, threaten food systems’ sustainability.
in addition to food security and nutrition.
                                                                     Political drivers such as governance, public policies and
                                                                     conflicts, are shaping the institutional environment. Public
                                                                     policies can encourage certain food-systems pathways, while
                                                                     conflicts can disrupt them.

                                                                                                                                       9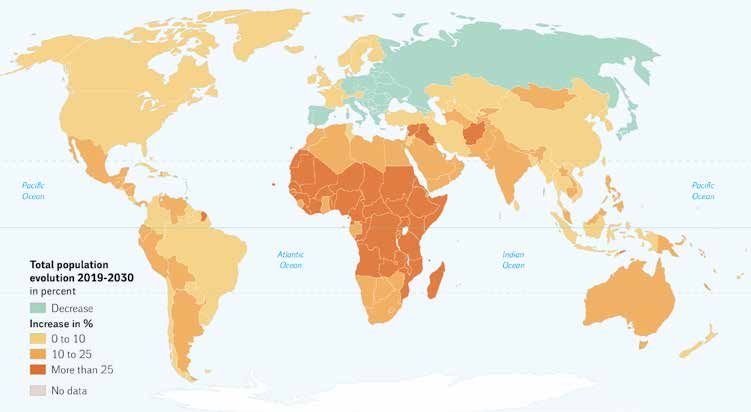
AG R I F O OD SYS TEM AT RISK: NE W TRE NDS A ND CHA L L EN G ES
A SCIENTIFIC HANDOUT

        Map 2: Total population evolution from 2019 to 2030 (in %).
        Data source: UN population.

                                                                      Cartography: Agnès Stienne

10
2. D E MO GRA PH IC TRENDS
2 Demographic trends
n A fast growing population In the Sahel region, 30 000 persons / million inhabitants /
year will enter the workforce over the next 10 years. For
in some countries a country of 10 million inhabitants, this means creating
The world population is expected to increase from 7.7 300 000 new jobs every year.
billion in 2019, to 8.5 billion by 2030 and 9.8 billion by 2050.
Population growth means an increase in food demand and
This growth will be particularly important in LIC and LMIC, greater pressure on natural resources such as land and
even more so in sub-Saharan Africa (SSA) (Map 2). water.
Figure 4: Expected increase in population
in some country groups. (Million)
Data source : UN Population
2019 2030 Increase
LIC* 713 935 + 222
LMIC** 3 140 3 595 + 455
SSA*** 1 078 1 418 + 340
Sahel 103 142 + 39
* LIC: Low Income Countries
** LMIC: Lower Middle Income Countries
*** SSA: Sub-Saharan Africa
11AG R I F O OD SYS TEM AT RISK: NE W TRE NDS A ND CHA L L EN G ES
A SCIENTIFIC HANDOUT
Map 3: Urban population evolution from 2019 to 2030 (in %).
Data source: UN population.
Cartography: Agnès Stienne
122. D E MO GRA PH IC TRENDS
2 Demographic trends
n Population will grow in urban areas Urbanization induces a diversification in food offer, and an
evolving food environment for consumers (e.g. new products
Low Income Countries (LIC) and Lower Middle Income Countries
and stores, advertising and an evolving mass media, etc.) and
(LMIC) urban populations will grow at an annual rate of 3.9%
changes in food practices (e.g. an increase in the out of home
and 2.4% respectively over the next 10 years. This means a
consumption) and in consumers’ concerns (origin of food
50% increase of the urban population between 2019 and 2030.
products, mistrust in the food system).
Map 3 shows the countries where urban populations will be
larger than rural populations.
Map 4: Cities in 2018
and their growth rate
2018-2030.
Source: UN population,
2018.
13AG R I F O OD SYS TEM AT RISK: NE W TRE NDS A ND CHA L L EN G ES
A SCIENTIFIC HANDOUT
Map 5: Rural population growth in % from 2019 to 2030.
Data source: UN population.
Cartography: Agnès Stienne
142. D E MO GRA PH IC TRENDS
2 Demographic trends
n Population will also grow
in rural areas in LIC
Urbanization should not mask the important increase in
rural populations in LI countries (Map 5) and, in particular, in
sub-Saharan African countries (Figure 5).
From 2019 up to 2030, in some sub-Saharan countries, the
rural population will increase by more than 20%.
Rural population growth means a quantitative increase in food
demand and a need to create jobs in rural areas. Figure 5: Evolution of rural population by major countries and
regions (1950-2050) (in million).
Data source: UN Population.
1000
900
800
700
600
500
400
300
200
100
0
50
55
60
65
70
75
80
85
90
95
00
05
10
15
20
25
30
35
40
45
50
19
19
19
19
19
19
19
19
19
19
20
20
20
20
20
20
20
20
20
20
20
Sub-Saharan Africa China
India South-Eastern Asia
Europe Latin America and the Caribbean
15AG R I F O OD SYS TEM AT RISK: NE W TRE NDS A ND CHA L L EN G ES
A SCIENTIFIC HANDOUT
Map 6: Middle class (share of total population) .
Data source: Pew research Center, 2015.
Cartography: Agnès Stienne
163. SO CIO - E CO N O MIC TRE NDS
3 Socio-economic trends
nEmerging middle class,
but remaining poverty
Middle class growth in many parts of the world (Map 6) and
mainly in Asia (Figure 6) implies an increase in purchasing Figure 6: The expansion of the global middle class
power for part of the population. (in millions).
Source: Kharas, 2017.
This translates into a diversification in diets, with a growing
consumption of animal products, sugar, fat, and processed 6000
food.
5000
Such an evolution in food diets creates new nutritionnal risks
(overconsumption compared to reduced physical activity). It 4000
also contributes to an increase in pressure on food production 3000
(waste, animal feed) and on resources (water, energy for
2000
processed food).
1000
At the same time, poverty rates should remain high in many
LI and LMI countries, with strong inequalities within countries, 0
thus upholding the risk of social unrest and conflicts. 2015 2020 2025 2030
North America
Europe
Central & South America
Asia Pacific
Sub-Saharan Africa
Middle East and North Africa
17AG R I F O OD SYS TEM AT RISK: NE W TRE NDS A ND CHA L L EN G ES
A SCIENTIFIC HANDOUT
Map 7: Employment in agriculture in 2018 (share of total employment in %).
Data source: ILOSTAT.
Cartography: Agnès Stienne
183. SO CIO - E CO N O MIC TRE NDS
3 Socio-economic trends
n Employment and income generation and technological innovations, but also investments in rural
infrastructure (communication, education, health, sanitation,
The challenge of job creation will be particularly high in sub-
energy, etc.) contribute to improving this attractiveness and
Saharan African countries.
productivity.
By 2050, 62% of the worldwide increase of the working age
But a transformation of agriculture towards highly capital
population will be in Africa. By 2030, 175 million additional
intensive models can increase the exit from agriculture and
jobs will need to be created, including 93 million in rural areas
the demand for non-agricultural labour in a context where the
(Figure 7).
industrial and service sectors already have difficulty absorbing
The employment challenge in sub-Saharan countries is also the growth in labour force.
about the type of jobs: today, 58% of employment are poor
Policies addressing gender inequalities are gaining momentum,
jobs (AG R I F O OD SYS TEM AT RISK: NE W TRE NDS A ND CHA L L EN G ES
A SCIENTIFIC HANDOUT
Map 8: Projected impact of climate change on agricultural yields.
Source: Cline, 2007
204. E N VIRO N ME N TA L TRENDS
4 Environmental trends
n Climate change Climate change will lead to more variability and shifting
seasons, and an increased severity and frequency of natural
Climate change is defined as “a change of climate which is
disasters such as floods and droughts (Figure 8).
attributed directly or indirectly to human activity that alters the
composition of the global atmosphere and which is in addition Climate change also affects the geography of food production
to natural climate variability observed over comparable time and of plant and animal diseases; without action, agricultural
periods”. output might reduce drastically in some regions.
Agricultural systems in high income and emerging countries
are the biggest producers of greenhouse gases (GHG) while
agricultural systems in LIC and LMIC will be the most affected
by climate change.
Climate change will affect crop yields, spread of plant and
animal diseases, and thereby might limit food availability,
especially in LIC and LMIC.
300
250
200
150
100
50
0
2011
1990
1991
1992
1993
1994
1995
1996
1997
1998
1999
2000
2001
2002
2003
2004
2005
2006
2007
2008
2009
2010
2012
2013
2014
2015
2016
Figure 8: Number of climate disasters. Floods Others disasters
Source: EM-DAT.
21AG R I F O OD SYS TEM AT RISK: NE W TRE NDS A ND CHA L L EN G ES
A SCIENTIFIC HANDOUT
Map 9: Annual net change in forest area (1990 - 2015).
Source: FAO, 2015. Global Forest Resources Assessment.
224. E N VIRO N ME N TA L TRENDS
4 Environmental trends
n Natural resources and biodiversity loss The Living Planet Index, which measures trends in the
abundance of freshwater, marine and territorial species,
To fertilize the land, produce and process products, food
shows that the 6th mass extinction of biodiversity has been
systems increasingly use resources that are finite (e.g. fossil
reached (Figure 9).
energy, phosphate), fully renewable (e.g. solar energy) and
conditionally renewable (e.g. forest, water and fish) and
evolving (e.g. biodiversity).
The scarcity of non-renewable resources, the management
of renewable resource stocks and the over-exploitation of
conditionally renewable resources, heighten competition, Figure 9: The Living Planet Index.
which may lead to conflicts, and affect production capacity. The global LPI shows a 60% (range: -50% to -67%) decline between 1970 and
As they usually provide other ecosystem services, resource 2014. The white line shows the index values and the shaded areas represent
depletion and overexploitation jeopardize not only future food the 95% confidence intervals surrounding the trend.
production but also ecological balances. Source: WWF/ZSL. 2018
GLOBAL
Forests and trees make vital contributions to both people 2
Index value (1970 = 1)
and the planet, but reduction of the forest cover is reaching
worrying thresholds in many LICs and MICs (Map 9).
Access to available arable land is progressively limited because
of demographic expansion and land degradation (erosion,
1
fertility reduction etc.)
Biodiversity is critical for agriculture. However, many of its
key components at genetic, species and ecosystem levels
are in decline. Scientists warn that a 6th mass extension of
biodiversity is on-going. 0
1970 1980 1990 2000 2010
23AG R I F O OD SYS TEM AT RISK: NE W TRE NDS A ND CHA L L EN G ES
A SCIENTIFIC HANDOUT
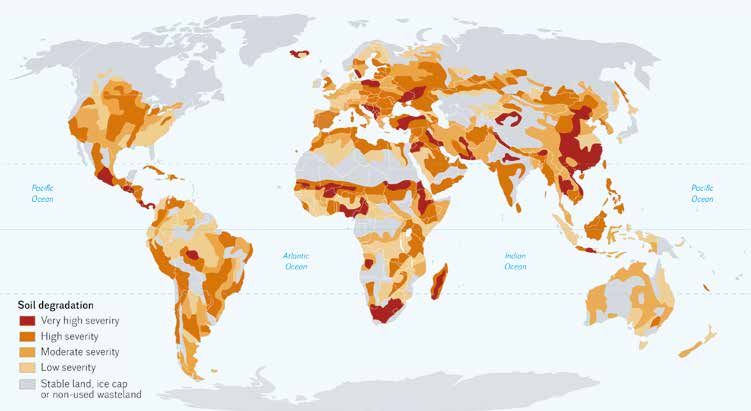
Map 10: Global soil degradation induced by humans.
Data source: FAO; Sepuru & Dobe, 2017 based on Oldeman et al., 1990.
Cartography: Agnès Stienne
244. E N VIRO N ME N TA L TRENDS
4 Environmental trends
n Soil degradation and pollution Agrochemicals are also a major pollutant affecting soils and
water. Phosphates generally also bring contaminants of heavy
Soil degradation is a change resulting in a diminished capacity
metal, like cadmium. Organochlorine insecticides can persist
of the ecosystem to provide goods and services.
in the soil for decades and be bioconcentrated from the soil
Rapid growth of cities, industries and industrialized agriculture to final consumer along the food chain. Antibiotics, used at a
has accelerated soil losses and threats such as soil erosion, large scale level for animal and fish production, are less and
compaction, acidification, contamination, sealing, salinization, less efficient due to increasing antimicrobial resistance.
waterlogging, nutrient imbalance (both nutrient deficiency
and nutrient excess), and losses of soil organic carbon and of
biodiversity.
In many parts of the world agriculture is a major contributor to
pollution through the use of synthetic inputs, such as chemical
fertilizers and pesticides, antimicrobials, or animal wastes.
When applied in excess, only a fraction of chemical fertilizers
is absorbed by plants, the remaining part contaminates
underground and surface freshwater systems.
In some developping countries, the consumption of pesticides
is already high (Figure 10).
Figure 10: Pesticide use / ha by continents (2014).
Data source: FAOSTAT.
25AG R I F O OD SYS TEM AT RISK: NE W TRE NDS A ND CHA L L EN G ES
A SCIENTIFIC HANDOUT
Figure 11: Drivers challenging food systems.
Source: author based on the FAO food systems wheel.
Financialization
Income
Globalization
Population growth Poverty
Urbanisation
SOCIO-ECONOMIC
DEMOGRAPHIC
Price instability
Displacement and migration
AGGREGATION
PR
Innovations
ON OC
TI F DIVERS ES
UC UR O E
IO AC
AV
OD
SI
T
NG
EH
PR
OR
B
S
CORE SYSTEM
DISTR
IBUTION
CO
AIR
NS
U
M
PT
IO
N
SO
I LS
Resources depletion
EC
OS
Y ST
EM
SA E
ND M AT
G ENE CLI
TICS
WATER
Biodiversity loss
Power asymmetry BIOPHYSICAL &
in governance POLITICAL ENVIRONNEMENTAL
Climate change
Conflicts Pollution
265. FRO M TRE N D S TO R I SKS
5 From trends to risks
The set of trends previously presented creates many threats,
especially in LI and LMI countries. Combined together, these
trends may dramatically amplify the vulnerability of food
systems, affecting food access, availability, utilization and
stability. They might threaten food systems’ capacities not only
to meet food nutrition and security but also environmental
integrity and inclusive development objectives (Figure 11).
The combination of drivers and their projected trends point to
regional hotspots where populations will potentially experience
food conflicts and crisis in the near future.
27AG R I F O OD SYS TEM AT RISK: NE W TRE NDS A ND CHA L L EN G ES
A SCIENTIFIC HANDOUT
Map 12: Threats to land.
Source: JRC World Atlas of Desertification, 2018.
285. FRO M TRE N D S TO R I SKS
5 From trends to risks
n Food production capacity population growth. If income diversification opportunities are
not sufficient to guarantee access to food, there is a risk that
Due to growing population, soil degradation, deforestation and
migration to less populated areas, particularly forests, cities or
urban development (which aggravates land pressures), food
abroad, will accelerate, causing other problems (deforestation,
production increased through extending the cropped area
urban poverty, etc.).
will be limited. Food availability is challenged in sub-Saharan
countries. Food needs could grow by 29% to 91% over the
2010 - 2050 period depending on the assumptions made on
population growth, economic growth, and diet changes, and
the rise will be much greater in sub-Saharan Africa.
Mean yields changes due
At the same time, environmental drivers, such as soil
to climate change by 2050
degradation, water scarcity and biodiversity losses, challenge
the capacity of agricultural production to cope with this
growing demand (Part 3). In addition, climate change could
reduce yields of major crops (Map 8). • Africa: -17% (wheat)
Agricultural production is some countries (Map 12) already
struggles to keep up with population growth.
-5% (maize)
It is now recognized that, on a global scale, future global food -15% (sorghum)
security does not necessarily require a significant increase
in food production if we move towards more sustainable
production systems on the one hand and if incomes and
-10 % (millet)
availability are better distributed around the world on the
other.
On a more local scale, however, some areas seem threatened
• South Asia: -16% (maize)
with a decline in food production. Agricultural production is
some countries (Map 12) already struggles to keep up with
-11 % (sorghum)
29AG R I F O OD SYS TEM AT RISK: NE W TRE NDS A ND CHA L L EN G ES
A SCIENTIFIC HANDOUT
Map 13: Climate vulnerability world map.
Source: Colombo G. et al. (EMAPS Project), 2013.
305. FRO M TRE N D S TO R I SKS
5 From trends to risks
n Readiness to face instability To help appraise the complexity of this readiness to face
cumulated risks, Map 13 combines 3 different indices:
Food accessibility, availability, utilization and stability shape the
purpose of food systems. The capacity to produce and import • The Climate Vulnerability Monitor (environmental disasters,
food, and access for all groups of people require a stable habitat change, health impact, industry stress)
environment which may be jeopardized by strong or sustained • The ND-GAIN Country Index (vulnerability to climate change,
exposure to risk (technical, environmental, organisational and global challenges, readiness to improve resilience)
societal).
• The Global Climate Risk Index (weather-related loss events:
Some countries benefit from stability, allowing food systems to storms, floods, heat waves etc.)
meet their purpose, while others are disrupted by cumulative
disorders. Vulnerability stems from environmental and climate
change damages, social and economic strains, security issues
etc. The food system’s capacity to resist and overcome this set
of difficulties shape its resilience.
Dozens of indicators attempt to measure individual
components that build this resilience. They provide information
on vulnerability to climate hazards, ecosystem changes,
access to basic services (water, health etc.), economic shocks,
quality of habitats and infrastructures etc. They also take into
account the institutional capacity to manage social difficulties,
control extreme events or encourage innovative behaviour.
While all these elements come into play when disasters or
sudden shocks happen, they must be analysed in a long term
perspective.
31AG R I F O OD SYS TEM AT RISK: NE W TRE NDS A ND CHA L L EN G ES
A SCIENTIFIC HANDOUT
Map 14: Malnutrition burden across countries.
Data source: Globalnutritionreport.org.
Cartography: Agnès Stienne
325. FRO M TRE N D S TO R I SKS
5 From trends to risks
n Nutrition: the triple burden
Economic development, globalization and urbanization, along
with a decrease in the relative price of many food products,
first helped improve access to higher quantities and diversity
of food.
However, today increased production of processed food,
aggressive marketing, and changing lifestyles have led to a
shift in dietary patterns. With urbanization and economic
development, demand is growing for processed and
convenience food, street food and fast food. Many people
in LMIC have access to cheap and empty calories (low in Overweight in LIC:
nutrients), particularly from ultra-processed food, while the
availability and affordability of nutrient-rich food is too low.
LI and LMI countries are now facing the triple burden
1/3
of malnutrition, where populations suffer from of women
undernourishment, micro-nutrient deficiencies, and food-
related non-communicable diseases (diabetes, cardio-vascular
diseases, or cancers). The African continent is the most
impacted by the different burdens (Map 14).
4 in 5
adults with diabetes
live in LMI countries
33AG R I F O OD SYS TEM AT RISK: NE W TRE NDS A ND CHA L L EN G ES
A SCIENTIFIC HANDOUT
Map 15: WHO Estimates of the global burden of foodborne diseases.
Source: WHO, 2015.
345. FRO M TRE N D S TO R I SKS
5 From trends to risks
n Food safety Increasing urban populations, environmental issues, as well
as the lack of infrastructure and political support towards
Unsafe food can be defined as food containing harmful
improvement and food control on markets, raise concerns for
bacteria, viruses or parasites or containing toxic substances.
the future. Food safety and resulting foodborne diseases might
Harmful amounts of toxins or microorganisms can cause be one of the major food quality issues in the years to come.
diseases ranging from diarrhoea to various cancers.
1/3 of the world deaths due to food safety are in Africa.
However, the development of modern food systems in LI and
LMI countries brings with it new risks, for example food anxiety,
as well as an increase in potentially dangerous products due to
the potential increase in food fraud.
Food safety can be threatened from many angles. Harm can be
caused by microbes and mycotoxins, or through the excessive
use of pesticides and other chemicals, such as food additives. Food safety in the world represents
To supply urban dwellers with food, supply chains are long and
complicated and enforcement of food safety may be difficult.
Food safety, especially in LI and LMI countries, will remain a 420 000 deaths/year
concern for years to come (Map 15). When food is not safe,
adequate nutrition can never be achieved.
600 million ill person
due to contaminated
food/year
35AG R I F O OD SYS TEM AT RISK: NE W TRE NDS A ND CHA L L EN G ES
A SCIENTIFIC HANDOUT
Map 16: Net food imports in domestic food supply (% in total calories).
Source: FAO Global Perspectives Studies, using 2011 food balance sheets from FAO, 2016a.
Net export (%) Net import (%)
365. FRO M TRE N D S TO R I SKS
5 From trends to risks
n International markets International trade can help in reducing domestic price
instability, but for countries highly dependent on food
International trade, plays an important role in ensuring food
imports it can also increase their exposure to more frequent
security. Unpredictable events create risks.
international price shocks.
Climate change will significantly affect food production,
Countries where staples account for a high share of calories and
outbreaks and epidemics (such as H1N1 bird flu, etc.) may
expenditure in households’ diets are particularly vulnerable to
disrupt supply chains, thereby affecting food supply. Such
price hikes, as opportunities for product substitutions are low.
supply shocks will make food markets more volatile.
The increasing interdependence of food markets with energy
markets (e.g. biofuels) and financial markets (with the increased
use of agricultural derivatives markets by hedge funds) is likely
to augment instability.
Over 20 years
the international price
of a tonne of rice stayed between
200 and 300 USD,
but soared up to
700 USD
during the 2008 crisis.
37AG R I F O OD SYS TEM AT RISK: NE W TRE NDS A ND CHA L L EN G ES
A SCIENTIFIC HANDOUT
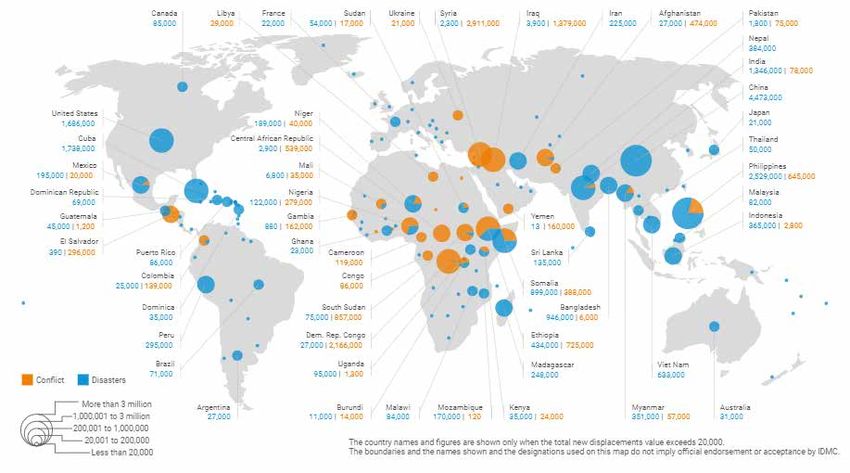
Map 17: New internal population displacement by conflict and disaster in 2017.
Source: IDMC.
385. FRO M TRE N D S TO R I SKS
5 From trends to risks
n Disasters, conflicts, displacements
In 2017, there were 30.6 million new displacements associated 75%
with conflict and disasters across 143 countries and territories.
of stunted children
Conflicts highly impact on food security. For example, stunting
live in countries
in children under 5 years old represents 20% of all children
in countries without conflicts, but 34% in conflict-affected affected by conflict
countries.
Natural disasters remain the main cause of population
displacements at the global level, but in Africa conflicts
From 2008 to 2017,
dominate (Map 17). The projected growing impact of global
warming will certainly raise disaster-related displacement the mean
and potentially fuel social unrest and conflicts, as populations of internal
migrate in the search for new land and food. displacements
Unsteady food systems due to low food production capacities, because
low resilience, high pressure on resources and political
of conflicts was
insecurity generate more migrations.
7.1 million/year.
because of disasters
was
24.6 million/year
39AG R I F O OD SYS TEM AT RISK: NE W TRE NDS A ND CHA L L EN G ES
A SCIENTIFIC HANDOUT
Figure 12: Food system drivers combine and generate cumulative risks
40CO N CL USI ON
CONCLUSION An unprecedented combination of risks
Several drivers of food systems, some evolving very rapidly, On the one hand, such an approach should aim at avoiding
are now adding up and increasing risks for food security and crises, for example by reducing the speed of negative drivers
nutrition. In some regions, rapid population growth, together or by stabilizing the environment. On the other hand it leads
with a depletion of natural resources, impacts of global to developing trajectories of resilience that make it possible to
warming, or conflicts and displacements, challenge food resist and recover from unavoidable crisis.
security and nutrition. Such situation hit poor populations, and
make them increasingly vulnerable over time. This drives to
unprecedented crises.
Such combinations of risks are relatively new. It calls for a new
approach to mitigate the threat of food crisis. Risks cannot
be analyzed and addressed in isolation from each other. A
systemic approach (Figure 12), taking into account feedback
effects, synergies, spill overs, tipping points, irreversibility, or
vicious circles (Figure 13), is urgently needed.
Figure 13: The vicious circle of disasters,
displacements and food system failures.
41AG R I F O OD SYS TEM AT RISK: NE W TRE NDS A ND CHA L L EN G ES
A SCIENTIFIC HANDOUT
Map 18: Global distribution of risks associated with main agricultural production systems.
Source: FAO, Fisheries and aquaculture Department (fishery and aquaculture statistics).
42CO N CL USI ON
CONCLUSION Towards resilient food systems
Drivers are global, but their combination creates risks which Determining risks is not enough to design public policies and
have different from one place to another. As shown by the take action. It is necessary to identify and understand resilient
maps in this handout, and even more so on Map 18, each initiatives and pathways taken by local actors based on their
country faces different drivers and risks, So there is no situations. In each specific environment endogeneous and
«one-size-fits-all» solution. Two countries, even geographically exogeneous innovations multiply and compound. They can
close do not necessarily face the same risks. It is necessary to contribute to building sustainable, inclusive and resilient food
be able to establish diagnosis on a case-by-case basis. systems.
43AG R I F O OD SYS TEM AT RISK: NE W TRE NDS A ND CHA L L EN G ES
A SCIENTIFIC HANDOUT
REFERENCES
P. 6 Figure 1: Data source: FAOSTAT, accessed March 2019. P. 16 Map 6: Pew Research Center Data Base, 2015.
Figure 2 : FAO, IFAD, UNICEF, WFP and WHO. 2018. The State P. 17 Figure 6: Kharas, H., 2017. The unprecedented expansion
of Food Security and Nutrition in the World 2018. Building of the global middle class: an update. Brookings
climate resilience for food security and nutrition. Rome, FAO (Washington DC, USA), Global economy & development
working paper 100. 27 p.
P. 7 Map 1: Data source: The World Bank database, accessed
March 2019. P. 18 Map 7: Data source: ILOSTAT, accessed March 2019.
Box : FAOSTAT, accessed March 2019. P. 19 Figure 7: Data source: ILOSTAT, accessed March 2019.
P. 8 Figure 3: FAO, 2018. Sustainable systems. Concept and P. 20 Map 8: Cline W., 2007. Global Warming and Agriculture:
framework. 8 p. Impact Estimates by Country. Peterson Institute,
Washington DC.
P. 9 FAO, 2018. Sustainable systems. Concept and framework.
8 p. P. 21 Figure 8: Data source: EM-DAT Database, accessed
March 2019.
Van Berkum S., Dengerink J. and Ruben R., 2018. The food
systems approach: sustainable solutions for a sufficient UN, 1992. United Nations Framework Convention on
supply of healthy food, Wageningen, Wageningen Economic Climate Change. FCCC/INFORMAL/84, 24 p.
Reasearch, Memorandum, 2018-064, 32p. P. 22 Map 9: FAO, 2015. Global Forest Resources Assessment.
P. 10 Map 2: Data source : UN population database., accessed FAO. Rome.
March 2019. P. 23 Figure 9: The living Planet Index, 2018. WWF. 2018. Living
P. 11 Figure 4: Data source UN population database, accessed Planet Report - 2018: Aiming Higher. Grooten, M. and
March 2019. Almond, R.E.A.(Eds). WWF, Gland, Switzerland
http://www.livingplanetindex.org/home/index
P. 12 Map 3: Data source: UN population Database., accessed
March 2019. FAO, 2019. The state of the World’s biodiversity for food
and agriculture., Rome, FAO, 529 p.
P. 13 Map 4: UN population 2018.
P. 24 Map 10: Sepuru T.K. and Dube T., 2018. An appraisal on
FAO, 2017. The future of food and agriculture-Trends and the progress of remote sensing applications in soil erosion
challenges, Rome. mapping and monitoring. Remote Sensing Applications:
P. 14 Map 5: Data source: UN population Database., accessed Society and Environment, 9 (January 2018) : 1-9
March 2019. P. 25 Figure 10: Data source: FAOSTAT accessed on February
2019.
P. 15 Figure 5: Data source: UN population Database., accessed
March 2019. FAO and ITPS. 2015. Status of the World’s soil resources
44(SWSR) – Main report. Food and Agriculture Organization P. 34 Map 15: Source: WHO Database, accessed March 2019.
of the United Nations and Intergovernmental Technical https://extranet.who.int/sree/Reports?op=vs&path=
Panel on Soils, Rome. Italy. WHO_HQ_Reports/G36/PROD/EXT/FoodborneDisease
Burden
P. 26 Figure 4: FAO, 2018. Sustainable systems. Concept and
framework. 8 p. P. 35 Figuié M.. 2019. Food safty risks. In Bricas N., Benjebbar P.,
Dury S., Giordano T. and Hainzelin E., 2019. Food systems
P. 28 Map 12: Prepared by JRC-WAD
at risk. New trends and challenges. Montpellier Cirad,
P. 29 Le Mouël C. and Forslund A., 2017. How can we feed FAO, European Commission. Forthcoming.
the world in 2050? A review of the responses from global
Figuié M., Moustier P., Bricas N. and Nguyen T.T.L. 2019.
scenario studies. European Review of Agricultural
Food anxiety and trust in modern Vietnam. Page 320
Economics, 44 (4): 541-591.
in J. Ehlert and N. Faltmann, editors, Food anxiety and
FAO, 2018. The futur of food and agriculture. Alternative Globalising Vietnam. Palgrave Macmillan, Singapore.
pathways to 2050. Rome, FAO, 202 p.
Box: WHO Database, accessed March 2019
Box: Knox J., Hess T., Daccache A. and Wheeler T. 2012.
P. 36 Map 16: FAO. 2017. The future of food and agriculture –
Climate change impacts on crop productivity in Africa
Trends and challenges. Rome. 163 p.
and south Asia. Environmental Research Letters, 7 (3).
P. 37 Box: Data source: FAO Food price indice, Accessed
P. 30 Map 13: Colombo G., di Gaetano C., Guerra S., et al.
March 2019.
(2013). Mapping Climate Conflict Vulnerability and Victims.
EMAP Project. https://www.digitalmethods.net/Dmi/ P. 38 Map 17: IDMC, 2018. Global Report on Internal
MappingClimateConflictVulnerabilityAndVictims Displacement. http://www.internal-displacement.org
global-report/grid2018/
P. 31 Box: WHO Database, accessed March 2019.
P. 39 Box on top: Development Initiatives, 2018. 2018 Global
P. 32 Map 14: Data source: WHO Database, accessed
Nutrition Report: Shining a light to spur action on
March 2019.
nutrition. Bristol, UK: Development Initiatives. 161 p.
P. 33 NCD Risk Factor Collaboration (NCD-RisC), 2016.
Box at the bottom: Data source IDMC Displacement
Trends in adult body-mass index in 200 countries from
Data, Accessed March 2019 http://www.internal-
1975 to 2014: a pooled analysis of 1698 population-based
displacement.org/database/displacement-data
measurement studies with 19.2 million participants.
The Lancet; 387(10026):1377-96. P. 42 Map 18: FAO, 2011. The state of the world’s lands
and water resources for food and agriculture (SOLAW) –
IDF, 2017. Diabetes Atlas 8th edition. http://diabetesatlas
Managing systems at risk. Rome, FAO and London,
org/component/attachments/?task=download&id=254
Earthscan. 285 p.
Boxes: International Diabetes Federation, 2017. IDF
Diabetes Atlas – 8th edition. https://diabetesatlas.org/
45FOOD SYSTEMS AT RISK:
TRENDS AND CHALLENGES
THE SCIENTIFIC HANDOUT
This work benefitted from European Commission funds through the FAO Agrintel facility.
Its content is the sole responsability of its authors and does not necessarily
reflect the views of the European Commission.You can also read