FOOD VALUE CHAIN, FROM seeds TO you - LONGPOINT ...
←
→
Page content transcription
If your browser does not render page correctly, please read the page content below
FOOD VA LU E CHAIN,
FROM seeds TO you
WINTER 2018
“T he food industry has
 tremendous opportunity,
 as well as an obligation, to
 meet the needs of new, more
 sophisticated and more
 demanding consumers while
 satisfying shareholders’
 demands for returns—
 and in doin g so creating a
 sustainable food supply for
 the new millennium.”
                      – Deloitte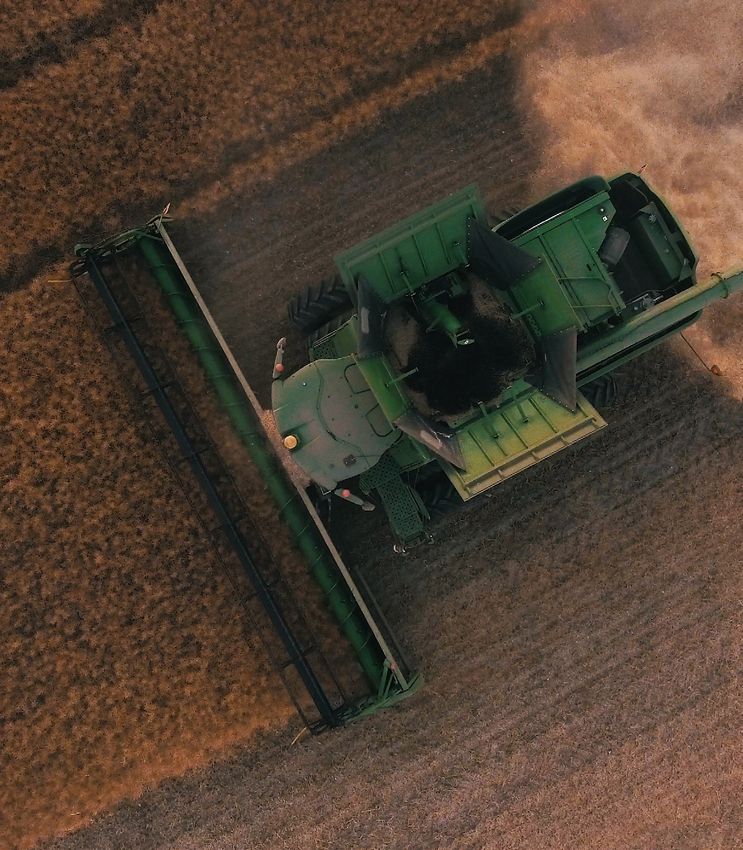
ta b l e o f c o n t e n ts
INTRODUCTION                                        4
        wh ere do es yo u r fo o d c o m e from?

PA RT I :                                         7
        Wh en fa rm to ta b l e was a s hort t r ip

PA RT I I:                                        10
        P ro c es s ed a n d Pac k aged
        by th e M i gh ty F ew

PA RT I II:                                       13
        C h a l l en ges o f
        Fres h a n d S p ec i a l

PA RT I V:                                        17
        S u m m a ry a n d I m pact
        o n Rea l Estate M a rk ets

REFERENCE NOTES                                    22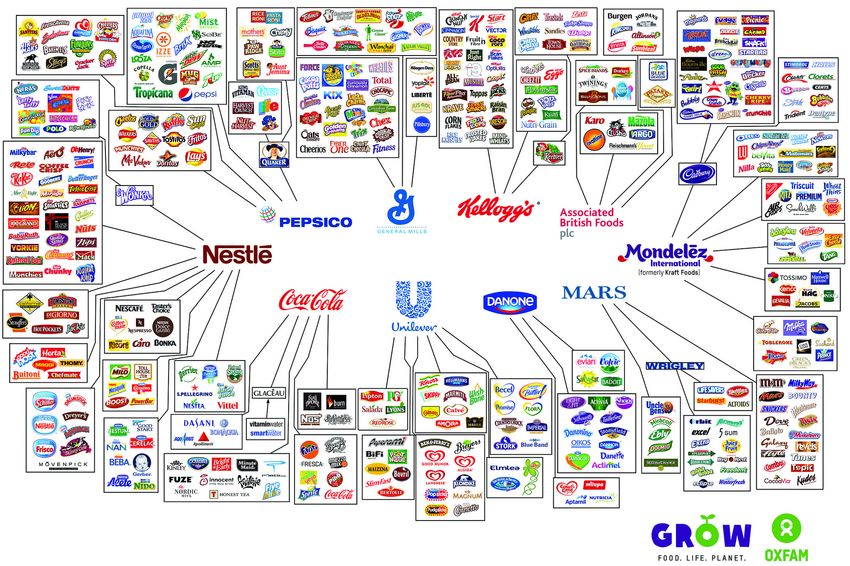
where does your food come from?
In a recent study, 71% of consumers noted that they make purchasing
decisions based on their understanding of a product’s full ingredient
list, and 54% said that they prioritize the source of their food. These
two factors were rated as being more important than organic labeling,
packaging, fat content, and brand. 1 For modern grocery shoppers, the
source of food matters more than ever.
To better understand the significance of these consumers procure food products, has dramatically
findings, we must first define what we mean by impacted all participants of the “food value chain.”
“source.” That is, are we referring to the original
physical source of the food (i.e., mineral, plant, Deloitte defines the food value chain as “the network
animal), the geographical location and farm where of stakeholders involved in growing, processing,
it originated, the processing plant where it was and selling the food that consumers eat – from farm
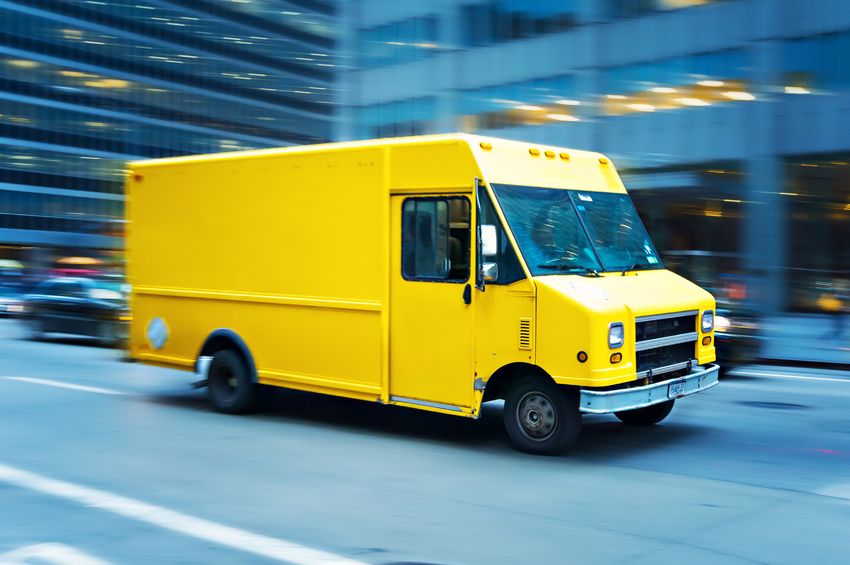
prepared, the company that packages it, the logistics to table.”2 The five key categories in this system are:
firm that distributes it, or the grocery store that sells it. suppliers of farming inputs such as seeds, fertilizer,
For consumers, the concept of “source” encompasses and equipment; food producers engaged in farming
all these elements. A global “food awakening” is and ranching; processors that handle the harvesting
driving a thirst for knowledge about the foods we eat and processing of raw foods; brands that package
along with a desire to eat healthier foods, irrespective and transport the finished food product; and grocery
of individual background, wealth level, or age. This retailers that deliver the product to the consumer.
food awakening, in addition to a global population
movement into larger cities and a shift in how
F I G U R E 1 : K E Y P L AY E R S : T H E F O O D VA LU E C H A I N
“BIG AG” GROCERY
“LEFT OF “RIGHT OF
“CONSUMER”
THE FARMER” THE FARMER”
INPUTS PRODUCERS PROCESSORS BRANDS RETAILERS
“Seeds, fertilizer, “The farmer” “The ABCDs of “CPG and “Supermarket
chem, equipment” commodities” distributors” chains”
• Dow Chemical • Livestock production • ADM • Nestle • Wal-Mart
• DuPont • Crop production • Bunge • PepsiCo • Costco
• ChemChina • Horticultural science • Cargill • Coca-Cola • Kroger
• Syngenta • Dreyfus • Unilever • Target
• Bayer • Danone • Albertsons
• Monsanto • General Mills • Publix
• John Deere • Kellogg’s • HEB
• Mars • Whole Foods
• Associated British Foods • Southeastern Grocers
• Mondelez
F O O D VA L U E C H A I N . F R O M s e e d s t o y o u 4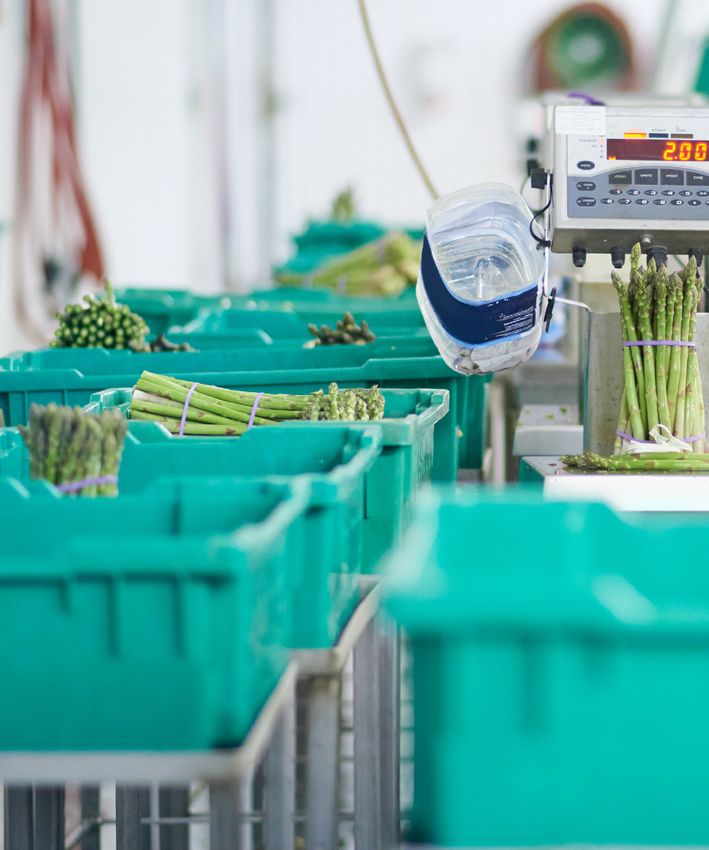
For the purposes of clarity, we have placed food retail         Stagnating demand for traditional grocery products has
products into four major categories: Repeat, Fresh,             led to huge consolidation in the realm of Big Ag, and as
Special and Frozen. Repeat refers to the packaged               a result, packaged foods are increasingly controlled by
center-aisle products that have historically been the           a small number of global mega-companies. As demand
mainstay of the grocery industry because they are               for mass-produced packaged foods continues to stall
typically bought on an ongoing basis. If the product            or decline, these same companies will focus on the
comes wrapped, in a box, or in a can, it probably falls into    fresh and specialty foods categories. This process
this category. Fresh refers to perishable products such         has already begun and is expected to continue into
as produce, meat, seafood, and prepared foods with              the foreseeable future (Figure 5). Further, growth in
limited shelf life. These products require specialized          demand for fresh and special grocery products coupled
transportation and storage. Special products are those          with improved capabilities for customized delivery has
not typically stocked in mainstream supermarkets.               resulted in substantial changes in the strategies of Big
These items include ethnic and locally sourced products         Ag and big brand companies.
from non-national suppliers. Lastly, frozen products can
include any of the items listed above, in a frozen state.
Historically, within each category, there have been
different participants, regulations, supply chain and
logistics models, and consumer requirements. Today,
these categories and their members are all converging
in order to meet the current and projected shopping
patterns of the modern consumer.

Today, the food value chain for most products is
dominated by “Big Ag” companies: large global firms
that dominate each phase of the chain (Figure 1). For
instance, a wheat farmer (large or small) in Kansas
may grow his crop using inputs from DuPont and sell
it to Cargill, which then transports the grain to Kellogg,
which in turn processes these raw ingredients into
snack products that are sold to The Kroger Company,
which finally sells it to the consumer. The consumer can
buy the product in the store itself, click and collect at
the store, or have it delivered to his or her home.

It is important to note that each food category and
individual item within each category requires its own
distinct combination of the five components of the
food value chain. Big Ag companies, dominant in
three of the five categories, have historically operated
predominantly in the supply chain for Repeat goods,             The real estate infrastructure of the food value
as this was where the most money was to be made.                chain is in the process of a massive restructuring to
Fresh and Special products, which necessitate                   accommodate modern supply chain models. The
specialized handling, are costlier to grow and produce,         impact of this evolution has been felt mostly in the
require more complex supply chain management                    industrial sector, where we believe industrial properties
models, and require more government oversight and               will continue to move closer to population centers (see
regulation, have historically seen less demand from             Longpoint Review Spring 2018). Less obvious changes
consumers. Consumer demand patterns, however, are               are occurring in the grocery brick and mortar sector in
rapidly changing.                                               the form of new concept stores, smaller stores, more
                                                                urban locations, new entrants (e.g., Lidl), increased

                                                     F O O D VA L U E C H A I N . F R O M s e e d s t o y o u               5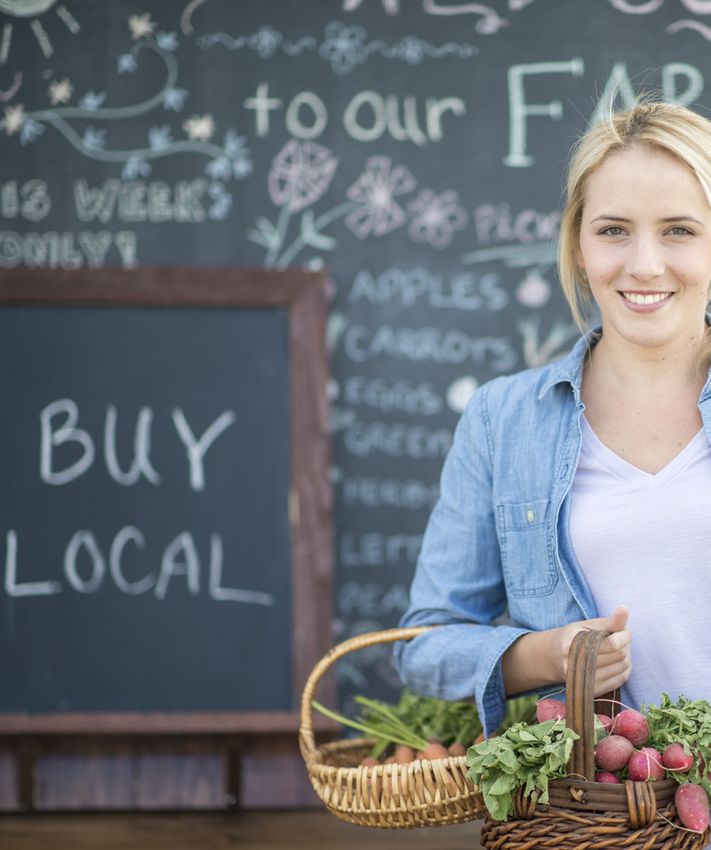
mergers and acquisitions among retailers (e.g.,                    This paper examines the changing preferences of
Amazon/Whole Foods) and distributors (e.g., Unified/               today’s consumers and the evolving roles of the key
SuperValu), growing home delivery options, click and               members in the food value chain, along with the
collect strategies, and growth of ethnic grocers. Thus, it         resulting impact on real estate markets.
will come as no surprise that there are currently exciting
investment opportunities in almost every aspect of the
food value chain (Figure 2).

F I G U R E 2 : T R E N D S I N F O O D LO G I S T I C S

                                                            Consumer

    Demand-
      side
     Trends

                   Lifestyle Trends                   Delivery Mechanisms                       Grocery Trends

                     Urbanization                                                                    Source
                                          Brick &            Home                Click &
                  Demographic shifts      Mortar            Delivery             Collect         Full Disclosure

                 Emerging consumer                     Instant gratification                          Local
                    technology
                                                           Easy returns                             Organic

                                                            Low cost                                 Ethnic

                                                         Large selection                              Fresh

     Supply-
      side
     Trends

                 Big AG Consolidation           Brands & Retailers Go Vertical             New Grocery Store Formats

                 Consolidation of input   Consolidation of large brands (Kraft-Heinz)         Rise of small limited
                      producers                                                             assortment chains (Aldi,
                                            Large brands acquiring smaller brands                Trader Joe’s)
                 Consolidation of AG
                     processors           Investments in fresh and specialty products        Rise of specialty grocer
                                                                                             chains (fresh & ethnic)
                Increasing competition          Amazon-Whole Foods merger
                                                                                               Rising store counts
                   Declining margins      Costco, Walmart, Kroger vertical integration
                                                                                               Smaller store sizes
                                            United Natural Foods-Supervalu merger
                                                                                                   More urban

                                                    Supply Chain Restructuring

                                                      F O O D VA L U E C H A I N . F R O M s e e d s t o y o u           6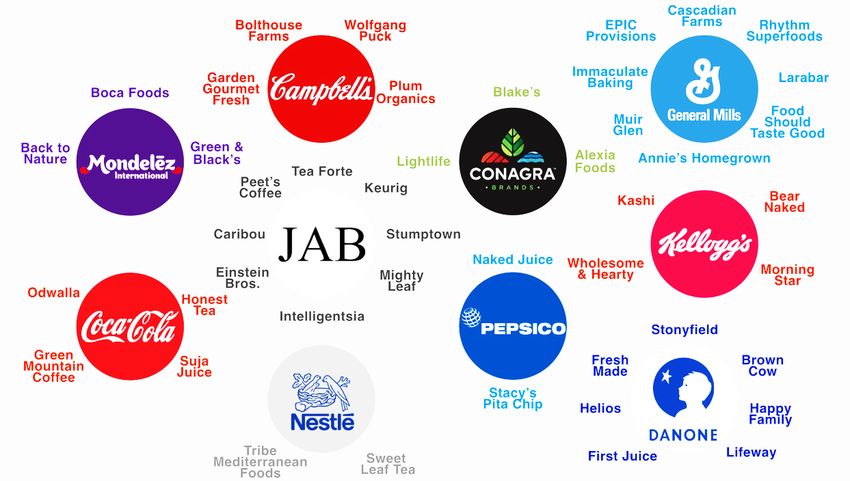
H i sto ry

When Farm to Table Was a Short Trip
In 1798, when English clergyman Thomas Malthus famously argued that
global population growth would ultimately outstrip the world’s food
supply, he could not have predicted the rise of mechanized agriculture,
advances in horticultural science, and the globalization of the world’s
food supply chain. 3 Agriculture around the world has evolved from a
system of family farms and local agrarian economies to a system of
mass production and global distribution on a scale unimaginable to
Malthus and his contemporaries.
The U.S. offers an ideal case study for global changes
in the food supply chain. In colonial times, the
economy was almost entirely agricultural. At least 90%
of working Americans made part or all of their living
through farming.4 Most of the food people ate came
from their own farms, or from those of their neighbors.
The advent of the Industrial Revolution, however,
along with population growth and related public policy
initiatives, heralded an era of enormous change, and
led to the transition to a mechanized and consolidated
agricultural sector. Then, in 1862, the Homestead Act
allocated 270 million acres of free land to approximately
1.6 million people. Participants were granted ownership
of a parcel once they built a home and cultivated the
land, a policy initiative that bolstered the fortunes of
many impoverished farmers in the East and Midwest.
As the agricultural economy progressed, these smaller
farms increasingly merged into larger ones.5 At the
same time, a range of technological advances led to
greater crop yields and the logistical means to deliver
them to distant locations. The McCormick reaper,
steam and gasoline-powered tractors, hybridized
corn, and coast-to-coast refrigerated shipping were all
developments that linked the agricultural economies of
previously disparate markets.6

In the mid-1900s, advances in mechanical engineering,        of “combine” harvesters – used to cut, thresh, and clean
horticultural science, and transportation technology         grain simultaneously – bolstered crop yields.7 Meanwhile,
accelerated the growth of the national agricultural          the use of chemical fertilizers and pesticides grew
economy. Between 1930 and 1960, the number of                dramatically.8 Then, in the 1960s, genetic modifications
tractors increased fivefold, while the number of farm        and the cultivation of hybrid strains of corn, wheat, and
horses and mules declined by 87%. The size and efficacy      rice boosted crop yields even further.9

                                                  F O O D VA L U E C H A I N . F R O M s e e d s t o y o u               8
These mid-twentieth-century technological and share of the overall US population of farm laborers
scientific developments led American farm productivity declined from 41% in 1900 to 1.9% in 2000. 12
and size to double between 1948 and 1998. Grain yield
per acre for corn, a mainstay in the U.S. agricultural Thus, the current food industry is almost unrecognizable
economy, increased by more than five times in the 80- from its earlier incarnations. Food that used to travel
year period between 1936 and 2016 (see Figure TBD),11 directly from the field to the kitchen table may now
and the average farm size increased from under 200 cross multiple state and country borders before landing
acres to over 400 acres. With larger farms producing on the consumer’s table, leaving people with very little
more efficiently, the total number of farms declined knowledge of the origin of their food.
from over five million to under three million, and the
F I G U R E 3 : T H E C O R N Y I E L D “ H O C K E Y S T I C K ” 10
U.S. Corn Grain Yield Trends Since 1866
Data Source: USDA-NASS (as of Jan 2017)
200
180
2016
160
140
y = 1.8858x - 3635.8515
R 2 = 0.9166 2012
Grain yeild (bu/ac)
120
100
1988
80
60
y = 0.76x - 1452.40
R 2 = 0.72
1956–2016
40
1937–1955
1866–1936
20 2016
0
1840 1860 1880 1900 1920 1940 1960 1980 2000 2020 2040
F O O D VA L U E C H A I N . F R O M s e e d s t o y o u 9the mighty
few
F O O D VA L U E C H A I N . F R O M s e e d s t o y o u 10Processed and Packaged by the Mighty Few
Much of our traditional center aisle food today comes from “row crops”
– that is, crops that are planted in rows to accommodate mechanized
agriculture. In the increasingly consolidated food industry, Big Ag
dominates every phase of the food value chain for row crop agriculture.
Up until 2016, six supplier firms – Dow Chemical, control more than 80% of the global grains market. 20
DuPont, ChemChina, Syngenta, Bayer, and Monsanto As a result of the large market share occupied by
– controlled more than 60% of the market for these firms, row crop farmers are subject to pricing
agricultural inputs (seeds, pesticides, and herbicides). pressures from the mega-companies from which
Each of the six firms has since merged with another they source their farming inputs, as well as from the
company.13 Chemical Company and DuPont Pioneer large firms to which they sell their farming outputs.
merged in 2017, with a deal size of roughly $62 billion, Consequently, the total number of farms in the United
and the combined company now carries out functions States has declined year over year since 2007 and
ranging from materials science to agricultural farm net income has remained low, and there is little
technologies.14 ChemChina acquired Swiss company sign of this trend abating. 21
Syngenta in July 2017 for $43 billion,15 and Bayer
bought Monsanto in June 2018 for $66 billion, further Once the food has been grown and harvested, it
consolidating this segment of the market.16 Individual is transferred to a distributor, which is typically a
farmers and farming companies now source most of major global consumer package goods (CPG) brand
their inputs from one of these providers. For example, (Figure 4). At this level of the value chain, there
90% of U.S. cotton seeds come from one of these are ten global companies that control nearly every
three mega-companies.17 major food and beverage brand in the world: Nestlé,
PepsiCo, Coca-Cola, Unilever, Danone, General
Just as a few companies dominate row crop Mills, Kellogg’s, Mars, Associated British Foods, and
agriculture, two types of crops dominate the US farm Mondelez.22 McKinsey & Company notes that since
production economy: corn and soybeans. In 2017, the 2011, CPG companies have witnessed declining year-
total value of production for corn was $48.5 billion, over-year growth rates, which are now in the low single
while the total value of production for soybeans was digits, as well as shareholder returns that have lagged
$41 billion. The next largest US crop is hay, at $16.2 the S&P 500. McKinsey attributes this trend to new
billion.18 The outsized production share of corn and distribution channels and buying preferences, as well
soybeans reflects the geographic farming landscape, as disruptive new brands and retailers. 23 As this arena
with corn and soybeans accounting for 172.2 million has become more competitive, firms have focused
harvested acres, while staple crops like cotton, on cutting operating costs and creating greater
sorghum, and rice accounting for a combined total of efficiency through mergers and acquisitions. A study
only 18.8 million acres harvested annually.19 Thus, a by PwC covering 115 CPG deals each valued at over
small number of crops are generating massive profits $3 billion found that the average deal size had more
for a small number of corporations at the input stage than tripled between 2014 and 2016. 24 A significant
of the food value chain. proportion of this increase can be attributed to the
trend of larger firms buying smaller brands in the
The third stage of the food value chain is also marked natural and ethnic foods category, such as Nestle’s
by a high degree of consolidation among companies acquisition of Terrafertil, Atrium Innovations, and
engaged in purchasing and processing. The “ABCDs” Tribe Mediterranean Foods.
of commodities – ADM, Burge, Cargill, and Dreyfus –
F O O D VA L U E C H A I N . F R O M s e e d s t o y o u 11Beyond industry consolidation and new concept Today’s food products come from an increasingly
brand acquisitions, some firms are vertically vast and complex web of inputs, farmers, processors,
integrating across multiple levels of the food value distributors, and supply chain logistics. However, at
chain. This is particularly true of Kraft Heinz tomato every stage of the value chain, a few industry giants
products. The value chain process begins with dominate. Long gone are the days when people grew
Heinz propriety seeds, which are supplied by the and ate their own food or bought it from their neighbor.
HeinzSeed company. 25 These seeds are incubated Today’s food may have been grown in one state and
in warehouses and subsequently planted on farms processed in another, with stops at multiple locations
located primarily in California’s Central Valley, before reaching its final destination, making it more
which supplies approximately 95% of the nation’s difficult for consumers to understand the source
processed tomato stock and one third of the entire of their food. However, in response to increased
world’s processed tomatoes. 26 After harvest, the pressure from consumers, the members of the food
tomatoes are transferred to a partner food processing value chain have begun making a more concerted
company such as Morning Star, the world’s largest effort to provide greater transparency when it comes
tomato-processing organization, which has three to food source.
facilities in the Central Valley. 27 After processing,
the refined tomato-based product is packaged and
transferred back to Kraft Heinz, which relies on a
network of 88 distribution centers nationwide to route
goods to the end buyer, which is typically a grocery
store location. 28
F I G U R E 4 : T H E G I A N T S W H O P R O D U C E YO U R F O O D
F O O D VA L U E C H A I N . F R O M s e e d s t o y o u 12F r es h a n d
s p ec i a l
F O O D VA L U E C H A I N . F R O M s e e d s t o y o u 13Challenges of fresh and special
While consumer demand for Repeat items drove the Because of the immensity of the logistical challenges
growth of Big Ag during the 20th century, demand for involved in the delivery of Fresh and Special products,
these row crops and center aisle products has been key food industry firms have been consolidating
stagnating in recent years. As consumer sentiment has vertically across the supply chain to ensure quality
steadily shifted toward fresh, organic, locally sourced and quantity. In the grocery wholesale sector, for
food, American farmers have also begun to focus on example, Supervalu bought Unified Grocers for
fresh and specialty products. 29 Although Big Ag is $390 million in 2017, giving the national wholesale
more economically efficient than smaller companies chain access to 345 independent grocery stores
and accounts for the majority of agricultural sector on the West Coast. 31 In the poultry sector, Tyson
revenue, brand companies selling Fresh and Special Foods integrated the entire supply chain – breeding
products are on the rise. In addition, the growth and stock, egg hatcheries, farms, processing facilities,
success of “healthy” grocery chains such as Whole and transportation infrastructure. In grocery retail,
Foods and Sprouts is due to locally sourced or The Kroger Company now operates seventeen dairy
natural foods branding. In the period spanning 2016 plants, ten deli and bakery plants, two beverage
to 2018, Sprouts opened 67 new retail stores, making plants, two cheese plants, one meat plant, and a fleet
it one of the fastest growing grocery retailers in the of vehicles that conduct 8,600 daily deliveries. 32 33
country. 30 Further, ethnic grocers such as Presidente, Similarly, Costco is developing a poultry processing
Cardenas Markets, El Rancho, and H Mart have facility in Nebraska that will supply the 90 million
emerged as ethnic grocery specialists, driving Publix chickens it sells per annum. In 2016, taking its cue
and Winn Dixie to convert some existing stores into from competitors such as Kroger and Albertsons,
Latin-themed banners, Publix Sabor and Fresco which operate 37 and 19 dairy manufacturing plants
Y Mas. Even traditional grocers such as Kroger, respectively, Walmart decided to enter the dairy
Walmart, and Publix have been changing the internal business with the establishment of a 250,000 square
layouts of their stores to increase local and organic foot dairy plant in Indiana. 34
offerings and provide a more expansive selection of
healthful produce.
F O O D VA L U E C H A I N . F R O M s e e d s t o y o u 14As the trend towards consolidation and vertical that maintain a safe cold storage environment for
integration continues, new, increasingly complex meat in transit. 37 The dairy supply chain is similarly
logistical infrastructure designed to deliver fresh complex. The Cabot Creamery Co-operative in New
products is emerging. Fresh products require a England transports milk in special stainless-steel
complex network of climate-controlled transportation insulated trucks from over 1,000 family farms to four
and storage infrastructure that reduces spoilage and refinement facilities (creameries). After processing,
maintains quality. In addition, specialized warehousing finished milk, yogurt, cheese, and butter products
facilities for perishables must be located near the each require their own temperature settings for the
consumer or grocery retail destination in order to journey to their final destination. 38
minimize transportation time and distance. Each
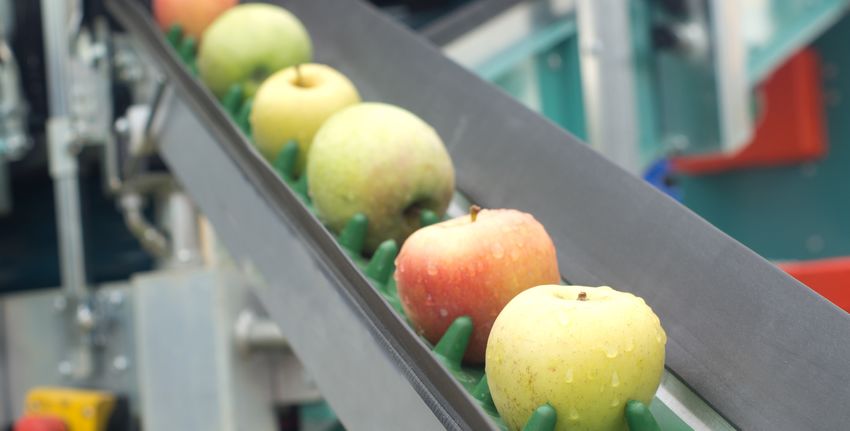
individual supplier must pass food safety checks and Produce requires similarly specialized logistical
inspections that are both rigorous and expensive. infrastructure. For example, Stemlit Fruit harvests apples
The necessity of third-party intermediaries (there are from company-owned orchards in four districts of
over 33,000 different food manufacturing companies Washington state between August and October every
in the United States) 35 for handling the sorting and year, and then packages and stores the fruit in controlled
distribution of local produce adds an additional layer atmosphere facilities. These highly specialized facilities
of complexity to procurement. 36 use nitrogen gas to reduce oxygen levels from 21%
to 2%, and maintain a strict climate of 32-36°F with 95%
In the meat supply chain, for example, cold storage humidity. While seafood products share some of the
procedures begin in the slaughterhouse, where same basic requirements, they pose their own particular
carcasses must be cooled to under 7°C (4°C for logistical challenges. Alvaro Carril of Chile-based LAN
poultry) to avoid bacterial growth and extend shelf Cargo, which transports seafood and produce from
life. A network of climate-controlled aircraft, vessels, South America to the US, notes, “Transporting salmon
trucks, and warehouse facilities are aided by is different than moving flowers, and both commodities
compressors and ventilation and insulation systems require special and differential treatment.” 39
F I G U R E 5 : B I G F O O D B R A N D S B U Y I N G O R G A N I C / N AT U R A L F O O D B R A N D S
Atrium Terrafertil
Innovations
F O O D VA L U E C H A I N . F R O M s e e d s t o y o u 15Special products that exist outside the main grocery Although the specific logistics requirements of
supply channels also depend on a specialized, often different Fresh and Special goods vary considerably,
local, supply chain. For example, the supermarket common to all is an increasingly complex web of
chain Sprouts uses a decentralized procurement management systems, transportation resources,
system to source a variety of natural and organic and industrial warehousing infrastructure needed
products. The Sprouts supply chain of 2,400 products to deliver products to consumers. If, as expected,
from over 850 vendors is primarily locally sourced, demand for these products continues to grow, then
meaning food comes from within a 500-mile radius the need for logistics systems that can safely and
of the retail store. 40 The chain accomplishes this efficiently deliver them to consumers will also increase,
feat by using dedicated regional procurement teams creating a considerable supply-demand imbalance in
that have the flexibility to buy different products in the industrial and retail real estate sectors, and thus
different locations based on availability. 41 considerable investment opportunities for Longpoint
Realty Partners.
Similarly, ethnic food suppliers are building out their
global logistics infrastructure in response to growing
demand. The shopping preferences of the two
fastest growing demographic segments in the US,
Asian-Americans and Hispanics, have spurred the
rise of alternative grocery channels. 42 For example,
Goya, the largest US-based manufacturer of Hispanic
food, offers over 2,500 products from the Caribbean,
Mexico, Spain, Central, and South America, and
operates 26 distribution facilities throughout the US,
Puerto Rico, the Dominican Republic, and Spain. 43
Similarly, products sourced by Diaz Foods, another
ethnic wholesale distributor, reach thousands of
East Coast customers by travelling through one
40,000 square foot cold storage facility and one
60,000 square foot dry storage facility, both located
in Virginia. 44 The company recently expanded its
distribution network by leasing a trucking fleet
through a partnership with Ryder, and will increase
its warehouse footprint in the near future. The
partnership enables Diaz Foods to incorporate the
most technologically advanced vehicles into its
supply chain without making the capital investment
of owning them, thereby maximizing efficiency and
minimizing costs while providing optimal delivery of
their products. 45
F O O D VA L U E C H A I N . F R O M s e e d s t o y o u 16r e a l estat e i m p l i cat i on s
Summary and Impact on Real Estate Markets
The rise of the Fresh and Special segment s                                     The increasing complexity of the food retail
necessitates the combination of infill logistics facilities                     landscape and consequent rise of specialty and
and locally-relevant grocery retail concepts that can                           alternative format grocers has created a niche for
effectively and efficiently deliver these products                              third-party logistical (“3PL”) solutions. Given that
to today’s consumers. As urban brick and mortar                                 investments in distribution real estate infrastructure
grocery retail stores grow in number and diversify by                           require major capital outlays with significant fixed
concept type and size, logistics industrial facilities will                     costs, it makes sense to aggregate the warehouse
continue to be built nearer to population centers and                           operations for multiple smaller firms under a few
to service more varied food value chain participants.                           external providers. 48 Larger supermarket chains such
                                                                                as Walmart have also sought to manage expenses
In the past, the dominant grocery logistics model                               by moving to outside logistics companies, which
employed by major supermarket chains was to                                     can lower labor costs by 50%. 49 Thus, over the past
own and operate their own distribution facilities, an                           twenty years, many grocery chains have shed their
approach intended to ensure product quality and                                 supply chain real estate to 3PLs, which have expanded
quantity. 46 Then, in the late 20th century and early                           their warehousing and logistics infrastructure.
2000s, most major grocery store chains built large                              For example, the Kroger Company has outsourced
distribution centers one or more hours outside of                               over 6.7 million square feet of warehouse space
urban areas to serve stores within a broader region.                            (one-third of its total capacity) over a ten-year period.
Many of these facilities are still directly owned and                           Other chains such as Ahold, Safeway, Trader Joe’s,
managed by supermarket chains. For example, Publix                              A&P, Pathmark, BI-LO, and Wawa have followed suit. 50
warehouse facilities in Florida today are on average
42 years old with 383,400 square feet of space, 25-                             Grocery 3PLs are now expanding at a rapid rate
foot clearance height, and 54 dock-high doors. 47                               to meet growing demand, driving competition

FIGURE 6: U. S. GROCERY INDUSTRY GROW TH

                                                                                                         N u m b e r o f N at u r a l a n d
                   T o ta l U . S . S u p e r m a r k e t S a l e s                                     s p e c i a lt y S u p e r m a r k e t s

 ($ in billions)
700                                                                                7,500
         17% increase                                                                         35.6% increase
         from 2011-2017                                                                       from 2011-2017
650                                                                                                                                                        7,047
                                                                                   7,000
                                                                                                                                                   6,778
                                                                      $612                                                               6,616
                                                              $600
600                                                 $588                           6,500                                       6,386
                                          $574
                                                                                                                     6,179
550                                $549
                         $539                                                      6,000
         $523                                                                                                5,738

500                                                                                5,500
                                                                                             5,197
450                                                                                5,000

400                                                                                4,500
         2011           2012       2013   2014      2015      2016    2017                   2011            2012    2013      2014      2015      2016    2017
      Source: U.S. Census Bureau                                                           Source: Nielsen

                                                                      F O O D VA L U E C H A I N . F R O M s e e d s t o y o u                                     18
for urban industrial space. Large wholesale and USDA defines “specialty distributors” as providers
distribution companies such as C&S Wholesale of “…frozen foods, dairy products, meat and meat
Grocers, Supervalu, SpartanNash, and Sysco, which products, or fresh fruits and vegetables…[which]
tend to cater to traditional branded CPG products, operate in niche markets…”). 53 These third-party firms
have recently made significant investments in their today account for 45% of total grocery wholesale
metropolitan warehouse infrastructure. C&S, the tenth revenues. 54 That said, many key retailers have
largest private company, now has over twenty facilities chosen to invest in their own infrastructure in order to
in the Northeast alone, with most of them situated on handle the logistics of fresh and unique products. For
the outskirts of major cities such as Baltimore, New example, Amazon has invested in three million square
York, Philadelphia, and Hartford. 51 Sysco has over 120 feet of warehouse space to power its AmazonFresh
U.S. warehouses, with multiple dedicated facilities and Amazon Prime Pantry grocery delivery programs,
of varying sizes and locations for each major metro which is still only one-tenth of the warehouse space
area. For example, its South Florida footprint consists that Wal-Mart uses for specialty food distribution. 55
of smaller handling facilities located near the airport,
a 657,000 square foot facility 15 miles Northwest of Today’s brick and mortar grocery landscape reflects
Miami, and additional fresh-focused facilities in Fort these investments in logistics infrastructure. Supply
Lauderdale and West Palm Beach. 52 chain optimization and expanded infill warehousing
facilities have enabled a proliferation of small-
Growing demand for Fresh and Special grocery format supermarkets. Chains such as Aldi, Lidl, and
items and the related logistical complexities has Trader Joe’s – with average store sizes between
also bolstered the role of “specialty distributors” (the 8,000 and 15,000 square feet – have flourished in
F O O D VA L U E C H A I N . F R O M s e e d s t o y o u 19urban environments where retail space is limited. by 32% and total store sales have increased by 17%,
Aldi led the nation in the number of two-year net driven by the growth of new store concepts, sizes,
store openings between 2016 and 2018, with 171 and urban locations. This trend was made possible
new locations. 56 Larger retail chains such as Walmart by the development of an urban food logistics
have also pioneered smaller brick and mortar brands, network nationwide.
such as Walmart Neighborhood Market, which are less
than half the size of a standard Walmart Supercenter. Regardless of whether food is procured through brick
These changes in grocery store formats have and mortar stores, curbside pickup, or home delivery,
caused the median store size in the U.S. to decline real estate operators must work to understand the
by 12.2% since 2006. 57 As these smaller stores have evolving supply-chain landscape and adapt according
penetrated urban areas, over the past six years, the to the physical requirements of the food industry in
total number of U.S. grocery stores has increased the 21st century.
DWIGHT ANGELINI T O M S T I PA N O V
m a n a g i n g pa r t n e r a s s o c i at e
617 861 9761 617 861 97 72
a n g e l i n i @ l o n g p o i n t. c o m s t i pa n o v @ l o n g p o i n t. c o m
F O O D VA L U E C H A I N . F R O M s e e d s t o y o u 20ReferEnce Notes
1. “ How Consumer Demand for Transparency is Shaping the Food 19. U.S.D.A. Ibid.
Industry, The 2016 Label Insight Food Revolution Study, Label
Insight. https://www.labelinsight.com/hubfs/Label_Insight-Food-
20. P
utz, Adam. “The ABCDs and M&A: Putting 90% of the global grain
Revolution-Study.pdf?hsCtaTracking=fc71fa82-7e0b-4b05-b2b4-
supply in fewer hands.” 21 February 2018. Pitchbook.com, https://
de1ade992d33%7C95a8befc-d0cc-4b8b-8102-529d937eb427.
pitchbook.com/news/articles/the-abcds-and-ma-putting-90-of-the-
global-food-supply-in-fewer-hands.
2. “The Food Value Chain: A Challenge for the Next Century. Deloitte,
2013. https://www2.deloitte.com/content/dam/Deloitte/ie/Documents/
21. “Total number of farms in the United States from 2000 to 2017.”
ConsumerBusiness/2015-Deloitte-Ireland-Food_Value_Chain.pdf.
Statista, https://www.statista.com/statistics/196103/number-of-farms-in-
the-us-since-2000/.
3. “ Thomas R. Malthus. “Classic Readings in Economics.” Middlebury
College, History of Economic Thought, http://sites.middlebury.edu/
22. T
aylor, Kate. “These 10 companies control everything you buy.”
econ0450f10/files/2010/08/malthus.pdf.
Business Insider, 28 September 2016. BusinessInsider.com,
https://www.businessinsider.com/10-companies-control-the-food-
4. Malthus, T.R. Ibid. industry-2016-9.
5. “The Homestead Act.” History.com, https://www.history.com/this-day-in- 23. H
enrich, Jan et al. “Agility@Scale: Solving the growth challenge in
history/the-homestead-act. consumer packaged goods.” https://www.mckinsey.com/industries/
consumer-packaged-goods/our-insights/agility-at-scale-solving-the-
growth-challenge-in-consumer-packaged-goods.
6. S
pielmaker, D. M. “Growing a Nation Historical Timeline.” 21 March
2018. https://www.agclassroom.org/gan/timeline/farm_tech.htm.
24. Neely, J, Derek Townsend, and Dominic Ricketts. “Megadeals in
Consumer Packaged Goods.” 15 February 2017. Strategy+Business,
7. “Agricultural Mechanization Timeline.” National Academy of Sciences,
https://www.strategy-business.com/article/Megadeals-in-Consumer-
2018. Greatest Engineering Achievements of the 20th Century, http://
Packaged-Goods?gko=d7e96
www.greatachievements.org/?id=3725.
25. “ 57 Varieties.” Tomato Heinz Seed. http://www.heinzseed.com/new/
8. Dimitri, Carolyn, Anne Effland, and Neilson Conklin. “The 20th Century
hs_about.html.
Transformation of U.S. Agriculture and Farm Policy.” Economic
Information Bulletin Number 3, United States Department of Agriculture,
Economic Research Service/USDA,June 2005. https://www.ers.usda. 26. Daniels, Jeff. “California’s tomato business is rotten — and farmers are
gov/publications/pub-details/?pubid=44198. Page 6. seeing red.” CNBC, 28 July 2016. https://www.cnbc.com/2016/07/28/
californias-tomato-business-is-rotten--and-farmers-are-seeing-red.html.
9. A
rnold, Carrie. “The Past, Present and Future of Agriculture.”
Smithsonian Digital Studio, 30 June 2016. Smithsonian.com, https:// 27. “2017 Tomato Paste and Processed Tomato Statistics.” The
www.smithsonianmag.com/science-nature/video-past-present-and- Morning Star Packing Company, 2017. http://morningstarco.com/
future-agriculture-180959618/. statdocs/2016%20Exhibits%20Brochure.pdf.
10. N
ielsen, R.L. “Historical Corn Grain Yields for the U.S.” Purdue 28. T
rebilcock, Bob. “Keeping it nimble at Kraft Heinz.” Logistics
University, May 2017. https://www.agry.purdue.edu/ext/corn/news/ Management, 28 February 2018. https://www.logisticsmgmt.com/
timeless/yieldtrends.html. article/keeping_it_nimble_at_kraft_heinz.
11. Nielsen, R.L. Ibid. 29. A
ngelini, Herter, and Stipanov. “All Retail is not Created Equal.”
Longpoint Realty Partners Review, Spring 2017.
12. D
imitri, Effland, and Conklin. Page 2.
30. “ 2018 Directory of Supermarket, Grocery & Convenience Store
Chains.” Chain Store Guide, March 2018. http://www.chainstoreguide.
13. K
ing, Lindsay. “Five of the ‘Big 6’ agricultural corporations, including
com/csgonline/industryinformation/supermarket.pdf.
Monsanto, looking to merge.” The Fence Post, 25 April 2017. Summit
Daily, https://www.summitdaily.com/news/five-of-the-big-6-agricultural-
corporations-including-monsanto-looking-to-merge/. 31. Springer, Jon. “Supervalu completes Unified deal.” Supermarket
News, 26 Jun 2017. https://www.supermarketnews.com/retail-financial/
supervalu-completes-unified-deal.
14. “DowDuPont Fact Sheet.” DowDuPont, May 2018. http://www.dow-
dupont.com/home/default.aspx.
32. 2
016 Kroger Fact Book. The Kroger Company.
http://ir.kroger.com/Cache/1500100492.
15. “ ChemChina Clinches Its $43 Billion Takeover of Syngenta.” Reuters,
PDF?O=PDF&T=&Y=&D=&FID=1500100492&iid=4004136.
5 May 2017. Fortune.com, http://fortune.com/2017/05/05/chemchina-
syngenta-deal-acquisition/.
33. W
ells, Jeff. “Kroger launches online portal for local product suppliers.”
Food Dive, 25 September 2017. https://www.fooddive.com/news/
16. “Bayer Closes Monsanto Acquisition.” 7 July 2018. Monsanto.com, https://
kroger-launches-online-portal-for-local-product-suppliers/505721/.
monsanto.com/news-releases/bayer-closes-monsanto-acquisition/.
34. S
amuel, Steward. “Why Walmart’s getting verticaly integrated.” IGD,
17. MacDonald, James A. “Mergers and Competition in Seed and
RetailAnalysis, 28 March 2016. https://retailanalysis.igd.com/news/
Agricultural Chemical Markets.” United States Department of
news-article/t/why-walmarts-getting-vertically-integrated/i/11036.
Agriculture, Economic Research Service, 3 April 2017. https://www.ers.
usda.gov/amber-waves/2017/april/mergers-and-competition-in-seed-
and-agricultural-chemical-markets/. 35. “ Industries at a Glance: Food Manufacturing.” Bureau of Labor
Statistics, United States Department of Labor. https://www.bls.gov/iag/
tgs/iag311.htm.
18. “ Crop Values: 2017 Summary.” United States Department of
Agriculture, National Agricultural Statistics Service, February
2018. http://usda.mannlib.cornell.edu/usda/current/CropValuSu/
CropValuSu-02-23-2018.pdf.36. Wells, Jeff. “Growing pains: Why supermarkets are struggling to source 47. CoStar. Accessed 15 November 2018. http://product.costar.com/home/.
local products.” Food Dive, 6 April 2017. https://www.fooddive.com/
news/grocery--grocery-source-local-vegetables-fruit-produce/440670/.
48. “The Grocery Distribution Network in North America.” MWPVL
International, Inc. http://www.mwpvl.com/html/grocery_distribution_
37. Jeff, W. Ibid. Page 5. network.html.
38. “ Say cheese: Journey from farm to fridge.” Casale, Lucy M. The 49. “Are Grocery Retailers Increasingly Outsourcing Distribution
Boston Globe, 8 August 2017. BostonGlobe.com, http://sponsored. Operations to 3PLs?” MWPVL International, Inc. http://www.mwpvl.
bostonglobe.com/vermont-tourism/say-cheese/. com/html/retail_3pl_outsourcing.html.
39. T
erry, Lisa. “Perishable Logistics: Cold Chain on a Plane.” Inbound 50. MWPVL International. Ibid.
Logistics, 20 January 2014. https://www.inboundlogistics.com/cms/
article/perishable-logistics-cold-chain-on-a-plane/.
51. “ C&S Locations, Northeast/Mid-Atlantic.” C&S Wholesale Grocers.
http://www.cswg.com/locations-northeastmid-atlantic.
40. S
prouts Farmers Market. Form 10-K, United States Securities and
Exchange Commission, 31 December 2017. http://investors.sprouts.
52. “ Our Locations.” Sysco. https://www.sysco.com/Contact/Contact/Our-
com/Cache/392296783.pdf.
Locations.html.
41. Sprouts Farmers Market. Ibid.
53. “ Wholesaling.” United States Department of Agriculture, Economic
Research Service, 10 October 2017. https://www.ers.usda.gov/topics/
42. “Fresh Foods and Flavors: How Multicultural Consumers are Driving food-markets-prices/retailing-wholesaling/wholesaling/
Fresh Grocery Trends.” Nielson.com, 4 November 2016. http://www.
nielsen.com/us/en/insights/news/2016/fresh-foods-and-flavors-how-
54. U.S.D.A. Ibid.
multicultural-consumers-are-driving-fresh-grocery-trends.html.
55. D
astin, Jeffrey. “Even with Whole Foods, Amazon would need many
43. “History: Our Story.” Goya Foods. https://www.goya.com/en/our-
more warehouses to reshape grocery delivery.” Reuters, 23 June 2017.
company/history.
https://www.reuters.com/article/us-whole-foods-m-a-amazon-com-
logistics/even-with-whole-foods-amazon-would-need-many-more-
44. “Diaz Foods opens state-of-the-art distribution center in Virginia.” The warehouses-to-reshape-grocery-delivery-idUSKBN19E2OK.
Produce News, 6 April 2015. http://www.theproducenews.com/9-news-
section/story-cat/15532-diaz-foods-opens-state-of-the-art-distribution-
56. “ 2018 Directory of Supermarket, Grocery & Convenience Store
center-in-virginia.
Chains.” Chain Store Guide, 2018. http://www.chainstoreguide.com/
csgonline/industryinformation/supermarket.pdf.
45. “Diaz Foods and Ryder.” Ryder System Inc, Case Study, 2015. https://
ryder.com/-/media/ryder/ryder-global/expertise/case-study_diaz-foods.
57. “ Median Store Size: Square Feet.” Food Marketing Institute. https://
pdf.
www.fmi.org/our-research/supermarket-facts/median-total-store-size-
square-feet.
46. “Infrastructure of Retail Food Distribution Network Within North
America.” Wholesale Grocer’s Directory, 18 February 2017. https://
wholesalegrocersdirectory.com/infrastructure-retail-food-distribution-
network-within-north-america/.You can also read