Forecast Accuracy Report - Review of the 2019 Demand, Supply and Reliability Forecasts - Australian Energy Market Operator
←
→
Page content transcription
If your browser does not render page correctly, please read the page content below
Forecast Accuracy Report

 December 2020

Review of the 2019 Demand, Supply and
 Reliability Forecasts
Important notice
PURPOSE
This Forecast Accuracy Report has been prepared consistent with AEMO’s Interim Reliability Forecast
guidelines and the AEMO Forecast Accuracy Reporting Methodology for forecast improvements and
accuracy. It is for the purposes of clause 3.13.3A(h) of the National Electricity Rules. It reports on the accuracy
of demand and supply forecasts in the 2019 Electricity Statement of Opportunities (ESOO) and its
predecessors for the National Electricity Market (NEM).
This publication has been prepared by AEMO using information available at 31 August 2020.

DISCLAIMER
This document or the information in it may be subsequently updated or amended. This document does not
constitute legal or business advice and should not be relied on as a substitute for obtaining detailed advice
about the National Electricity Law, the National Electricity Rules, or any other applicable laws, procedures or
policies. AEMO has made every effort to ensure the quality of the information in this document but cannot
guarantee its accuracy or completeness.
Accordingly, to the maximum extent permitted by law, AEMO and its officers, employees and consultants
involved in the preparation of this document:
• make no representation or warranty, express or implied, as to the currency, accuracy, reliability or
 completeness of the information in this document; and
• are not liable (whether by reason of negligence or otherwise) for any statements or representations in this
 document, or any omissions from it, or for any use or reliance on the information in it.

VERSION CONTROL
 Version Release date Changes

 1 2 December 2020

© 2020 Australian Energy Market Operator Limited.
The material in this publication may be used in accordance with the copyright permissions on AEMO’s website.

Executive summary
Each year, AEMO publishes an assessment of forecast accuracy to help inform its Forecast Improvement Plan
and build confidence in the forecasts produced. This 2020 Forecast Accuracy Report primarily assesses the
accuracy of AEMO’s 2019 Electricity Statement of Opportunities (ESOO) 1 for each region in the National
Electricity Market (NEM). The report assesses the accuracy of forecast drivers and models of demand and
supply that influence the reliability assessments for the 2019-20 financial year, in particular the summer.
Table 1 summarises the assessment of forecasting accuracy discussed within. Given the varying nature of each
component and forecast, quantitative metrics are not always feasible. This qualitative summary should be
read considering the following:
 Forecast has performed as expected.

 Inaccuracy observed in forecast is explainable by inputs and assumptions. These inputs should be monitored and incrementally
 improved, provided the value is commensurate with cost.

 Inaccuracy observed in forecast needs attention and should be prioritised for improvement.

Table 1 Forecast accuracy summary by region, 2019-20

 Forecast
 NSW QLD SA TAS VIC Comments
 Component
 Installed PV capacity significantly above forecast in most regions.
 Drivers of demand
 A new methodology has already been developed and used in the
 2020 ESOO to better capture recent PV sales history in forecasts.
 South Australian consumption more than 3% lower than forecast,
 Energy consumption
 though at least half of the deviation from forecast is explained by
 input drivers. Tasmania also lower than forecast driven by lower
 large industrial loads (LIL).
 All mainland regions sit well within distributions and are
 Summer maximum
 demand consistent with forecast drivers. Tasmania is at the very low end
 of the distribution, driven by lower LIL than forecast.
 Winter maximum demand in South Australia is above forecast
 Winter maximum
 demand distribution. Likely due to change in consumption behaviour due
 to COVID. Tasmania lower than forecast driven by LIL.
 Due to under-forecast PV capacity, actual minimum demand in
 Annual minimum
 demand Queensland and South Australia fell below forecast distribution.
 Tasmania was low as well, but driven by LIL rather than PV.
 New South Wales and Victoria had responses from loads that had
 Demand Side
 Participation not been considered in the forecast, underestimating the DSP
 response in New South Wales in particular, less so in Victoria.
 New generator installations matched expectation, except in
 Installed generation
 capacity Victoria where delays impacted availability compared with what
 was modelled.
 Planned and unplanned outages in Queensland reduced
 Summer supply
 availability availability against forecast, which was accommodated due to the
 total volume of dispatchable capacity available in the region.

The report highlights the impact that distributed photovoltaics (PV) can have on consumption, maximum and
in particular minimum demand, and the resulting need for AEMO to have more visibility of the most recent
PV uptake trends. The newly developed distributed energy resources (DER) register data will be a key enabler

1
 At https://aemo.com.au/energy-systems/electricity/national-electricity-market-nem/nem-forecasting-and-planning/forecasting-and-reliability/nem-
 electricity-statement-of-opportunities/2019-nem-electricity-statement-of-opportunities.

© AEMO 2020 | Forecast Accuracy Report 3
for this. The report also identifies the need for further analysis to better understand the observed variances of
consumption and demand by customer segment. On the supply side, the forecasts generally performed well
with only minor improvements identified.
The accuracy of the forecasts is critical to ensure informed decision making by AEMO – for the Retailer
Reliability Obligation (RRO), Reliability and Emergency Reserve Trader (RERT), and Integrated System Plan
(ISP) – and by industry and governments.
While most forecast models have performed well, some of the inputs and assumptions have impacted
forecast accuracy. These can be summarised below:
• Rooftop PV and PV non-scheduled generation (PVNSG) actuals were above the 2019-20 forecast in all
 regions, totalling 1,807 MW more capacity installed than forecast across the NEM. This resulted in actual
 operational consumption and, in particular, minimum demand being lower than forecast in most regions.
• Actual economic activity was not well aligned with forecast, due to the impacts of domestic and
 international measures to minimise the spread of COVID-19 from late March 2020 onwards, which
 significantly reduced economic activity. While some business electricity consumption was reduced as a
 consequence, residential consumption increased, and the net impact for the last quarter of the financial
 year was relatively minor.
• DSP actuals aligned well with the forecast in most regions but, in both New South Wales and Victoria, DSP
 responses were seen from loads that had not been considered in the forecast, underestimating the DSP
 response for New South Wales in particular. These newly observed responses from select loads have been
 considered for the 2020 ESOO forecast, following consultation on DSP methodology in the first half
 of 2020.
• New generation installations were aligned with the forecast for most regions, however Victoria observed
 commissioning delays against provided timing. For summer 2019-20, there was 1,241 MW less installed
 capacity than expected in Victoria. These delays had the potential to impact reliability, however, were
 accommodated due to high availability from brown coal-fired generators during hot periods.
• Generator forced outage rates for coal-fired generators continued to worsen but were mostly aligned with
 assumptions, except for New South Wales black coal-fired generators, which performed worse than
 expected. An updated methodology used in the 2020 ESOO now uses participant and consultant forecasts
 of forced outage rates to better capture trends in performance and maintenance.
• Outage rates on inter-regional transmission elements were higher than assumed, primarily due to bushfire
 impacts on Victoria to New South Wales transmission elements, and destructive wind gusts and asset
 failure impacts on Victoria to South Australian transmission elements.

Improvement plan
Some of the observed differences between actuals and forecasts have affirmed changes already made to the
forecast methodology for the 2020 ESOO, guided by observations in the 2019 Forecast Accuracy Report. The
appendix to this report provides an update on these changes.
Other differences have helped steer the direction for additional improvements to be implemented for the
2021 forecasts to improve forecast accuracy in the first five years of the reliability forecast relied upon for the
RRO, and for use in the 2022 ISP. The priority improvements proposed for 2021 are listed below.

Improved PV forecasts
Rooftop PV and PVNSG continues to be installed at a rapid rate, and discrepancies between forecast and
actual uptake remains a material driver of consumption and demand forecast inaccuracy, in particular
affecting AEMO’s minimum demand forecasts.
For its 2020 forecasts, AEMO acquired expert PV uptake forecasts from multiple consultants, yet short-term
trends in installations and output are still problematic. AEMO intends to work on improving the visibility of
recent uptake. Focus is to get better estimates of actual number of installations and changes to the rate of

© AEMO 2020 | Forecast Accuracy Report 4
uptake, for example through the use of DER register data, and to ensure recent trends are reflected in the
forecasts.
AEMO will also review the daily and seasonal profile of PV generation associated with a given level of installed
PV capacity, to ensure the contribution at time of maximum and minimum demand is calibrated to observed
outcomes.

Improved visibility and understanding of consumption patterns and trends
Consumption patterns change over time as consumers change the way they use energy in response to factors
like COVID-19, or adoption of technologies like PV, battery storage and electric vehicles.
To improve understanding of consumption and demand drivers and trends, AEMO plans to focus on using
smart meter data to estimate the split between business and residential consumption, and compare
consumption trends for customers with and without PV systems. This will help verify and potentially improve
existing models for residential and business consumption, and provide a tool for better understanding the
reasons behind observed forecast variance and better guide future forecasting improvement initiatives.
In addition, variability of consumption by large industrial loads during minimum demand periods will be
reviewed to ensure it is appropriately reflected in the minimum demand forecasts.

Better visibility of forecast maximum demand within a year
The report shows comparisons of observed monthly maximum demand and the maximum demand of the
traces used in the ESOO and Medium Term Projected Assessment of System Adequacy (MT PASA) modelling.
There are some misalignments as the traces are not made to match forecast maximum demand outside
summer and winter months. To give stakeholders visibility of the forecast range of maximum demand in
shoulder months, AEMO will improve how it calculates and publishes more granular forecast data, in
particular the forecasts published as part of the MT PASA process.

Wind generation trace development
Analysis of availability of renewable generation sources showed examples of reduced wind farm output
during high temperatures over the summer, which resulted in an unexpected reduction in supply availability.
As result of climate change2 this may happen more frequently in the future. As installed wind capacity
increases across the NEM, capturing the relationship between modelled wind generation and high
temperatures is becoming more important.
AEMO intends to develop and implement a new wind generation model that will produce more realistic
traces in the presence of high temperatures or wind speeds for the 2021 forecasts.

Improved modelling of inter-regional transmission elements forced outages
AEMO’s current process for calculating forced outage rates on inter-regional transmission elements uses
available outage history only. This does not capture the potential correlation between high demand and
network outage risks, as both are highly driven by weather. Weather conducive for bushfires and high wind
gust events is identifiable in the historical weather traces used in forecasts, and AEMO will use this to develop
network forced outage simulations that better reflect the compound risk associated with the potential
coincidence with high demand events.

Invitation for written submissions
Stakeholders are invited to submit written feedback on any issues related to the improvement plan outlined
in this report. Submissions are requested by 5.00 pm (AEDT) Friday, 15 January 2021. Submissions should be
sent by email to energy.forecasting@aemo.com.au.

2
 See for instance https://www.climatechangeinaustralia.gov.au/en/.

© AEMO 2020 | Forecast Accuracy Report 5
Contents
Executive summary 3

1. Stakeholder consultation process 11

2. Introduction 12
2.1 Definitions 12
2.2 Forecast components 13
2.3 Scenarios and uncertainty 14

3. Trends in demand drivers 16
3.1 Macroeconomic growth 16
3.2 Connections growth 17
3.3 Rooftop PV and PV non-scheduled generation 17
3.4 Auxiliary loads 20
3.5 Network losses 20

4. Operational energy consumption forecasts 22
4.1 New South Wales 24
4.2 Queensland 25
4.3 South Australia 26
4.4 Tasmania 27
4.5 Victoria 28

5. Extreme demand forecasts 30
5.1 Extreme demand events in 2019-20 30
5.2 New South Wales 33
5.3 Queensland 37
5.4 South Australia 41
5.5 Tasmania 45
5.6 Victoria 49

6. Supply forecasts 54
6.1 New South Wales 56
6.2 Queensland 59
6.3 South Australia 63
6.4 Tasmania 65
6.5 Victoria 67
6.6 Inter-regional transmission elements 70
6.7 Demand Side Participation 72

7. Reliability forecasts 77

© AEMO 2020 | Forecast Accuracy Report 6
7.1 New South Wales 77
7.2 Queensland 78
7.3 South Australia 78
7.4 Tasmania 79
7.5 Victoria 79

8. Improvement plan 80
8.1 2019 forecasts – summary of findings 81
8.2 Forecast improvement priorities for 2021 81

A1. Status of 2020 ESOO improvements 86

Measures and abbreviations 88

Tables
Table 1 Forecast accuracy summary by region, 2019-20 3
Table 2 Consultation timeline 11
Table 3 Key scenarios drivers used in the 2019 ESOO 15
Table 4 Connections forecast for 2019-20 and actuals for 2019-20 17
Table 5 Rooftop PV and PVNSG installed capacity comparison by region, as at 30 June 2020 (MW) 19
Table 6 Estimated network loss factors 21
Table 7 Recent one-year ahead operational sent-out energy consumption forecast accuracy by
 region 23
Table 8 NEM operational energy consumption forecast accuracy by component 23
Table 9 New South Wales operational energy consumption forecast accuracy by component 25
Table 10 Queensland operational energy consumption forecast accuracy by component 26
Table 11 South Australia operational energy consumption forecast accuracy by component 27
Table 12 Tasmania operational energy consumption forecast accuracy by component 28
Table 13 Victoria operational energy consumption forecast accuracy by component 29
Table 14 Summer 2019-20 maximum demand with adjustments per region (MW) 31
Table 15 Winter 2020 maximum demand with adjustments per region (MW) 32
Table 16 Annual minimum demand with adjustments per region (MW) 32
Table 17 New South Wales 2020 extreme demand events 34
Table 18 Queensland 2020 extreme demand events 38
Table 19 South Australia 2020 extreme demand events 42
Table 20 Tasmania 2020 extreme demand events 46

© AEMO 2020 | Forecast Accuracy Report 7
Table 21 Victoria 2020 extreme demand events 50
Table 22 Forecast and actual generation count and capacity, February 2020 56
Table 23 Forecast and actual generation count and capacity, February 2020 60
Table 24 Forecast and actual generation count and capacity, February 2020 63
Table 25 Forecast and actual generation count and capacity, February 2020 66
Table 26 Forecast and actual generation count and capacity, February 2020 68
Table 27 Forecast reliability response in MW during LOR2 or LOR3 during 2019-20 summer 75
Table 28 Proposed improvements relevant to the 2020 ESOO 86

Figures
Figure 1 Demand definitions used in this document 13
Figure 2 Seasonal definitions used in this document 13
Figure 3 Forecasting components 14
Figure 4 Macroeconomic growth rates, chain volume measures, seasonally adjusted 17
Figure 5 NEM rooftop PV installed capacity comparison, 2017-21 18
Figure 6 NEM PVNSG installed capacity comparison, 2017-21 19
Figure 7 Recent annual energy consumption forecasts by region 22
Figure 8 NEM operational energy consumption variance by component 24
Figure 9 New South Wales operational energy consumption variance by component 25
Figure 10 Queensland operational energy consumption variance by component 26
Figure 11 South Australia operational energy consumption variance by component 27
Figure 12 Tasmania operational energy consumption variance by component 28
Figure 13 Victoria operational energy consumption variance by component 29
Figure 14 New South Wales demand with extreme events identified 33
Figure 15 New South Wales simulated extreme event probability distributions with actuals 33
Figure 16 New South Wales simulated extreme event probability distributions with actuals 35
Figure 17 New South Wales monthly maximum demand in demand traces compared with actuals 37
Figure 18 Queensland demand with extreme events identified 37
Figure 19 Queensland simulated extreme event probability distributions with actuals 38
Figure 20 Queensland simulated input variable probability distributions with actuals 39
Figure 21 Queensland monthly maximum demand in demand traces compared with actuals 41
Figure 22 South Australia demand with extreme events identified 41
Figure 23 South Australia simulated extreme event probability distributions with actuals 42
Figure 24 South Australia simulated input variable probability distributions with actuals 44

© AEMO 2020 | Forecast Accuracy Report 8
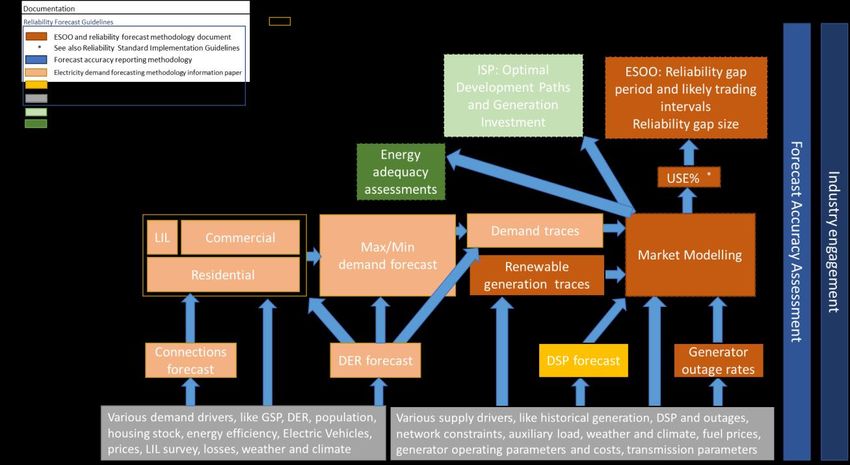
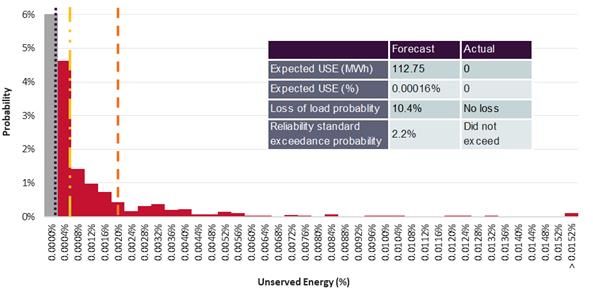
Figure 25 South Australia monthly maximum demand in demand traces compared with actuals 45
Figure 26 Tasmania demand with extreme events identified 45
Figure 27 Tasmania simulated extreme event probability distributions with actuals 46
Figure 28 Tasmania simulated input variable probability distributions with actuals 48
Figure 29 Tasmania monthly maximum demand in demand traces compared with actuals 49
Figure 30 Victoria demand with extreme events identified 49
Figure 31 Victoria simulated extreme event probability distributions with actuals 50
Figure 32 Victoria simulated input variable probability distributions with actuals 52
Figure 33 Victoria monthly maximum demand in demand traces compared with actuals 53
Figure 34 NEM generation mix by energy, including demand side components, 2018-19 and 2019-20 54
Figure 35 Example simulated and actual supply availability (South Australian gas and liquid
 generators) 55
Figure 36 New South Wales supply availability for the top 10 hottest days 57
Figure 37 New South Wales black coal effective unplanned outage rates, including HILP outages 57
Figure 38 New South Wales black coal supply availability for the top 10 hottest days 58
Figure 39 New South Wales hydrogeneration supply availability for the top 10 hottest days 58
Figure 40 New South Wales gas and liquid supply availability for the top 10 hottest days 59
Figure 41 New South Wales variable renewable energy supply availability for the top 10 hottest days 59
Figure 42 Queensland supply availability for the top 10 hottest days 60
Figure 43 Queensland black coal effective unplanned outage rates, including HILP outages 61
Figure 44 Queensland black coal supply availability for the top 10 hottest days 61
Figure 45 Queensland black coal supply availability for the New South Wales top 10 hottest days 62
Figure 46 Queensland gas and liquids supply availability for the top 10 hottest days 62
Figure 47 Queensland variable renewable energy supply availability for the top 10 hottest days 63
Figure 48 South Australia supply availability for the top 10 hottest days 64
Figure 49 South Australia gas and liquids supply availability for the top 10 hottest days 64
Figure 50 South Australia variable renewable energy supply availability for the top 10 hottest days 65
Figure 51 Scatter plot of daily maximum temperature over 35°C and wind speeds for South Australia 65
Figure 52 Tasmania supply availability for the top 10 hottest days 66
Figure 53 Tasmania hydrogeneration supply availability for the top 10 hottest days 67
Figure 54 Tasmania variable renewable energy supply availability for the top 10 hottest days 67
Figure 55 Victoria supply availability for the top 10 hottest days 68
Figure 56 Victorian brown coal effective unplanned outage rates, forecasts including HILP outages 69
Figure 57 Victoria brown coal supply availability for the top 10 hottest days 69
Figure 58 Victoria variable renewable energy supply availability for the top 10 hottest days 70
Figure 59 Victoria aggregate wind generation output on a high temperature day 70

© AEMO 2020 | Forecast Accuracy Report 9
Figure 60 Victoria – New South Wales transmission forced outage rates 71
Figure 61 Victoria – South Australia transmission forced outage rates 71
Figure 62 Tasmania – Victoria interconnector (Basslink) forced outage rates 72
Figure 63 Evaluation of actual compared to forecast price-driven DSP in New South Wales 74
Figure 64 Evaluation of actual compared to forecast price-driven DSP in Queensland 74
Figure 65 Evaluation of actual compared to forecast price-driven DSP in South Australia 74
Figure 66 Evaluation of actual compared to forecast price-driven DSP in Tasmania 75
Figure 67 Evaluation of actual compared to forecast price-driven DSP in Victoria 75
Figure 68 New South Wales USE forecast distribution for 2019-20 summer 77
Figure 69 Queensland USE forecast distribution for 2019-20 summer 78
Figure 70 South Australia USE forecast distribution for 2019-20 summer 78
Figure 71 Tasmania USE forecast distribution for 2019-20 summer 79
Figure 72 Victoria USE forecast distribution for 2019-20 summer 79
Figure 73 Current wind generation model with scatter plot of wind speed and temperature 84
Figure 74 Prototype wind generation model on high temperature day 84
Figure 75 Prototype daily transmission bushfire impact model output for Victoria – New South Wales
 inter-regional transmission elements 85

© AEMO 2020 | Forecast Accuracy Report 10
1. Stakeholder
 consultation process
The publication of this Forecast Accuracy Report (FAR) marks the commencement of AEMO’s Forecast
Improvement Plan consultation.
Section 8 of this report, the Forecast Improvement Plan, has been guided by the assessment of the main
contributors to forecast inaccuracies. The process underlying the forecast accuracy assessment in this report
was consulted on from April to October 2020 in the Forecast Accuracy Reporting Methodology consultation 3.
This consultation focuses on the initiatives outlined in the Forecast Improvement Plan only, and not the FAR
methodology.
The finalised Forecast Improvement Plan is to the extent possible to be implemented prior to AEMO
developing reliability forecasts to be published in the 2021 ESOO.

AEMO is seeking feedback on the Forecast Improvement Plan, in particular:
• Is the Forecast Improvement Plan outlined in Section 8 of this report reasonable, and does it focus
 on the areas that will deliver the greatest improvements to forecast accuracy?
• If not, what alternative or additional improvements should be considered for 2021 ESOO or beyond?
AEMO values stakeholder feedback on the above questions in the form of written submissions, which should
be sent by email to energy.forecasting@aemo.com.au no later than 5.00 pm (AEDT) Friday, 15 January
2020.
The table below outlines AEMO’s consultation on the improvement plan. The consultation will follow the
single-stage process outlined in Appendix B of the Forecasting Best Practice Guidelines4 published by the
Australian Energy Regulator (AER).

Table 2 Consultation timeline

 Consultation steps Indicative dates

 Forecasting Reference Group discussion of draft report 28 October 2020

 Forecast Accuracy Report and Improvement plan published 2 December 2020

 Submissions due on Improvement plan 15 January 2021

 Final methodology improvements updated and published in existing 12 February 2021
 methodology documents along with a Submission Response document

3
 At https://aemo.com.au/en/consultations/current-and-closed-consultations/forecast-accuracy-report-methodology.
4
 At https://www.aer.gov.au/system/files/AER%20-%20Forecasting%20best%20practice%20guidelines%20-%2025%20August%202020.pdf.

© AEMO 2020 | Forecast Accuracy Report 11
2. Introduction
In accordance with National Electricity Rules (NER) clause 3.13.3A(h), AEMO must, no less than annually,
prepare and publish on its website information related to the accuracy of its demand and supply forecasts,
and any other inputs determined to be material to its reliability forecasts. Additionally, AEMO must publish
information on improvements that will apply to the next Electricity Statement of Opportunities (ESOO) for the
National Electricity Market (NEM). The objective of this transparency is to build confidence in the forecasts
produced
To meet this requirement, AEMO has prepared this forecast accuracy report for a broad set of demand,
supply, and reliability forecast components.
Specifically, this 2020 Forecast Accuracy Report assesses the accuracy of the 2019-20 demand and supply
forecasts published in AEMO’s 2019 NEM ESOO5 and related products, in addition to the resulting reliability
forecasts for each region in the NEM. The 2019 ESOO forecasts are the latest that can be assessed against a
full year of subsequent actual observations.
The introduction of the reliability forecast under the Retailer Reliability Obligation (RRO) rules in 2019
increased the importance of the forecast accuracy. To assess if the methodologies applied were fit for
purpose, AEMO commissioned an external review of its forecast accuracy assessment methodology
undertaken by University of Adelaide6. Recommendations arising from the review were adopted by AEMO
where practicable to increase the depth and breadth of its forecast accuracy reporting, and has formed the
basis of AEMO’s forecast accuracy reporting methodology, which AEMO consulted on in the first half of
20207.

2.1 Definitions
Any assessment of accuracy is reliant on precise definitions of technical terms to ensure forecasts are
evaluated on the same basis they were created. To support this:
• All forecasts are reported on a “sent out” basis unless otherwise noted.
• All times mentioned are NEM time – Australian Eastern Standard Time (UTC+10) – not local times, unless
 otherwise noted.
• Historical operational demand “as generated” (OPGEN) is converted to “sent-out” (OPSO) based on
 estimates of auxiliary load, which reflects load used within the generator site.
• Auxiliaries are typically excluded from demand forecasts as they relate to the scheduling of generation
 and do not correlate well with underlying customer demand.
• Terms used in this report are defined in the glossary.
Figure 1 shows the demand definitions used in this document.

5
 At https://aemo.com.au/energy-systems/electricity/national-electricity-market-nem/nem-forecasting-and-planning/forecasting-and-reliability/nem-
 electricity-statement-of-opportunities/2019-nem-electricity-statement-of-opportunities.
6
 At https://www.aemo.com.au/-/media/files/electricity/nem/planning_and_forecasting/accuracy-report/forecastmetricsassessment_uoa-aemo.pdf.
7
 At https://aemo.com.au/-/media/files/stakeholder_consultation/consultations/nem-consultations/2020/forecast-accuracy-report-methodology/forecast-
 accuracy-reporting-methodology-report-aug-20.pdf.

© AEMO 2020 | Forecast Accuracy Report 12
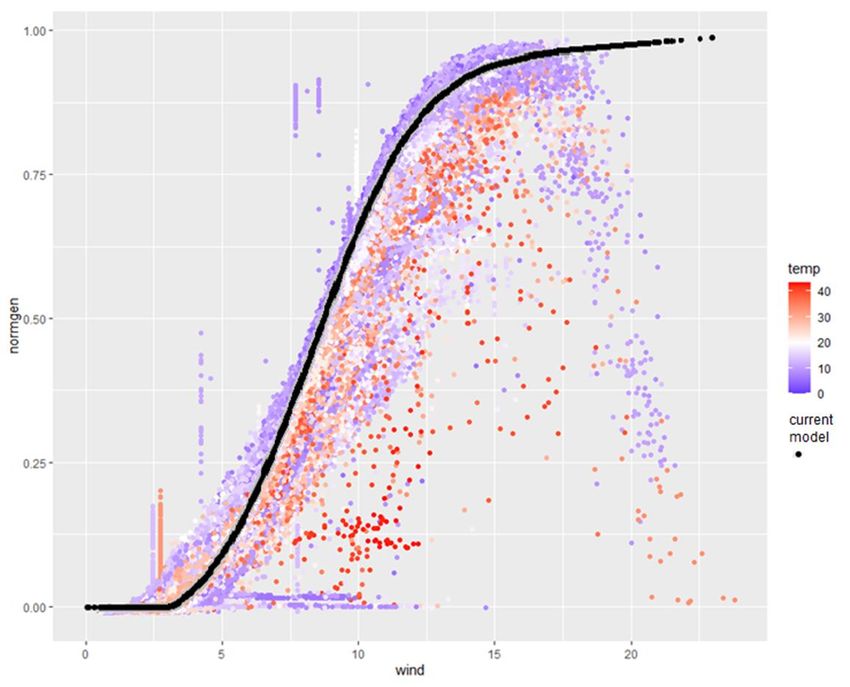
Figure 1 Demand definitions used in this document

* Including VPP from aggregated behind-the-meter battery storage
** For definition, see: https://www.aemo.com.au/-
/media/Files/Electricity/NEM/Security_and_Reliability/Dispatch/Policy_and_Process/Demand-terms-in-EMMS-Data-Model.pdf

For consistency, data and methodologies of actuals are the same as those used for the corresponding
forecasts in the 2019 ESOO. This means:
• An energy consumption year is aligned with the financial year, being July to June inclusive.
• As Figure 2 shows:
 – A year for the purposes of annual minimum demand is defined as September to August inclusive.
 – Summer is defined as November to March for all regions, except Tasmania, where summer is defined
 as December to February inclusive.
 – Winter is defined as June to August inclusive for all regions.

Figure 2 Seasonal definitions used in this document

2.2 Forecast components
Production of AEMO’s high level outputs requires multiple sub-forecasts to be produced and appropriately
integrated, and these are referred to as forecast components. The figure below shows the forecast
components leading to AEMO’s reliability forecast and the methodology documents (see colour legend)
explaining these processes in more detail8.

8
 These documents are available at https://aemo.com.au/en/energy-systems/electricity/national-electricity-market-nem/nem-forecasting-and-
 planning/scenarios-inputs-assumptions-methodologies-and-guidelines.

© AEMO 2020 | Forecast Accuracy Report 13
In this figure, inputs can be seen as data streams (including forecasts provided by consultants) used directly in
AEMO’s forecasting process. In some cases, AEMO processes such information, for example Distributed
Energy Resources (DER), where AEMO combines inputs from multiple consultants into its forecast uptake of
rooftop photovoltaics (PV), electric vehicles (EVs), and battery storage.

Figure 3 Forecasting components

2.2.1 Assessability of forecast accuracy
Forecasting is the estimation of the future values of a variable of interest. However, just because a variable of
interest can be forecast, it does not mean that it can be rigorously assessed. There are three broad categories
of forecasts:
1. Strongly assessable – exact and indisputable actual values for the variable of interest exist at the time of
 forecast performance assessment. This allows definitive comparison with forecasts produced earlier.
2. Moderately assessable – reasonable estimates for the actual variable of interest are available at the time of
 forecast performance assessment. The reader of forecast performance should be aware that the forecast
 performances quoted are estimates.
3. Weakly assessable – there are no acceptable actual values of the variable of interest at the time of forecast
 performance assessment. It is inappropriate to produce any forecast accuracy metrics for this category.
AEMO focuses the forecast accuracy assessment on strongly and moderately assessable forecast
components.
As AEMO gains access to increasing proportions of smart meter data, some of the weakly assessable
forecasts will increasingly become moderately assessable. This includes the split of the consumption forecast
into residential and business consumption and potentially better insight into the impacts of energy efficiency
schemes. AEMO’s Forecast Improvement Plan includes initiatives that seek to increase the assessability of
forecast components.

2.3 Scenarios and uncertainty
There are two types of uncertainties in AEMO’s forecasts:

© AEMO 2020 | Forecast Accuracy Report 14
• Structural drivers, which are modelled as scenarios, including considerations such as population and
 economic growth and uptake of future technologies, such as rooftop PV, batteries and EVs.
• Random drivers, which are modelled as a probability distribution and include weather drivers and
 generator outages.
For the random drivers, a probability distribution of their outcomes can be estimated, and the accuracy of this
assessed, as it is the case in for the extreme demand forecasts (see Section 5) and generator availability
(Section 6).
For the structural drivers, such probability distributions cannot be established, and instead the uncertainty is
captured using different scenarios. The scenarios used for the 2019 ESOO are summarised in Table 3.

Table 3 Key scenarios drivers used in the 2019 ESOO

 Consultation steps Slow Change scenario Central scenario Step Change scenario

 Economic growth and Low Moderate High
 population outlook

 Energy efficiency Low Moderate High
 improvements

 Demand Side Low Moderate High
 Participation

 Distributed PV uptake Low Moderate High
 (rooftop plus PVNSG)

 Battery storage Low Moderate High
 uptake

 EV uptake Low Moderate High

© AEMO 2020 | Forecast Accuracy Report 15
3. Trends in demand
 drivers
Electricity forecasts are predicated on a wide selection of inputs, drivers, and assumptions. Input drivers to the
demand models include:
• Macroeconomic growth.
• Electricity connections growth.
• Distributed PV and behind-the-meter battery uptake.
• Energy efficiency and appliance mix.
• EVs.
The 2019 NEM ESOO detailed the changing social, economic, and political environment in which the NEM
operates. As this environment evolves, the needs of the market and system will also evolve. As discussed in
Section 2.3, three scenarios were therefore developed to illustrate a range of possible pathways: Slow
Change, Central, and Step Change.
Not all input variables are measured regularly, or have material impacts on year ahead outcomes. For
example, distributed PV installations are measurable and have an impact on year ahead outcomes, while EV
forecast accuracy is not currently measurable and does not currently have a material impact on year ahead
forecasts. Input drivers that are suitable for accuracy assessment and comment are discussed in this section.

3.1 Macroeconomic growth
There are various macroeconomic indicators that form the basis of the scenario forecasts. The 2019 NEM
ESOO Central scenario incorporated consultant forecasts between 2.6% and 4.0% p.a. average real growth in
Gross Domestic Product (GDP) for the first five years of the forecast and 3.2% specifically for 2019-20. Instead,
actual growth in GDP in 2019-20 fell 6.3%, the sum of the four quarters to June 2020 as shown in Figure 49.
All things being equal, slower economic growth would lead to lower electricity demand than forecast.
However, the specific sector in which the economic activity slows can affect the energy consumption
significantly. In March 2020 the response by both federal and state governments during the unfolding
COVID-19 pandemic has impacted electricity consumption, though not uniformly. Social distancing measures
and restrictions in trading have resulted in declines in business activity of many small to medium enterprises
(resulting in lower GDP) and subsequently lower energy consumption. At the same time, stay-at-home orders
resulted in an increase in residential consumption.
The impact on consumption in 2019-20 has been modest with industrial load broadly flat, and the downturn
in commercial electricity consumption almost offset by residential load increases 10. This is reflected in
Section 4, where forecast and actual consumption matches reasonably well in most regions.

9
 Source: Australian Bureau of Statistics. Australian National Accounts: National Income, Expenditure, and Product, Jun 2020, available at
 https://www.abs.gov.au/statistics/economy/national-accounts/australian-national-accounts-national-income-expenditure-and-product/latest-release .
 Accessed 21 September 2020.
10
 Quarterly Energy Dynamics Q2 2020, Jul 2020, available at: https://aemo.com.au/-/media/files/major-publications/qed/2020/qed-q2-2020.pdf

© AEMO 2020 | Forecast Accuracy Report 16
Figure 4 Macroeconomic growth rates, chain volume measures, seasonally adjusted

 2

 1

 0
 Jun-12

 Jun-15

 Jun-18
 Jun-13

 Jun-14

 Jun-16

 Jun-17

 Jun-19

 Jun-20
 Dec-12

 Dec-13

 Dec-14

 Dec-15

 Dec-16

 Dec-17

 Dec-18

 Dec-19
 GDP quarterly growth (%)

 -1

 -2

 -3

 -4

 -5

 -6

 -7

 -8

3.2 Connections growth
New electricity connections is a key growth driver for electricity consumption in the residential sector. The
forecasts are based on population and household growth forecasts from the Australian Bureau of Statistics
(ABS). As the ABS only updates reported growth in new dwellings every census every five years, the
short-term trend of National Metering Identifier (NMI) growth from the AEMO database is used for the
short-term forecasts for preparation of the 2019 ESOO forecast.

Table 4 Connections forecast for 2019-20 and actuals for 2019-20

 Region Actual for 2019-20 (#) 2019 forecast for 2019-20 (#) Difference* (%)

 New South Wales 3,475,443 3,464,314 -0.3%

 Queensland 2,009,359 2,015,430 0.3%

 South Australia 788,563 785,671 -0.4%

 Tasmania 251,238 250,366 -0.3%

 Victoria 2,646,207 2,633,118 -0.5%

 NEM 9,170,810 9,148,899 -0.2%

* negative number reflects an under-forecast of actuals, positive numbers an over-forecast

In general, the actual number of connections aligned well with the forecast, and the contribution to the
overall NEM consumption forecast variance is minimal (see Figure 8 in Section 4).

3.3 Rooftop PV and PV non-scheduled generation
To define actual rooftop PV installed capacity in the 2019 ESOO, AEMO received installation data from the
Clean Energy Regulator (CER), and adjusted it to reflect system replacements. However, rooftop PV actuals
are not known precisely at any point in time and are subject to revision because PV installers have up to one
year to submit applications for Small-scale Technology Certificates (STCs) to the CER.

© AEMO 2020 | Forecast Accuracy Report 17
The 2019 ESOO Central scenario forecast provided by CSIRO11 assumed short term growth in installations
similar to the trajectory of actual growth as it appeared at the time.
Figure 5 compares the rooftop PV forecast for the 2019 ESOO scenarios (see Table 3 for definition) with the
estimated actuals at the time the 2019 PV forecast was finalised in May 2019, and current revised actuals for
the same period (as of 19 September 2020). As seen, the current revision (dashed line) is higher in mid-2019
than the estimated actuals were (red line) at the time the 2019 PV forecast was finalised. The figure highlights
the inaccurate estimate of existing capacity of all three scenarios (June 2019) caused the starting point to be
too low and didn’t pick up an acceleration in installations at the time. Overall, the actuals therefore fell
outside the range of rooftop PV installations assumed across AEMO’s scenarios.

Figure 5 NEM rooftop PV installed capacity comparison, 2017-21

* As estimated in May 2019
** As estimated in September 2020

Figure 6 shows the PV non-scheduled generation (PVNSG) latest view of actuals12 compared to the first two
years of the 2019 PVNSG forecast. Note that unlike rooftop PV, there is no lag in reporting projects this size,
so there is no difference between actuals estimated at the time of the 2019 ESOO and what is estimated
today.
While the forecast starting point aligns well with the actuals at the time, the trajectory assumed a slowing
uptake trend as Large-scale generation certificate (LGC) prices were forecast to fall over the short term
lowering the economic advantage of new installations.

11
 For further information see CSIRO, 2019 Projections for Small Scale Embedded Technologies Report: https://aemo.com.au/-
 /media/files/electricity/nem/planning_and_forecasting/inputs-assumptions-methodologies/2019/2019-projections-for-small-scale-embedded-
 technologies-report-by-csiro.pdf
12
 As estimated in September 2020.

© AEMO 2020 | Forecast Accuracy Report 18
Figure 6 NEM PVNSG installed capacity comparison, 2017-21

The differences between forecasts and actuals by region are highlighted in Table 5, showing this for the
Central scenario, which was the main forecast discussed in the 2019 ESOO, and the Step Change scenario,
which had the forecast closest to the observed actuals.

Table 5 Rooftop PV and PVNSG installed capacity comparison by region, as at 30 June 2020 (MW)

 As installed at 30 June 2020 NSW QLD SA TAS VIC

 Estimated Actual (MW) 3078 3387 1417 172 2356

 Central Forecast (MW) 2275 3052 1219 162 2087
 Rooftop PV

 Step Change Forecast (MW) 2521 3235 1335 175 2203

 Actual difference to Central 35% 9% 16% 6% 13%
 forecast (%)

 Actual difference to Step Change 22% 5% 6% -2% 7%
 forecast (%)

 Estimated Actual (MW) 213 192 137 2.5 191

 Central Forecast (MW) 180 182 60 6 116

 Step Change Forecast (MW) 180 183 61 6 116
 PVNSG

 Actual difference to Central 18% 5% 128% -58% 64%
 forecast (%)

 Actual difference to Step Change 18% 5% 128% -58% 64%
 forecast Difference (%)

 Actual distributed PV difference 34% 10% 22% 4% 16%
 to Central forecast (%)
 Total

 Actual distributed PV difference 22% 5% 11% -4% 10%
 to Step Change forecast (%)

Actuals are based on AEMOs latest actual data as of 19 September 2020.

© AEMO 2020 | Forecast Accuracy Report 19
For all NEM regions, rooftop PV was under-forecast in 2019, with the largest variation seen in New South
Wales. As installed rooftop PV capacity is negatively correlated with operational consumption, maximum and
in particular minimum demand, higher uptake typically lowers operational consumption and demand.
The impact of under-forecasting rooftop PV results in the variance between the 2019 ESOO consumption
forecast and the actuals reported in the NEM of approximately 0.4% (see Figure 8 in Section 4). The impacts
on maximum and minimum demand are covered in Section 5.
As shown in the table, PVNSG was also under-forecast in all regions, except for Tasmania.
Section 8 presents the improvements already implemented and additional initiatives considered to both
improve the accuracy of the forecast near term and better reflect PV forecast uncertainty in the future.

3.4 Auxiliary loads
Auxiliary loads account for energy used within power stations (the difference between “as generated” energy
and “sent-out” energy shown in Figure 1). Auxiliary loads are not directly measured and so are modelled with
the assumption that they are equal to the difference between total generation as measured at generator
terminals and the electricity that is sent out into the grid.
The difference in auxiliary load between the 2019 ESOO forecast and the actual reported in the NEM is
approximately 0.5% (see Figure 8 in Section 4). It is the largest source of variance, though it is mostly due to
higher than actual auxiliary load factors used when developing the 2019 ESOO forecast.
For the 2019 ESOO forecast (as with previous years) AEMO has used consultant estimates for these values. To
improve accuracy (see the 2019 Forecast Improvement Plan), AEMO has in 2020 requested scheduled and
semi-scheduled generators to self-report their typical auxiliary load percentage, which AEMO now uses in its
modelling. The actual operational sent-out consumption for 2020 was calculated based on the new
percentages, which differs significantly for some power stations in Queensland and Victoria. The reported
differences are to a large extent a consequence of getting estimates of auxiliary load directly from generators.
Using generator supplied auxiliary load factors going forward, should ensure better consistency year on year
(no step change in assumptions) and is regarded as an improved estimate of auxiliary load and thus
operational sent-out consumption/demand.

3.5 Network losses
Network losses are the energies lost due to electrical resistance heating of conductors in the transmission and
distribution networks.
AEMO states losses as percentages of the energy entering the network. The intra-regional transmission and
the distribution losses are sourced from either the Regulatory Information Notice submitted by transmission
or distribution network service providers, or directly from the transmission or distribution network service
providers.
AEMO assumes the loss percentage for the latest financial year is a reasonable estimate for losses over the
entire forecast period. AEMO has assessed this assumption against recent trends and found it is appropriate.
Interconnector losses are modelled explicitly, predominantly as a function of regional load and flow.
The latest reported losses are used as best estimate of the actuals. These are generally lower than what was
assumed at the time the 2019 ESOO was made, in particular for distribution losses, as shown in Table 6.

© AEMO 2020 | Forecast Accuracy Report 20
Table 6 Estimated network loss factors

 Transmission Loss Factor Distribution Loss Factor

 Applied to 2019 Estimated actual for Applied to 2019 Estimated actual for
 forecast 2019-20 forecast 2019-20

 New South Wales 2.29% 2.30% 4.63% 4.25%

 Queensland 2.58% 2.56% 4.80% 4.76%

 South Australia 2.62% 2.54% 6.57% 6.43%

 Tasmania 2.43% 2.90% 5.31% 4.01%

 Victoria 2.62% 1.92% 5.12% 4.88%

Using the latest reported network losses as estimates for 2019-20, contributed to the third largest component
in the variance in the 2019 ESOO forecast of approximately 0.4% in the NEM (see Figure 8 in Section 4).

© AEMO 2020 | Forecast Accuracy Report 21
4. Operational energy
 consumption forecasts
AEMO forecasts annual operational energy consumption by region on a financial year basis. Figure 7 shows
central forecasts prepared from 2014 to 2019, for each region, relative to history. Most recent forecasts have
been somewhat similar; however, the forecasts in 2018 to 2020 generally projected lower growth rates
compared to earlier years.

Figure 7 Recent annual energy consumption forecasts by region
 80,000

 70,000
 Sent Out Consumption (GWh)

 60,000

 50,000

 40,000

 30,000

 20,000

 10,000

 0
 2012 2013 2014 2015 2016 2017 2018 2019 2020 2021 2022 2023 2024 2025
 Financial Year Ending

 2014 Forecast 2015 Forecast 2016 Forecast 2017 Forecast 2018 Forecast 2019 Forecast
 NSW QLD SA TAS VIC 2020 Forecast
 2020 Forecast 2020 Forecast 2020 Forecast 2020 Forecast

AEMO assessed annual consumption forecast accuracy by measuring the percentage difference between
actual and forecast values of the published forecasts. This percentage error is calculated using the formula
below:
 −
 = x 100

This calculation of percentage error varies from previous forecast accuracy reports, following the approach
outlined in the Forecast Accuracy Report Methodology 13. Using this formula, for example, a percentage error
of -20% implies the forecast is 20% lower than actuals.
Table 7 shows the performance of the last five central forecasts against the year that followed, each being
assessed one year ahead using this new percentage error calculation. In the last three years, the individual
percentage error for the individual regions has remained below 4% and the NEM weighted average has had a
percentage error less than 2%.

13
 At https://aemo.com.au/-/media/files/stakeholder_consultation/consultations/nem-consultations/2020/forecast-accuracy-report-methodology/forecast-
 accuracy-reporting-methodology-report-aug-20.pdf.

© AEMO 2020 | Forecast Accuracy Report 22
Table 7 Recent one-year ahead operational sent-out energy consumption forecast accuracy by region

 One-year ahead annual 2015 NEFR 2016 NEFR 2017 ESOO 2018 ESOO 2019 ESOO
 operational consumption forecast in forecast in forecast in forecast in forecast in
 accuracy (%) 2015-16 2016-17 2017-18 2018-19 2019-20

 New South Wales -1.2% -0.8% -0.1% -1.8% -0.3%

 Queensland 2.7% 1.7% 2.8% -3.0% 0.1%

 South Australia -1.6% 1.6% -0.8% -0.8% 3.2%

 Tasmania 3.6% 2.5% -0.1% 1.3% 2.3%

 Victoria 0.5% 5.2% 2.5% 3.9% 1.5%

 NEM 0.5% 1.6% 1.3% -0.6% 0.6%

Table 8 shows the sources of variance for the 2019-20 consumption forecasts of the NEM. This shows that the
largest sources of error relate to underestimates of rooftop PV generation, and overestimates of network
losses and generator auxiliary loads, as discussed in Section 3.

Table 8 NEM operational energy consumption forecast accuracy by component

 Category 2019 forecast (GWh) Actual (GWh) Difference (%) Indicative impact
 on total generation

 Cooling Degree Days 3,559 3,540 0.5% 0.0%

 Heating Degree Days 5,327 5,666 -6.0% -0.2%

 Connections Growth 685 809 -15.4% -0.1%

 Rooftop PV 11,312 12,064 -6.2% -0.4%

 Small non-scheduled generation 6,310 5,855 7.8% 0.2%

 Network losses 11,427 10,725 6.5% 0.4%

 Operational sent out 181,963 180,932 0.6% 0.5%

 Auxiliary load 10,153 9,178 10.6% 0.5%

 Operational as generated 192,116 190,111 1.1%

Figure 8 shows this graphically and highlights the residual variance, being the variance that is not explained
by any of the measured components, is small, equating to -425 GWh (or 0.25% over-forecast). Any impact of
COVID-19 not accounted for through variations in connections growth or rooftop PV installations, would be
included in this residual. The variances for the disaggregated components explain the vast majority of the
overall forecast error for the NEM combined.

© AEMO 2020 | Forecast Accuracy Report 23
Figure 8 NEM operational energy consumption variance by component

As component variances may net out at NEM level, care should be taken in making conclusions without
checking region-specific variances. The rest of this section details the regional break-down of these
components. In summary:
• The more significant sources of rooftop PV variance were in Queensland, New South Wales and
 South Australia.
• Network losses and generator auxiliary loads have been consistently overestimated across all
 mainland regions.

4.1 New South Wales
Operational as-generated energy consumption for New South Wales in 2019-20 was slightly above the
Central forecast, leading to a percentage error of -0.1%. Table 9 and Figure 9 demonstrate the forecast
accuracy by component. Summer cooling degree days and winter heating degree days were close to median.
The largest inaccuracy driver was an under-forecast of rooftop PV mostly offset by an over forecast of small
non-scheduled generation (which was lower due to drought affecting hydro generation). Overall, the model
for New South Wales has performed well with the residual being 422 GWh as per Figure 9 (or -0.6%).
The positive residual is slightly surprising given COVID-19 impacts on economic activity, and may in fact
indicate that other input variables, not easily assessable (such as an over-estimation of energy efficiency), may
also be contributing to the differences between forecasts and actual consumption in New South Wales.

© AEMO 2020 | Forecast Accuracy Report 24
Table 9 New South Wales operational energy consumption forecast accuracy by component
 Category 2019 forecast Actual (GWh) Difference (%) Indicative impact on
 (GWh) total generation

 Cooling Degree Days
 1,294 1,289 0.4% 0.0%
 Heating Degree Days
 1,845 1,914 -3.6% -0.1%
 Connections Growth
 258 332 -22.1% -0.1%
 Rooftop PV
 3,027 3,470 -12.7% -0.6%
 Small non-scheduled generation
 2,117 1,763 20.0% 0.5%
 Network losses
 4,106 3,865 6.2% 0.3%
 Operational sent out
 66,182 66,412 -0.3% -0.3%
 Auxiliary load
 3,096 2,932 5.6% 0.2%
 Operational as generated
 69,277 69,344 -0.1%

Figure 9 New South Wales operational energy consumption variance by component

4.2 Queensland
Operational as-generated energy consumption for Queensland in 2019-20 was below the Central forecast by
0.9%. Table 10 and Figure 10 demonstrate the forecast accuracy by component. Summer cooling degree days
were slightly higher and winter heating degree days were slightly lower compared to the median forecast.
The largest inaccuracy driver was an under-forecast of rooftop PV, but this was somewhat offset by an
over-forecast of small non-scheduled generation and lower auxiliary loads. The latter was driven by a change
in data source for auxiliary load as explained in Section 3.4.
Subject to input variable correction, the model for Queensland has performed well with the residual being
just 165 GWh as per Figure 10 (or -0.3%).

© AEMO 2020 | Forecast Accuracy Report 25
Table 10 Queensland operational energy consumption forecast accuracy by component

 Category 2019 forecast Actual Difference (%) Indicative impact on
 (GWh) (GWh) total generation

 Cooling Degree Days 1,486 1,603 -7.3% -0.1%

 Heating Degree Days 392 317 23.6% 0.0%

 Connections Growth 199 158 25.4% 0.0%

 Rooftop PV 4,006 4,278 -6.4% -0.1%

 Small non-scheduled generation 2,232 2,115 5.5% 0.1%

 Network losses 2,935 2,889 1.6% 0.0%

 Operational sent out 51,001 50,967 0.1% 0.0%

 Auxiliary load 3,658 3,212 13.9% 0.2%

 Operational as generated 54,659 54,179 0.9%

Figure 10 Queensland operational energy consumption variance by component

4.3 South Australia
Operational as-generated energy consumption for South Australia in 2019-20 was below the Central forecast
by 3.6%. Table 11 and Figure 11 demonstrate the forecast accuracy by component. Summer cooling degree
days were slightly lower but winter heating degree days were higher compared to the median forecast.
The largest inaccuracy drivers were an under-forecast of rooftop PV and small non-scheduled generation
(mainly driven by PV installations >100 kW). The residual variance shown in Figure 11 is moderate at about
1.5%. Analysis of meter data indicates demand was down due to COVID-19 restrictions, where residential

© AEMO 2020 | Forecast Accuracy Report 26
demand in South Australia, unlike the other regions, did not to the same extent offset the reduction in
business consumption.

Table 11 South Australia operational energy consumption forecast accuracy by component

 Category 2019 forecast Actual Difference (%) Indicative impact
 (GWh) (GWh) on total generation

 Cooling Degree Days 1,184 1,001 17.9% 0.4%

 Heating Degree Days 1,771 2,057 -14.2% -0.7%

 Connections Growth 31 48 -35.6% -0.1%

 Rooftop PV 1,603 1,692 -5.2% -0.7%

 Small non-scheduled generation 218 311 -30.0% -0.8%

 Network losses 982 916 7.2% 0.5%

 Operational sent out 12,276 11,891 3.2% 3.2%

 Auxiliary load 307 252 21.6% 0.4%

 Operational as generated 12,582 12,143 3.6%

Figure 11 South Australia operational energy consumption variance by component

4.4 Tasmania
Operational as-generated energy consumption for Tasmania in 2019-20 was below the Central forecast by
2.3%. Table 12 and Figure 12 demonstrate the forecast accuracy by component. Winter heating degree days
were lower than the median forecast.
The largest source of inaccuracy was an under-forecast of small non-scheduled generation, where upgrades
to some of Hydro Tasmania’s Lower Derwent power stations saw generation increase above historical levels.

© AEMO 2020 | Forecast Accuracy Report 27
This leaves a residual of -132 GWh (1.3%) which is partly explained by lower consumption from large industrial
loads than forecast, partly due to extended outages and partly reduced activity due to COVID-19.
Subject to input variable correction, the model for Tasmania has performed well.

Table 12 Tasmania operational energy consumption forecast accuracy by component

 Category 2019 forecast Actual Difference (%) Indicative impact on
 (GWh) (GWh) total generation

 Cooling Degree Days - - - 0.0%

 Heating Degree Days 620 584 6.1% 0.4%

 Connections Growth 23 31 -26.4% -0.1%

 Rooftop PV 191 182 5.1% 0.1%

 Small non-scheduled generation 456 544 -16.1% -0.9%

 Network losses 480 490 -2.2% -0.1%

 Operational sent out 10,178 9,951 2.3% 2.3%

 Auxiliary load 113 106 6.9% 0.1%

 Operational as generated 10,291 10,057 2.3%

Figure 12 Tasmania operational energy consumption variance by component

4.5 Victoria
Operational as-generated energy consumption for Victoria in 2019-20 was below the Central forecast by 2.1%.
Table 13 and Figure 13 demonstrate the forecast accuracy by component. Winter heating degree days were
higher than the median forecast and Summer cooling degree days were slightly lower.
The largest inaccuracy driver was an over-forecast of network losses and auxiliary load. The latter was driven
by a change in data source for auxiliary load as explained in Section 3.4.

© AEMO 2020 | Forecast Accuracy Report 28
This leaves a moderate residual of -742 GWh (or 1.7%) which may, in part, be attributable to COVID-19
restrictions. Also, while the installed PV capacity was under-forecast for Victoria, forecast PV generation was
slightly over the observed actual. Looking at solar insolation, it was a low solar year, but it may not sufficiently
explain the outcome and AEMO will review the median PV generation used in the forecast to ensure it is fit
for purpose. It could be another source of explanation for the residual.
Subject to input variable correction, the model for Victoria has performed adequately.

Table 13 Victoria operational energy consumption forecast accuracy by component

 Category 2019 forecast Actual (GWh) Difference (%) Indicative impact
 (GWh) on total generation

 Cooling Degree Days 423 346 22.2% 0.2%

 Heating Degree Days 1,938 2,230 -13.1% -0.7%

 Connections Growth 174 240 -27.5% -0.1%

 Rooftop PV 2,485 2,443 1.7% 0.1%

 Small non-scheduled generation 1,288 1,122 14.7% 0.4%

 Network losses 2,925 2,564 14.1% 0.8%

 Operational sent out 42,327 41,711 1.5% 1.4%

 Auxiliary load 2,979 2,676 11.3% 0.7%

 Operational as generated 45,306 44,387 2.1%

Figure 13 Victoria operational energy consumption variance by component

© AEMO 2020 | Forecast Accuracy Report 29
You can also read