FORTUM - For a cleaner world - Equity story of - Investor / Analyst material February 2020
←
→
Page content transcription
If your browser does not render page correctly, please read the page content below
Equity story of

FORTUM – For a cleaner world

Investor / Analyst material
February 2020
Disclaimer

This presentation does not constitute an invitation to underwrite,
subscribe for, or otherwise acquire or dispose of any Fortum shares.
Past performance is no guide to future performance,
and persons needing advice should consult an independent financial adviser.
Any references to the future represent the management’s current best understanding.
However the final outcome may differ from them.

2

Content
Fortum in brief                        4–5
Energy market transition               6 – 12
Fortum’s strategic route               13 – 20
Full year 2019 results                 21 – 42
Appendices                             43 –
European and Nordic power markets      44 – 49
Fortum’s power generation              50 – 55
Fortum’s Russian capacity and prices   56 – 57
Historical achieved prices             58
Dividend                               59
IR contacts                            60

3
Fortum in brief

Fortum at a glance
    Description of Fortum                                                                                                   Key shareholders                                    Finnish households
                                                                                                                                                                                9.5%         Financial and
    •   A leading clean-energy company across the Nordic region, the Baltic                                                  •     Listed on the Helsinki
                                                                                                                                                                                             insurance institutions
        countries, Poland, and Russia                                                                                              Stock Exchange since
                                                                                                                                                                                             1.7%
                                                                                                                                   1998
    •   A circular economy champion, providing solutions for sustainable cities,                                                                                                                 Other Finnish
        including waste, recycling, and biomass                                                                              •     Market capitalisation      Finnish                            investors
                                                                                                                                   of ~EUR 20bn                 State                            7.7%
    •   Rated BBB/CreditWatch Negative and BBB/Rating Watch Negative by
                                                                                                                                                               50.8%
        S&P and Fitch respectively                                                                                           •     Finnish State is a
                                                                                                                                   majority owner                                               Foreign
    •   In 2018, Fortum closed its tender offer to shareholders in Uniper
                                                                                                                                                                                                investors
        (holding of 49.99% of the outstanding shares and voting rights as of                                                                                                                    30.3%
        31.12.2018), in 2020 additional >20% stake to be closed                                                                    31.1.2020

    Operations by business segment                                                              Production by source
                                   Consumer Solutions 8%
                            City                                                                           Natural gas 37%                                    Natural gas 59%           Coal 18%
                      Solutions                                Generation                                                                           Nuclear
                          17%                                       50%                                                                             power
                                                                                                                                                    31%
                                                                                                                                                                                               Waste 10%
                                     EBITDA(1)                                                           Waste1%                   Power                                     Heat
                                                                                                    Wind, solar 1%
                                    EUR 1.8 bn                                                        Biomass 1%                  76.3 TWh                                26.4 TWh
                                                                                                           Coal 3%
                                                                                                                                                                                               Biomass 9%
                                                                                                                                                                                           Heat pumps, electricity
                                                                                                                                                                                         Peat 1%          2%
                        Russia 25%                                                                            Hydropower 26%                                                          Others 1%

        Note: All data as of FYE 2019 unless otherwise stated
4       (1) Comparable EBITDA defined as operating profit plus depreciation and amortisation less items affecting comparability
Fortum in brief

Fortum’s geographical footprint

                  Nordic countries                                        Russia             Key figures 2019
                  Power generation                                        PAO Fortum         Sales                  EUR 5.4 bn
             #3
                  45.5 TWh                                                                   Comparable
             #5   Heat sales                                        #10
                                                                          Power generation   EBITDA                 EUR 1.8 bn
                  5.9 TWh                                                 29.3 TWh           Total assets           EUR 23 bn
             #1   Electricity customers                             #7    Heat sales         Personnel              8,200
                  2.3 million                                             16.9 TWh

                  Poland                                         Baltic countries            Sales by market area 2019
                  Power generation                               Power generation                      Poland   Other 4%
                  0.6 TWh                                        0.7 TWh                                  7%
                                                                                                                                Nordics
                  Heat sales                                     Heat sales                                                     69%
                                                                                                  Russia
                  3.3 TWh                                        1.5 TWh
                                                                                                    20%          EUR
                                                                                                                5.4 bn

       x    = Fortum market share ranking

    Note: Ranking based on year 2018 pro forma figures
    Source: Fortum, company data, shares of the largest actors
5
Energy market transition

Three main drivers are shaping the future electricity markets

             Climate and                 Politics and                   Technology
             Environment                 Regulation                    Development

         •   Decarbonisation to      •   National and              •    Solar and wind
             reach Paris agreement       international interests
             targets                                               •    Digitalisation and
                                     •   Market models                  artificial intelligence
         •   Electrification in
             heating,                •   Emission trading          •    Short-term and
             transportation and                                         seasonal storage
             key industrial          •   Geopolitical
             processes                   uncertainty               •    E-mobility ecosystem

         •   Resource efficiency                                   •    Demand response

6
Energy market transition

Europe needs to eliminate CO2 emissions to reach climate
goals – this requires actions from all sectors
    MtCO2-eq

    6 000
                                Greenhouse gas emissions

    5 000

                                                                                                        Coal
    4 000                                                                                                             Power
                                                                                                                                                                           - 40 %

    3 000                                                                                                Oil       Transport1
                                                                                                                                                                                                - 60 %

    2 000                                                                                                           Industry2
                                                                                                        Gas
                                                                                                                   Buildings3

    1 000                                                                                                                                                                                                                     - 80 %
                                                                                                                                                                                              Current EU climate targets
                                                                                                      Others         Others4                                                              (commitments compared to 1990)
                                                                                                                                                                                                                              - 95 %
        0                                                                                              Source        Sector
            1990                                 2000                                    2010                                     2020                                    2030                  2040                       2050
               Sources: European Environmental Agency (total emissions), IEA World Energy Outlook 2018 (fuel emissions), EURELECTRIC (sector emissions), Fortum Industrial Intelligence
               1 including international aviation and marine
7              2 iron & steel and chemicals are among the biggest contributors
               3 residential and commercial heating & cooling
               4 non-energy related emissions: industrial processes and product use, waste management, agriculture, fugitive emissions
Energy market transition

The decades of electricity will affect several sectors
– and Fortum is well positioned for decarbonisation
Global climate                         Electricity demand
challenge (indicative)                 (2018-2050)              Sector          Future solutions, examples              Fortum’s current offering, examples

                                                                                  CO2-free generation, hydrogen,
                                                                 Power                                                         Nuclear, hydro, solar, wind
                                                                                   batteries, demand response

           4°C                                      +                                    Electric vehicles,                            E-mobility,
                                                               Transport
                                                                                hydrogen/biofuels for heavy transport                   pyrolysis

                                                                                        Low-CO2 DH/CHP,                                 Biofuel,
                                                            Heating & cooling
                                                                                       heat pumps, hydrogen                    waste-to-energy DH/CHP

                                                                                  Electrified processes, hydrogen,
                                                                Industry                                                             B2B solutions
         1.5°C                                  +++                                  resource efficiency, CCS

                                                                                             Recycling,
                                                                 Other                                                              Plastic recycling
                                                                                    biomaterials (e.g. fractioning)

    DH/CHP = District heating/combined heat and power
    CCS = Carbon capture and storage

8
Energy market transition

Building the utility of the future
    FUTURE UTILITY
                                         Hydrogen and methane for
    Power-to-Gas                                                                                      Sustainable materials
                                         traffic and industrial use
    • Sustainable hydrogen               Hydrogen, methane                                              • Recycling
      production                         and excess heat                                    Electricity • Energy recovery
    • Synthetic “clean” gas
      production                                              UTILITY TODAY

                           Electricity
                                                  Decarbonising power and heat generation                             Raw
                  CO2
                                                                                                                      material

    CO2-sink                  Heat                                                                      Bio economy
                                                              Customer solutions
    • Carbon capture and                                                                                • Traffic fuels
      storage                                                                                           • Bio-based material
    • Carbon capture and                 Electricity                                        Electricity
                                                                                                          production
      utilisation                                                                           Heat

9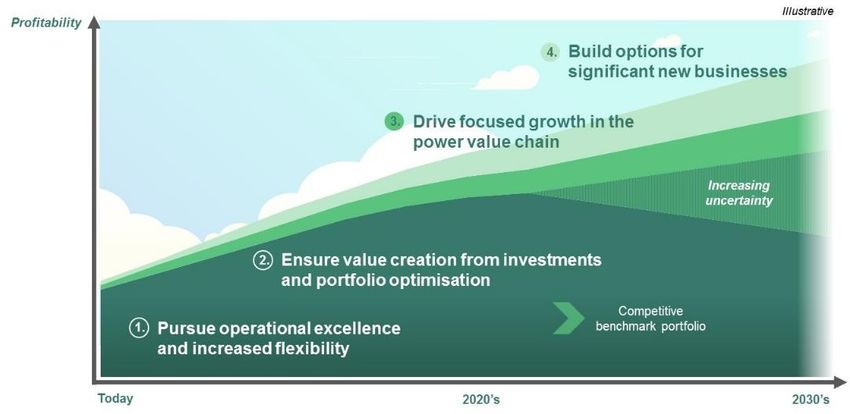
Energy market transition

Volatility and uncertainty in the European power market
increases the value of flexible assets

     Intermittent renewables

     Nuclear and coal closures

     Increasing role of gas

                                         Volatility and
     Supply-demand balance
                                          uncertainty
     Increased interconnection between
     Nordics and Continent

     Commodity and CO2 prices

     Weather conditions

10
Energy market transition
The MSR introduces tightness to carbon market
Linear reduction factor (LRF) tightens the market Market stability reserve restores scarcity Abatement from coal to gas switching
by reducing future auction volumes depends on coal and gas prices, together
MtCO2
Illustrative volumes (Mton of CO2eq.)
represented by a switching range
2500
Eur/t
24% of cumulative surplus Need for abatement 60
2000 or inventory reduction
50 Switch range CO2 price
57% of cap
1500
40
1000 Cap (excl. aviation)
30
43% of cap
500
EU ETS emissions (incl. call 20
on EUAs from aviation)
0 10
2010
2012
2014
2016
2018
2020
2022
2024
2026
2028
2030
2032
2034
2036
2038
2040
2042
2044
2046
2048
2050
Free Auction MSR Auction Deficit Emissions
0
allocation pre- effect post-
MSR MSR 2017 2018 2019 2020
• Linear reduction factor (LRF) is the percentage of • When TNAC2 > 833 Mt, MSR deducts 24% of the • CO2 price has almost quadrupled since
baseline supply1 by which the annual supply of TNAC from the auction volume each year placing November 2017, when the final decision was
allowances (cap) is reduced every year. LRF is them into the reserve during 2019-2023 reached on the future EU ETS rules, including
set at • MSR rate is 12% during 2024-2030 the intake rate of the Market Stability Reserve,
• 1.74% for 2013-2020 (equals to a • When TNAC < 400 Mt, MSR releases 100 million which became operational in January 2019
reduction of 38 MtCO2/year) EUAs annually from the reserve adding them to • Market tightness forces the EUA market to find
• 2.2% for 2021-2030 (equals to a future auctions ways to reducing demand, including by coal-to-
reduction of 48 MtCO2/year) • 900 million back loaded allowances from 2014- gas switching, making the relative gas/coal price
• In total, emissions are set to decrease by 43% by 2016 will be transferred into the MSR in 2019-2020 an important price anchor for CO2
2030 vs. 2005 • As from 2023, allowances in MSR above the total • Political risks also continue to play a role in EUA
• Next LRF review is scheduled for 2024 number of allowances auctioned during the prices, with developments around Brexit and
• 3.03% LRF from 2030 onwards would previous year will be cancelled national coal phase-out policies in particular
deliver net zero emissions by 2050 • Next MSR review is scheduled in 2021 being closely watched
2 TNAC = total number of allowances in circulation = Efficiency assumptions in switching range;
1 Average
11 annual total quantity of allowances released in 2008-2012. supply – (demand + allowances in the MSR). According to the latest at low-end: gas 52% and coal 34%;
publication May 15, 2018 the TNAC corresponds to 1655 million at high-end: gas 48% and coal 38%. O&M
allowances. cost assumptions apply.Energy market transition
Several Western European countries exiting coal over the next
decade
FI: Phase-out
• France to phase out coal from power sector at latest in 2022 Germany: Phase- by 2029
out by 2038
SE: Last coal
• United Kingdom to exclude coal condense from capacity plant to close
market by capping allowed emissions from 2025 2022
UK: Phase-out by
• Netherlands’ new government aims at exit by 2030, 2025
regulation not yet in place
NL: Phase-out by
• Poland: investments in new coal generation, after 2025 will 2030
be based on CHP or other technologies, which will allow the
emission standards on the level of 450kg CO2 per MWh of FR: Phase-out by
2022
generated energy
• Germany to set a binding coal exit date
AT: Phase-out by 2025
– Closure of 12.5 GW by 2022 (compared to 42.5 GW in 2017), additional 13
GW by 2030, latest 2038 all remaining capacity
– Compensation for hard coal operators expected to based on auctions, lignite PT: Phase-out by 2030
operators negotiate compensations directly with the government
– Coal regions to receive EUR 40 billion over next 20 years
– EUR 2 billion annual compensation to customers in lower grid fees and/or
taxes proposed
IT: Phase-out by 2025
– Respective amount of CO2 allowances to be cancelled in the EU Emission
Trading Scheme (ETS)
Phase-out from Phase-out from Phase-out from Phase-out commitment
power sector power sector power sector mainly via “Powering
latest by 2025 latest by 2030 latest by 2040 past coal Alliance”
12Fortum’s strategic route Positioning Fortum for the decade of electricity – For a cleaner world 13
Fortum’s strategic route

Fortum’s strategic priorities in a changing energy market

     1. Pursue operational excellence and          2. Ensure value creation from investments
        increased flexibility                         and portfolio optimisation

     •   Ensure benchmark performance              •   Increase shareholder value from Uniper
     •   Focus on cash flow and efficient use of   •   Optimise portfolio to fit the changing business
         balance sheet                                 environment

     3. Drive focused growth in the power          4. Build options for significant
        value chain                                   new businesses

     •   Grow in CO2-free power generation         •   Create new sizeable profit contributor
     •   Develop value-adding offerings and            independent of power prices
         solutions for customers                   •   Build on industrial logic and synergies with
                                                       current businesses and competences

14
Fortum’s strategic route
Delivering on financial targets through operational excellence
and portfolio optimisation in the short to mid term
Strategic priorities… … creating value
Operational excellence
• Continue productivity improvement • Benchmark performance
• Prioritise capital expenditure
• Optimise cash flow
Increased flexibility • Strengthen balance sheet
• Maximise flexibility in current businesses and assets
• Develop new sources of flexibility
• Create financial flexibility
• Solid investment grade rating
Value creation and portfolio optimisation
• Ensure competitive asset fit for changing business environment
• Focus on core businesses
• Selective investments
15Fortum’s strategic route
Scale, competences and resources to prosper, grow and lead
European energy transition
Q2 2019 LTM combined Combined power generation assets(2)
Comparable EBITDA(1)
Fortum
EUR 1.6bn
Nordics
Total Russia
~EUR2.9bn #2
#3
Uniper
EUR 1.3bn
Baltics
Combined capacity split(3)
Low + Zero UK
emission NL
16% Germany Poland
Hydro
36% Total
8% Nuclear #2
Gas
50.3GW 7%
+ India
Thermal
Hungary
Other
(1)
Fortum Uniper Combined geographical presence Combined market positions
32% Coal phased
out over time
(1) Comparable EBITDA is based on the Fortum's Comparable EBITDA and Uniper's Adjusted EBITDA as defined in Fortum’s and Uniper's financial statements. No impacts from the assumed transaction has been included.
(2) Market positions for Central-Europe/Europe and Nordics are based on total installed capacity; the market position in Russia is based on thermal capacity.
(3) Based on 31 Dec. 2018 capacity.
16Fortum’s strategic route
Illustrative combined key financials
Financial information in the table below is derived and based on Fortum's Half-year Financial Report
January-June 2019 and Financials 2018 and Uniper‘s Half-year Interim Report 2019 and Annual Report 2018
EUR million Fortum LTM Q2 2019 Uniper LTM Q2 2019 Impact from transaction(4) Combined LTM Q2 2019
Sales 5,404 78,928 84,332
Comparable EBITDA(1) 1,621 1,260 2,881
Capex(2) 715 638 1,353
Interest-bearing liabilities, 30 June 2019(3) 6,719 1,570 2,253 10,542
Liquid funds, 30 June 2019(3) 1,297 717 2,014
Net interest-bearing liabilities, 30 June 2019(3) 5,422 853 2,253 8,528
Number of employees, 30 June 2019 8,383 11,962 20,345
Combined key financials are presented for illustrative purposes only and they do not include possible impacts from aligning differences in accounting principles,
effects from co-owned power companies or eliminations of sales, purchases, receivables and payables between the Groups.
(1) Comparable EBITDA is based on the Fortum's Comparable EBITDA and Uniper‘s Adjusted EBITDA as defined in Fortum’s and Uniper's financial statements. No impacts from the assumed transaction has been
included.
(2) Capex is based on Fortum's reported Capex and Uniper's reported Investments.
(3) Fortum's interest-bearing liabilities and liquid funds as defined in Fortum's financial statements. Uniper‘s Interest-bearing liabilities includes 'Financial liabilities and liabilities from leases' as defined in Uniper’s
financial statements (but excludes ‘Margining liabilities’ amounting to EUR 1,002 million). Liquid funds as defined in Uniper‘s financial statements. Please see further information regarding Fortum's Net debt and
Uniper‘s Net financial position and Economic net debt in their respective financial statements.
(4) ‘Impact from transaction’ is based on the acquisition of approximately 20.5% of Uniper’s outstanding share capital at a price of EUR 29.93 per share.
17Fortum’s strategic route Fortum is a forerunner in sustainability We engage our customers and society to drive the change towards a Fortum listed in several cleaner world. Our role is to accelerate this change by reshaping the energy sustainability indexes and ratings: system, improving resource efficiency, and providing smart solutions. This way we deliver excellent shareholder value Increasing CO2-free power generation Annual CO2-free power generation has almost tripled from 15 TWh in 1990 to 43 TWh in 2018 Among the lowest specific emissions 96% of its power generation in the EU and 57% of its total power generation was CO2-free in 2018. Fortum’s specific emissions from power generation in the EU were 28 gCO2/kWh in 2018, total 174 gCO2/kWh. Growing in solar and wind Targeting a multi-gigawatt portfolio in solar and wind 18
Fortum’s strategic route

Fortum’s long-term financial targets and dividend policy

                                                             Fortum’s dividend policy is
 Return on capital employed             Comparable
     (ROCE) of at least            Net debt/EBITDA ratio         to pay a stable,
                                         at around         sustainable, and over
        10%                            2.5x                time increasing dividend
                                                           of 50-80% of earnings per share,
                                                               excluding one-time items
                              Having a solid
                                          investment
                                 grade rating is a key
                                    priority for Fortum

19
Fortum’s strategic route
Fortum’s evolution and historical strategic route
Skandinaviska Birka Energi Länsivoima Elnova Østfold
Elverk 50% Fortum →100% 50% → 100%
50% Stockholm
Gullspång merged Shares in
with Stockholm Energi Hafslund
Gullspång Stora Kraft Birka Energi TGC-1 E.ON Divestment
50% → 100% established Finland of Lenenergo
Shares in shares
Länsivoima Lenenergo shares → Lenenergo Oil business
45% → District heating spin-off TGC-10
65% in Poland →
IVO FORTUM
NESTE 1996 1997 1998 2000 2002 2003 2005 2006 2007 2008
2011 2012 2014 2015 2016 2017 2018
Divestment of Divestment of Divestment of electricity Divestment of DUON Nordkraft wind power Investment in Uniper
heat operations non-strategic distribution business electricity distribution
outside of heat business business
Stockholm Ekokem Restructuring of Divestment of
Divestment of electricity ownership in Hafslund ownership in
distribution and heat businesses Hafslund Produksjon
Divestment of Divestment of Turebergs Russian wind power JV
Fingrid shares small scale hydro Divestment of Grangemouth Recycling
power plant
Divestment of Gasum shares
20Financial Statements 2019 Fortum Corporation 6 February 2020
Full year 2019 results

Strong operational performance in 2019
– Financial targets achieved
 • Fortum’s achieved power price at EUR 36.8, up 2.2 EUR/MWh
     – Nordic spot power price down, -12%
 • Comparable EBITDA at EUR 1,766 million, +16%
 • Comparable operating profit at EUR 1,191 million, +21%
 • Share of profits of associates and JVs at EUR 744 (38) million
 • EPS at EUR 1.67 (0.95)
     – Items affecting comparability EUR -0.07 (0.15)
     – Uniper contribution EUR 0.71 (0)
 • Strong cash flow from operating activities at EUR 2,015 (804) million
 • Return on capital employed 10%
 • Dividend proposal of EUR 1.10 per share

22                                                                         Joensuu CHP, Finland
Full year 2019 results
Solid and consistent strategy execution
– determined coal phase-out actions
New reduced long-
term target for
Agreement to buy specific CO2
>20% stake in emissions of 180
Uniper – g/kWh (200 g/kWh)
Fortum’s Commissioning of
ownership a 250 MW solar
to rise >70% Divestment of plant in Pavagada,
Joensuu CHP plant, Carbon neutral India
EUR 530 million district heating in
ROCE 10% –
Espoo in 2020s,
Net debt/EBITDA
target to
reached target level
Divestment of 80% discontinue the use
of around 2.5x
of Nordic wind of coal by end of
2025 Commissioning of
portfolio,
50 MW of wind
EUR 250 million Strategic review of capacity,
district heating in and 550 MW under
Poland, Baltics, Coal capacity construction in
and Järvenpää, closures at Russia
Finland Stockholm Exergi &
TSE
Imatra HPP, Finland
–
Inkoo 1 GW plant
23 TSE= Turun Seudun Energiantuotanto, Fortum associated company
decommissionedFull year 2019 results
Fortum’s CO2-free power generation to increase by ~60% as
Uniper will be consolidated in 2020
Fortum's power generation, TWh
200
Uniper consolidated 2020:
175
• ~60% increase in total
150
CO2-free generation
• ~200% increase in gas
125
fired power generation
100
• ~16% of total share of
coal fired power
75
CO2-free Gas Coal Other
generation
50
• ~2% of consolidated
25
sales revenue derives
from coal
0
2020 ind.
1990
1991
1992
1993
1994
1995
1996
1997
1998
1999
2000
2001
2002
2003
2004
2005
2006
2007
2008
2009
2010
2011
2012
2013
2014
2015
2016
2017
2018
2019
INDICATIVE GENERATION FOR 2020, NOT OFFICIAL GUIDANCE.
Note: Fortum actuals 1990-2019 excluding associated company Stockholm Exergi. 2020 indicative figures adjusted for Nordic wind and Joensuu CHP assets sold in 2020. Uniper’s disclosed 2018
numbers used for indicative consolidation 2020 with the following corrections/assumptions: normal hydrological year, accounting view adjusted to pro forma, French coal assets sold, Datteln 4
approximately 2.2 TWh in 2020, no net increase in generation from Beresovskaya 3, coal-to-gas switch 2 TWh, Ringhals 2 closed on 31 Dec 2019.
24Full year 2019 results
German coal phase-out law and related plans by Uniper
• Law to phase out lignite and hard coal latest by 2038 Current1) 39 GW to be reduced to 30 GW by 2022 and to
was approved by the government 17 GW by 2030
– The law still needs to be approved by the parliament 40,0 40
35,0 35
• As midway targets from current 39 GW, capacity to be
30,0 30
cut to 30 GW by 2022 and 17 GW by 2030 21
25,0 25
– For lignite units, a fixed exit path was agreed with the 15
GW
operators 20,0 20
15,0 15
– For hard coal, exits until 2026 will be determined in voluntary 8
auctions 10,0 18 10
15
5,0 9 5
– Hard coal volumes to be closed are fixed at 4 GW in 2020
and 1.5 GW in 2021 0,0 0 0
2018
2020
2022
2024
2026
2028
2030
2032
2034
2036
2038
• In 2032, assessment of potential full phase-out already
in 2035 Lignite / allowed max Hard coal / allowed max
• Uniper announced shut down of 1.5 GW coal-fired Hard coal, exit guideline Lignite, fixed exit path
generation in 2022 and 1.4 GW by the end of 2025 Hard coal, first auctions
subject to implementation of proposed legislation 1) Source: Bundesnetzagentur, status as of November 2019
25Full year 2019 results
Nordic water reservoirs climbing above historical average
Reservoir content (TWh)
120
• During 2019 reservoirs
remained close to
100 historical average
• Dry and cold weather
80
during October and
November resulted in a
60 moderate deficit by the
end of the year
40
• Change towards mild,
Norway windy, and rainy weather
20 at the year end led to rapid
Sweden Average
2000 2003 2018 2019 2020
2000-2018 increase in the Nordic
Finland
0 water reservoirs at the
Q1 Q2 Q3 Q4 beginning of 2020
Source: Nord Pool, 2019 by country
26Full year 2019 results
Weak coal and gas prices in 2019, downward trend continued in Q4
USD / t Coal price (ICE Rotterdam)
120 Realised The coal market traded lower during Q4: Soft demand signals from Asia coupled
Futures 21 Oct 2019
100 Futures 3 Feb 2020
with weaker European gas prices brought API2 coal price lower. Year 2019 was
80 on a clear downtrend on weaker Chinese growth and a global LNG glut pushing
prices lower.
60
• Chinese domestic coal production continued to grow strongly, +6.2 % YoY on
40 average in October-November.
20 • South Korea and Taiwan have suspended operation or reduced operation on
0 several coal plants over the winter to limit local pollution.
Q1 Q2 Q3 Q4 Q1 Q2 Q3 Q4 Q1 Q2 Q3 Q4
2018 2019 2020
EUR / MWh Gas price (TTF)
30
Realised The European gas market plummeted in Q4 as Russia and Ukraine signed a
Futures 21 Oct 2019
25
Futures 3 Feb 2020
new transit agreement, removing the risk of supply disruptions this winter. Year
20 2019 was a weak year for gas with LNG prices dropping on supply boost and
soft Asian demand.
15
• European gas storage grew to unprecedented levels as the region absorbed
10 95% of the incremental global LNG supply.
5
0
Q1 Q2 Q3 Q4 Q1 Q2 Q3 Q4 Q1 Q2 Q3 Q4
2018 2019 2020
27 Source: ICE, RefinitivFull year 2019 results
CO2 peaked at EUR 30, crude oil prices more stable in 2019
EUR / tCO2 CO2 price (ICE EUA)
30
The CO2 market traded rather sideways in Q4 after peaking in July. Weaker
25 TTF gas prices was offset by the positive impact of a delayed Brexit from 31st
20 October to January 31st. For 2019 as a whole EUAs traded in a volatile
fashion due to Brexit uncertainties, but ended the year somewhat lower than
15 the start of the year.
10 • The CO2 price was relatively strong in Q4 despite continuous weak front gas
Realised
5 Futures 21 Oct 2019
prices. This has increased the competitiveness of gas in power generation.
Futures 3 Feb 2020
0 • The MSR (Market Stability Reserve) has fundamentally tightened the EUA
Q1 Q2 Q3 Q4 Q1 Q2 Q3 Q4 Q1 Q2 Q3 Q4
2018 2019 2020 market.
USD / bbl Crude oil price (ICE Brent)
120 Realised Crude oil strengthened in Q4 OPEC+ decided to deepen its supply cuts
Futures 21 Oct 2019
100 Futures 3 Feb 2020
in Q1 by 500.000 bld. 2019 was a year of strength for Crude markets as
80 US sanctions pushed Iranian & Venezuelan output much lower.
60 • Increased tensions in the Middle East brought higher prices in Q4 and
volatility to oil markets.
40
• Very strong US equities likely supported positive investor sentiment
20 also in the Crude markets.
0
Q1 Q2 Q3 Q4 Q1 Q2 Q3 Q4 Q1 Q2 Q3 Q4
2018 2019 2020
Source: ICE, Refinitiv
28Full year 2019 results
Warm, wet, and windy weather with weak commodities
– Nordic prices declined at end of 2019 and in early 2020
EUR/MWh Nordic spot and forward prices • During Q4, the average Nord Pool system spot
70
Realised system price
price was 38.6 (47.6) EUR/MWh
60
Futures 21 Oct 2019 • The average area prices were:
Futures 3 Feb 2020
– 43.5 (49.6) EUR/MWh in Finland
50
– 38.5 (48.2) EUR/MWh in Sweden (SE3, Stockholm)
40 • The decline in Nordic spot prices during Q4
2019 was caused by a significant change in
30
weather pattern and low prices in Continental
20
Europe, driven by declining gas prices.
• The Finnish spot price was supported by the
10
deficit in Finnish water reservoirs and the Baltic
electricity prices.
0
Q1 Q2 Q3 Q4 Q1 Q2 Q3 Q4 Q1 Q2 Q3 Q4 Q1 Q2 Q3 Q4
2018 2019 2020 2021
• Along with the declining spot price, also the
Source: Nord Pool, Nasdaq Commodities
forward prices have dropped significantly since
December.
29Full year 2019 results
Achieved power price up despite lower spot prices
-19% -2%
+8%
+1%
Changes refer to year-on-year difference (Q4 2019 versus Q4 2018)
NOTE: Achieved power price (includes capacity payments) in roubles increased by 1%
30Full year 2019 results
Generation
Q4 2019 2019
• Higher achieved power price, • Higher achieved power price,
+0.4 EUR/MWh, +1% +2.2 EUR/MWh, +6%
• Good operational performance • Good operational performance
and load factor at a good level – Higher hydro and nuclear
– Higher hydro and nuclear volumes
volumes • Nuclear load factor at the
highest level in Fortum’s history
MEUR Q4 2019 Q4 2018 2019 2018
Sales 583 557 2,141 1,842
Comparable EBITDA 278 225 939 763
Comparable operating profit 239 188 794 628
Comparable net assets 6,147 6,485
Comparable RONA % 12.8 10.8
Gross investments 77 92 260 262 Loviisa, Finland
31Full year 2019 results
City Solutions
Q4 2019 2019
• Positive one-time items • Strong result improvement in
• Norwegian heating and cooling Norwegian heating and cooling
business improved clearly business
• Somewhat weaker performance • Recycling and waste business’
in the recycling and waste result close to level in 2018
business • In 2018, EUR 26 million of profit
from sale of solar stake
Strategy review of selected district heating and cooling businesses
MEUR Q4 2019 Q4 2018 2019 2018
Sales 366 359 1,200 1,110
Comparable EBITDA 129 109 309 310
Comparable operating profit 80 64 121 135
Comparable net assets 3,892 3,794
Comparable RONA % 4.7 5.5
Gross investments 61 85 322 242 Klaipeda, Lithuania
32Full year 2019 results
Consumer Solutions
Q4 2019 2019
• Higher sales margin • Higher sales margins
– Active development of product and • Full synergies of EUR 10 million
service offering from Hafslund integration
• Continued competition with high achieved
customer churn in the Nordics • Improving EBITDA for nine
consecutive quarters
MEUR Q4 2019 Q4 2018 2019 2018
Sales 510 555 1,835 1,759
Comparable EBITDA 35 31 141 110
Comparable operating profit 19 17 79 53
Comparable net assets 640 648
Customer base, million 2.38 2.47
Gross investments 15 14 55 47 Nissan Charge, by Plugsurfing
33Full year 2019 results
Russia
Q4 2019 2019
• Improved result in heat • Higher electricity margins and
business received CSA payments
• Lower available CSA capacity • Lower bad-debt provisions
and electricity volumes due to • FX impact EUR 4 million
unplanned outages
• FX impact EUR 6 million
MEUR Q4 2019 Q4 2018 2019 2018
Sales 306 305 1,071 1,069
Comparable EBITDA 136 127 469 417
Comparable operating profit 94 89 316 271
Comparable net assets 3,205 2,789
Comparable RONA % 12.3 10.3
Gross investments 98 66 133 117
Chelyabinsk, Russia
CSA=Capacity Supply Agreement
34Full year 2019 results
Q4 2019 – strong performance and improved results
Comparable operating profit
EUR
million
• Higher sales • Improved result
• Positive one- in heat business
margins
time effects • Lower
• Norwegian availability of
• 1.0 TWh higher heating and CSA capacity
hydro volumes cooling business and electricity
• 0.2 TWh higher improved clearly volumes
nuclear volumes • Somewhat • FX effect EUR
• 0.4 EUR/MWh weaker 6 million
higher achieved performance in
price recycling and
waste business
35Full year 2019 results
FY 2019 – solid operational performance in all businesses
Comparable operating profit
EUR
,
million
• Higher • Increased
electricity spend on
• EUR 26 million • Higher sales Business
margin
profit from sold margin, part of Technology
• Lower bad-
solar stake improvement including
debt provisions
• Result temporary in internal and
• Higher CSA
• 2.2 EUR/MWh improvement in H1/2019 external
payments
higher Norwegian • Active ventures
• FX effect EUR
achieved price H&C business development 4 million
• 1.2 TWh lower • One-time of product and
hydro volumes effects service
• 0.7 TWh offering
higher nuclear
volume
36Full year 2019 results
Key financials
MEUR Q4 Q4 Full year 2019
2019 2018 2019 2018
• Comparable operating profit supported by
Sales 1,553 1,599 5,447 5,242 good results in Generation and Russia
Comparable EBITDA 552 473 1,766 1,523 • Share of profits from associates driven by
Uniper result contribution
Comparable operating profit 398 333 1,191 987
• Uniper EUR 632 million:
Operating profit 444 309 1,110 1,138 • EUR 160 million underlying result
• EUR 392 million non-operating result
Share of profits of associates • EUR 48 million UK capacity market
and joint ventures 65 -44 744 38
• EUR 31 million reversal of fair value
adjustment
Profit before income taxes 454 261 1,728 1,040 • EPS EUR 1.67 (0.95)
• Items affecting comparability -0.07 (0.15)
Earnings per share, EUR 0.40 0.22 1.67 0.95 • Uniper share of result 0.71 (-)
Net cash from operating • Very strong cash flow
activities 261 38 2,015 804
37Full year 2019 results
Income statement
Q4 Q4
MEUR
2019 2018 2019 2018
Full year 2019
Sales 1,553 1,599 5,447 5,242
• Comparable operating profit +21%
Other income 45 41 110 130
Materials and services -745 -870 -2,721 -2,795 • Reported operating profit impacted by
Employee benefits -125 -119 -480 -459 items affecting comparability, mainly fair
Depreciations and amortisation -154 -139 -575 -536 value changes of derivatives
Other expenses -176 -178 -591 -594
Comparable operating profit 398 333 1,191 987 • Uniper contribution in share of profits,
Items affecting comparability 46 -24 -81 151 EUR 632 (-2) million
Operating profit 444 309 1,110 1,138
Share of profits/loss of associates • Finance costs, net
and joint ventures 65 -44 744 38 • Net interest expenses of EUR 139 (114)
Finance costs - net -55 -4 -125 -136 million impacted by EUR 13 million costs
Profit before income tax 454 261 1,728 1,040 related to repayment of bridge financing
Income tax expense -88 -64 -221 -181 for Uniper investment
Profit for the period 367 197 1,507 858
38Full year 2019 results
Cash flow statement
Q4 Q4 2019 2018
MEUR
2019 2018
Full year 2019
Comparable EBITDA 552 473 1,766 1,523
• Cash flow strengthened due to
Realised FX gains/losses 3 26 14 231
• Improvement in comparable
Paid net financial costs, income taxes and
-73 -62 -327 -341 EBITDA of EUR 243 million
other
• Change in settlements for futures
Dividends received 0 7 239 61
EUR 356 (-524) million
Change in working capital -234 -180 -33 -146 • Dividends received from
Change in settlements for futures 14 -226 356 -524 associates EUR 239 (61) million
Net cash from operating activities 261 38 2,015 804
Capital expenditures -166 -185 -695 -579 • Acquisition of shares in 2018 mainly
Acquisitions of shares -70 -175 -107 -4,088 Uniper
Divestments of shares and capital returns 1 2 53 259
Change in cash collaterals and restricted
• Release of pledged cash from
-9 51 311 -36 collateral arrangement EUR 310
cash
Other investing activities 37 15 69 46 million
Cash flow from investing activities -207 -292 -369 -4,398
Cash flow before financing activities 55 -254 1,646 -3,594
Paid dividends to the owners of the parent 0 0 -977 -977
Paid dividends to non-controlling interests 0 0 -23 -5
39Full year 2019 results
Long-term financial targets achieved
2019 2018 TARGET Total loans of EUR 6,580 million
Comparable EBITDA, MEUR 1,766 1,523 • Average interest of 2.3% (2.4%)
Interest-bearing net debt, MEUR 5,260 5,509 • Portfolio mainly in euros with average
Comparable net debt/EBITDA ratio 1) 3.0x 3.6x Around 2.5x interest cost of 1.6% (1.7%)
Return on capital employed (ROCE), % 10.0 6.7 At least 10% • EUR 787 million (686) swapped to
RUB, average interest cost including
Debt portfolio and average interest rate at end of 2019
2 250 cost for hedging 7.8% (8.3%)
2 000 • Short-term debt includes a new non-
1 750 cash collateral arrangement for the
1 500 Nordic power exchange collaterals and
1 250 settlement
1 000
750
2)
500
250
0
2020 2021 2022 2023 2024 2025 2026 2027 2028 2029+
Bonds Financial institutions Other long-term debt Short-term debt
1) Adjusting the year-end comparable net debt- to- EBITDA with the total consideration of the Joensuu transaction, the leverage target of around 2.5x was achieved in January 2020
40 2) In addition Fortum has received EUR 65 million based on Credit Support Annex agreements with several counterparties. This amount has been booked as a short term liability.Full year 2019 results
Fortum’s key objective is to have a solid investment-grade rating
of at least BBB
• Comparable EBITDA at EUR 1,766 million Fortum’s current rating and outlook
– EPS at EUR 1.67 Rating agency Rating and outlook Valid from
• Strong cash flow from operating activities of EUR Standard & Poor’s BBB, CreditWatch Negative 9 October 2019
2,015 million
Fitch Ratings BBB, Rating Watch Negative 9 October 2019
• ROCE target achieved at 10%
Net debt / EBITDA
• Comparable Net debt/EBITDA at 3.0x (LTM)
3.6x Q4/’18
– Fortum’s long term target of around 2.5x achieved
when adjusting for the divestments of Joensuu
3.3x Q2/’19
district heating and Nordic wind
• Prioritising investments
3.0x Q4/’19
– 2020 capex expected to be ~EUR 700 million,
including ~EUR 200 million of investments in 2.7x Illustrative
renewables subject to capital recycling
2.5x
41Full year 2019 results
Outlook
Demand growth Hedging 2020 estimated Targeted cost Taxation
annual capital synergies of
Electricity demand in the 2020: ~75% at In Sweden, hydro
Nordics is expected to EUR 34 per MWh expenditure, Hafslund assets real estate tax
grow by ~0.5% on (Q3: 70% at EUR 33) transaction rate to decrease over a
of ~EUR 700 million
average including maintenance City Solution synergies four-year period (2017-
2021: ~40% at of ~EUR 300 million and of EUR 5-10 million 2020)
EUR 33 per MWh excluding acquisitions, gradually materialising,
(Q3: 35% at EUR 33) In 2020 ~EUR 15 million
including ~EUR 200 fully by the end of 2020. lower from the 2019
million of investments in level
renewables, subject to Consumer Solutions
capital recycling. synergies of EUR 10
million achieved in 2019
Solberg, Sweden
42Appendices
European and Nordic power markets

Still a highly fragmented Nordic power market
Fortum has the largest electricity customer base in the Nordics
                   Power generation in 2018                                                                                                 Electricity retail
                                   400 TWh                                                                                                16 million customers
                                >350 companies                                                                                              ~350 companies

                                                      Vattenfall
                                                                                                                                     Others                 Fortum

                 Others
                                                                                                                                                                 Vattenfall
                           36%                                       Statkraft                                                          50%
                                                                                                                                                                  E.ON

                                                                                                                                                                 Ørsted
                 BKK
                 Ørsted                    Fortum                                                                                                              Norlys
              Agder Energi                                                                                                                                  Fjordkraft
                 Norsk Hydro         Uniper                                                                                                                 Helen
                           PVO E-CO Energi
                                                                                                                                                            SEAS-NVE
                                                                                                                                                            Din El, Göteborg
                                                                                                                                                            Väre

     Source: Fortum, company data, shares of the largest actors, pro forma 2018 figures
44   Norlys was formed through the merger of the companies SE and Eniig in Denmark
     Väre was formed through the merger of the retail businesses of Savon Voima, Jyväskylän Energia, Kuopion Energia and Lappeenrannan Energia in Finland
European and Nordic power markets
Fortum mid-sized European power generation player
– major producer in global heat
Power generation Heat production Customers
Largest producers in Europe and Russia, 2018 Largest global producers, 2018 Electricity customers in Europe, 2018
TWh TWh Millions
EDF Gazprom Enel
Rosenergoatom T Plus
RWE Sibgenco EDF
Enel Inter RAO UES
Gazprom E.ON
RusHydro Veolia
Inter RAO UES RusHydro Iberdrola
Uniper En+ ENGIE
Vattenfall EDF
ENGIE Fortum DEI
EPH Quadra
NNEGC Energoat. CEZ
Fortum TGC-2
En+ KDHC Vattenfall
PGE Minskenergo
Iberdrola Vattenfall EDP
CEZ PGE Centrica
Statkraft Lukoil
T Plus Tatenergo EnBW
EnBW
Sibgengo PGNiG Tauron
EDP Kyivteploenergo
EPS Ørsted PGE
DTEK EPH SSE
Verbund Stockholm Exergi
Axpo Naturgy
E.ON
SSE
E.ON CEZ Fortum
Naturgy Helen
DEI TGC-14 Ørsted
0 100 200 300 400 500 600 0 20 40 60 80 100 120 140 0 10 20 30 40
Source: Company information, Fortum analyses, 2018 figures pro forma.
45
EPH incl. LEAG, E.ON incl. Innogy customers. No data from China.European and Nordic power markets
Nordic year forwards
Year10 Year11 Year12 Year13 Year14 Year15 Year16 Year17 Year18 Year19 Year20 Year21 Year22
€/MWh 3 February 2020
Year21
70 Year22
36
34
60 32
30
28
50 26
Nov Dec Jan Feb
2019 2019 2020 2020
40
30
20
10
0
2008 2009 2010 2011 2012 2013 2014 2015 2016 2017 2018 2019 2020
46 Source: Nasdaq Commodities, BloombergEuropean and Nordic power markets
German and Nordic forward prices softened
Spot price
• During Q4 2019, the average spread was -2.1 EUR/MWh with the EUR/MWh Nordic and German daily spot prices in Jan 2018 – Feb 2020
Nordic system average price at 38.6 EUR/MWh and the German spot 100
price at 36.6 EUR/MWh. 80
• Declining gas price and slightly below normal demand were weighing 60
on German spot price. Nordic prices were supported by the 40
hydrological deficit and weak wind power output during October and 20
November. 0
• During 2012-2019, the average realised German-Nordic spot spread -20
Q1 Q2 Q3 Q4 Q1 Q2 Q3 Q4
was 3.9 EUR/MWh, fluctuating on an annual level in the range of 2018 2019
-1…15 EUR/MWh. Nordic Germany
EUR/MWh Nordic and German year 2021 forwards in Jan 2018 – Feb 2020
Forward price 60
• During Q4 2019, the spread for 2021 delivery traded in the range
50
10.9-15.8 EUR/MWh, average at 12.5 EUR/MWh. At the end of
40
December, it traded at 11.5 EUR/MWh as the German forwards were
pressured by the weak gas. 30
20
• The German-Nordic spread is essentially determined by the supply-
demand balance in the Nordics and on Continental Europe, in 10
combination with available interconnector capacity. Thus investments in 0 Q1 Q2 Q3 Q4 Q1 Q2 Q3 Q4
interconnectors, demand growth, expansion of renewable capacity, as 2018 2019
well as phasing out of nuclear and coal capacity all play a key role. Nordic Germany
Including 3 February 2020
47 Source: Nord Pool, BloombergEuropean and Nordic power markets
Nordic, Baltic, Continental and UK markets are integrating
– Interconnection capacity growing to over 13 GW by end-2023
• Several interconnectors are currently 1
700 MW COBRAcable from DK to NL has been
under construction or decided to be built Current Nordic/Baltic taken into operation in September 2019
interconnector New 400 MW Zealand – DE connection via
2
• New interconnections will increase the projects Kriegers Flak offshore wind area due in March 2020
Nordic export capacity from the current 6.9 3
EU’s Connecting Europe Facility co-financing 3rd EE-
C LV transmission line, due to be ready by end-2020
GW to over 13 GW by end of 2023
4 DK1-DE capacity will grow by 860 MW by end-
+94% 2020, with further 1,000 MW increase by end-2023
13.4 1,400 MW NordLink as first direct NO-DE link is
B 5
Interconnection capacity (GW)
due to start commercial operation in March 2021
11.0 11.0 Norway - UK 1,400 MW North Sea Link (NSL)
6
6 is due to be ready by end-2021
3 1,400 MW DK-UK Viking Link has been
5 A 7 contracted to be built by end-2023
8.2
6.9 7 8 700 MW LT-PL Harmony Link to be built by 2025
1 9
6.2 as a part of the Baltic synchronisation project
8
4 2 700 MW Hansa PowerBridge DC link between
9
Sweden and Germany by 2026/2027
New interconnectors New Nordic lines
A 1200 MW SE3-SE4 South West Link ready Oct 2020
B 800 MW with first measures on SE2-SE3 by 2023
Existing interconnectors
C 800 MW 3rd 400 kV line SE1-FI ready in 2025
2019 2020 2021 2022 2023 2024 Russia Poland Germany
48 Estonia Netherlands
Years in the chart above refer to a snapshot of 1st of January each year.
Source: Fortum Market Intelligence Lithuania United KingdomEuropean and Nordic power markets
Power Generation in the Baltic Rim in 2018 (2017)
Hydro NORDICS BALTICS
Nuclear
Sweden 2018 TWh % TWh %
Fossil fuel
158 TWh
Biomass (159) Hydro *212 53 3 17
Waste
Wind Finland Nuclear 88 22 - -
67 TWh
Solar
(65) Fossil fuel 28 7 13 62
Others Norway
146 TWh
Biomass 26 6 2 9
(149)
Estonia Waste 3 1 0 1
10 TWh (11)
Wind 40 10 2 9
Denmark
29 TWh (29) Latvia 1 0 0 1
Solar
7 TWh (7)
Others 2 1 0 1
Lithuania
3 TWh (4) Total generation 400 100 20 100
Germany Net export Net import
598 TWh 2 TWh 9 TWh
(602) Poland
157 TWh
(158)
*) Normal annual Nordic hydro generation 200 TWh, variation +/- 40 TWh.
Source: ENTSO-E Statistical Factsheet
49 Graph sizes are illustrative.Fortum’s power generation
Fortum's power and heat production by source
Fortum's power generation in 2019 Fortum's heat production in 2019
Natural gas 37% Natural gas 59%
Total Others 1% Total
Waste1% Nuclear
Wind, solar 1% power generation power Peat 1% heat production
Biomass 1% 76.3 TWh Heat pumps, 26.4 TWh
31%
Coal 3% electricity 2%
Biomass 9%
Waste 10%
Hydropower 26% Coal 18%
Note: Fortum’s power generation capacity 14,230 MW (hydro 4,677, nuclear 2,821, CHP 5,689, condensing 565, wind 194 and solar 285)
and heat production capacity 13,249 MW at the end of 2019
50Fortum’s power generation
Fortum's European power and heat production by source
Fortum's European power generation in 2019 Fortum's European heat production in 2019
Nuclear power 50% Waste 29%
Coal 25%
Natural gas 1% European European
Wind 1% power generation Others 2% heat production
Waste 1% 46.8 TWh 9.1 TWh
Biomass 2% Peat 4%
Coal 2% Heat pumps,
electricity 7%
Natural gas 8%
Hydropower 43% Biomass 25%
Note: Fortum’s European power generation capacity 9,052 MW (hydro 4,677, nuclear 2,821, CHP 831, condensing 565, wind 159)
and heat production capacity 4,812 MW at the end of 2019
51Fortum’s power generation
Fortum’s Nordic, Baltic and Polish generation capacity
GENERATION CAPACITY MW NORWAY MW FINLAND MW
Hydro 4,677 Price areas Hydro 1,553
NO4, Wind 82 Nuclear 1,487
Nuclear 2,821 NO4 SE1
NO1, CHP 20 CHP 452
CHP 831
Generation capacity 102 Other thermal 565
Other thermal 565
Generation capacity 4,057
Wind 159 SE2 FI
NO3
Nordic, Baltic and Polish
generation capacity 9,053 NO5 SWEDEN MW BALTICS AND
NO1
Figures 31 December 2019 POLAND MW
Price areas
NO2 SE3 SE2, Hydro 1,550 Generation capacity, CHP
EE
The capacity includes the 52 MW Joensuu CHP plant SE2, Wind 75 in Estonia 49
in Finland, which has been sold in January 2020.
SE3, Hydro 1,574 in Latvia 34
LV SE3, Nuclear 1,334 in Lithuania 18
DK1 SE4
SE3, CHP 9 in Poland 233
LT
DK2 Generation capacity 4,542
in Latvia, Wind 2
PL
Associated companies’ plants
(not included in the MWs) Stockholm DENMARK, DK1 MW
Exergi (Former Fortum Värme),
Stockholm; TSE, Naantali Generation capacity, CHP 16
52Fortum’s power generation
Fortum is growing towards gigawatt scale target in solar
and wind power generation PORTFOLIO
FINLAND
TECHNOLOGY STATUS CAPACITY
MW
90
FORTUM
SHARE, MW
90
SUPPLY STARTS/
STARTED
Kalax Wind Under construction 90 90 Q1 2021
Ånstadblåheia 50 MW NORWAY 179 179
Nygårdsfjellet Wind Operational 32 32 2006 and 2011
Sørfjord 97 MW Ånstadblåheia Wind Operational 50 50 2018
Sørfjord Wind Under construction 97 97 Q4 2019-Q3 2020
Solberg 75 MW SWEDEN 76 76
Ulyanovsk-2 25 MW Solberg Wind Operational 76 76 2018
Kalax 90 MW
(Fortum share) RUSSIA 2,009 1,098
Bugulchansk Solar Operational 15 15 2016-2017
Nygårdsfjellet Ulyanovsk 35 MW solar power plants
Pleshanovsk Solar Operational 10 10 2017
32 MW 35 MW
Grachevsk Solar Operational 10 10 2017
Solar Under development 110+6 110+6 2021-2022
Ulyanovsk Wind Operational 35 35 2018
Rostov 150 MW Ulyanovsk 2 Wind Operational 50 25 (50%) 1.1.2019
(Fortum share)
Rostov Wind Under construction 100+200 150 (50%) H1 2020
Bhadla 31 MW (Fortum share) Kalmykia Wind Under construction 200 100 (50%) Q4 2020
Kalmykia 100 MW
(Fortum share) Amrit 2 MW (Fortum share) Rostov Wind Under construction 50 25 (50%) Q4 2020
Rusnano JV Wind Under development 1,223 612 (50%) 2018-2023
Kapeli 4 MW (Fortum share) INDIA 685 581
Amrit Solar Operational 5 2 (44%) 2012
Kapeli Solar Operational 10 4 (44%) 2014
First focus markets Bhadla Solar Operational 70 31 (44%) 2017
Pavagada 250+44 MW Pavagada Solar Operational 100 44 (44%) 2017
Operating wind power plants (Fortum share) Pavagada 2 Solar Operational 250 250 Q3 2019
Operating solar power plants Rajasthan Solar Under construction 250 250 Q4 2020
Projects under construction TOTAL 3,039 2,024
Under development 1,339 728
Under construction 987 712
Operational 713 584
53 *) NOTE: Table numbers not accounting; tells the size of renewables projects. All not consolidated to Fortum capacities. All figures in MW and rounded to nearest megawatt. Additionally, target to invest 200 – 400 million
euros in India solar and create partnership for operating assets. Under construction includes investment decisions made.Fortum’s power generation
Fortum’s nuclear fleet
LOVIISA OLKILUOTO OSKARSHAMN FORSMARK
Commercial Unit 1: 1977 Unit 1: 1978 Unit 1: 1972* Unit 1: 1980
operation started Unit 2: 1981 Unit 2: 1980 Unit 2: 1974* Unit 2: 1981
Unit 3: (Under construction) Unit 3: 1985 Unit 3: 1985
Generation Capacity Unit 1: 507 MW Unit 1: 890 MW Unit 1: 473 MW* Unit 1: 988 MW
Unit 2: 507 MW Unit 2: 890 MW Unit 2: 638 MW* Unit 2: 1,118 MW
Total: 1,014 MW (Unit 3: 1,600 MW) Unit 3: 1,400 MW Unit 3: 1,172 MW
Total: 1,780 MW (3,380 MW) Total: 1,400 MW Total: 3,278 MW
Fortum’s share 100% 1,014 MW 27% 473 MW (873 MW) 43% 602 MW 22% 729 MW
Yearly production 8 TWh 15 TWh 11 TWh 25 TWh
Fortum’s share of production 8 TWh 4 TWh 5 TWh 6 TWh
Majority owner Fortum Pohjolan Voima Uniper Vattenfall
Fortum’s share 26.6% 43.4% 22.2%
Operated by Fortum Teollisuuden Voima (TVO) OKG Aktiebolag Forsmarks Kraftgrupp
*Out of operation; on decommissioning phase
RESPONSIBILITIES
Loviisa: Fortum is the owner, licensee and operator with all the responsibilities specified in the Nuclear Energy Act, Nuclear Liability Act, and other relevant nuclear legislation
Other units: Fortum is solely an owner with none of the responsibilities assigned to the licensee in the nuclear legislation. Other responsibilities are specified in the Companies Act and the Articles of Association and are mostly financial.
54Fortum’s power generation
Fortum's nuclear power in the Nordics
LOAD 2005 2006 2007 2008 2009 2010 2011 2012 2013 2014 2015 2016 2017 2018 2019
FACTOR (%)
Oskarshamn 1* 80 51 63 85 68 77 72 1 12 74 60 81 82 0 0
Oskarshamn 2* 90 78 76 86 75 90 77 81 33 0 0 0 0 0 0
Oskarshamn 3 85 95 88 70 17 31 68 69 77 75 79 83 77 87 89
Forsmark 1 85 76 81 88 88 93 79 88 87 94 79 95 88 94 85
Forsmark 2 94 72 85 79 64 38 94 82 89 89 91 75 82 87 86
Olkiluoto
Forsmark 3 95 92 88 69 86 81 85 93 88 83 58 82 86 81 92
Forsmark
Loviisa 1 95 93 94 86 96 93 94 84 92 92 93 88 93 91 93 Loviisa
Loviisa 2 95 88 96 93 95 89 94 91 93 89 92 93 93 85 91
Olkiluoto 1 98 94 97 94 97 92 95 90 97 94 96 91 93 87 97 Oskarshamn
Olkiluoto 2 94 97 94 97 95 95 91 96 93 97 89 94 81 94 92
Source: Fortum
*) Out of operation; on decommissioning phase
Finnish units world class in availability
Overview of production and consumption:
www.fortum.com/investors - energy related links
55Fortum’s Russian capacity and prices
Thermal power generation capacity in Russia on 31 Dec 2019
YEAR SUPPLY POWER FUEL CCS CSA PRODUCTION TOTAL
STARTS PLANT TYPE CAPACITY CAPACITY TYPE CAPACITY
< 2011 Tyumen CHP-2 Gas 755 CHP/Condensing 755
Chelyabinsk CHP-2 Gas, coal 320 CHP/Condensing 320
Argayash CHP Coal 256 CHP/Condensing 256
Chelyabinsk CHP-1 Gas 134 CHP/Condensing 134
2011 Feb/2011 Tyumen CHP-1 Gas 472 210 CHP/Condensing 682
Jun/2011 Chelyabinsk CHP-3 Gas 360 233 CHP/Condensing 593
2013 Apr/2013 Nyagan 1 GRES Gas 453 Condensing 453
Dec/2013 Nyagan 2 GRES Gas 453 Condensing 453
2015 Jan/2015 Nyagan 3 GRES Gas 455 Condensing 455
Dec/2015 Chelyabinsk 1 GRES Gas 247 CHP/Condensing 247
2016 Mar/2016 Chelyabinsk 2 GRES Gas 248 CHP/Condensing 248
2017 Nov/2017 Chelyabinsk 3 GRES Gas 263 CHP/CCGT 263
2,560 MW 2,298 MW 4,858 MW
56Fortum’s Russian capacity and prices
Day ahead wholesale market prices in Russia
Key electricity, capacity and gas prices in the PAO Fortum area
IV/19 IV18 2019 2018
Electricity spot price (market price), Urals hub, RUB/MWh 1,081 1,099 1,117 1,043
Average regulated gas price, Urals region, RUB 1000 m3 3,937 3,883 3,910 3,801
Average capacity price for CCS, tRUB/MW/month 166 158 154 148
Average capacity price for CSA, tRUB/MW/month 1,186 1,196 1,096 1,075
Average capacity price, tRUB/MW/month 684 682 624 609
Achieved power price for Fortum in Russia, RUB/MWh 2,003 1,982 1,990 1,888
Achieved power price for Fortum in Russia, EUR/MWh 28.2 26.0 27.3 25.6
35 1,400
Day ahead
30 1,200
power market prices
for Urals 25 1,000
RUB / MWh
€ / MWh
20 800
15 600
10 400
5 200
Source: ATS
In addition to the power price generators 0 0
receive a capacity payment. 2009 2010 2011 2012 2013 2014 2015 2016 2017 2018 2019 2020 2009 2010 2011 2012 2013 2014 2015 2016 2017 2018 2019 2020
57Historical achieved prices Hedging improves stability and predictability – principles based on risk mitigation 58 2009 onwards thermal and import from Russia excluded
Dividend

Capital returns: 2019 EUR 1.10 per share ~ EUR 1 billion

                                                               Five year history of dividend per share
     Fortum's target is to pay a stable, sustainable,
     and over time increasing dividend of 50-80% of            EUR
       earnings per share excluding one-off items              1,2   1.10     1.10     1.10     1.10         1.10

                                                               1,0
Fortum’s dividend policy is based on the
following preconditions:                                       0,8
• The dividend policy ensures that shareholders receive
  a fair remuneration for their entrusted capital, supported   0,6

  by the company’s long-term strategy that aims at
                                                               0,4
  increasing earnings per share and thereby the dividend.
• When proposing the dividend, the Board of Directors          0,2
  looks at a range of factors, including the macro
  environment, balance sheet strength as well as               0,0
                                                                     2015     2016     2017     2018        2019
  future investment plans.
      Since 1998 Fortum has paid dividends totaling                  24%      196%     112%     116%         66%

                    EUR 16.5 billion
59
Next events:
The AGM 2020 on 17 March 2020
The ex-dividend date 18 March 2020
The CMD planned for 3 December 2020
For more information,
please visit www.fortum.com/investors
To subscribe Fortum's releases, please fill out the subscription form on our website
Fortum Investor Relations and https://www.fortum.com/about-us/media/media-room/subscribe-press-releases
Financial Communications
Ingela Ulfves Rauno Tiihonen Måns Holmberg Pirjo Lifländer Meeting requests:
Vice President, Manager Manager IR Specialist Anna-Elina Perttula
Investor Relations and IR coordinator
Financial Communication
+358 (0)40 515 1531 +358 (0)10 453 6150 +358 (0)44 518 1518 +358 (0)40 643 3317 +358 (0)40 664 0240
ingela.ulfves@fortum.com rauno.tiihonen@fortum.com mans.holmberg@fortum.com pirjo.liflander@fortum.com anna-elina.perttula@partners.fortum.com
Follow us on:
Fortum ForEnergy blog at
www.twitter.com/Fortum www.linkedin.com/company/fortum www.youtube.com/user/fortum
fortumforenergyblog.wordpress.comYou can also read