Fossil Energy Opportunities For West Virginia - Eric Bowen, M.A. Patrick Manzi Tess A. Meinert Tom S. Witt, Ph.D - The Research ...
←
→
Page content transcription
If your browser does not render page correctly, please read the page content below
Fossil Energy Opportunities
     For West Virginia

               Eric Bowen, M.A.

               Patrick Manzi

               Tess A. Meinert

               Tom S. Witt, Ph.D.

                                    i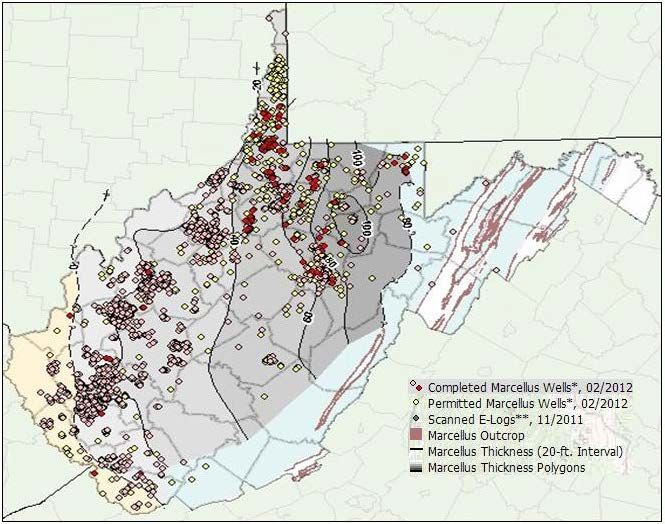
ii
Fossil Energy Opportunities

                                                   For West Virginia

                                                                   By

                                                      Eric Bowen, M.A. 1
                                                        Patrick Manzi 2
                                                       Tess A. Meinert 3
                                                      Tom S. Witt, Ph.D. 4

                                       Bureau of Business and Economic Research
                                          College of Business and Economics
                                               West Virginia University

This draft report was prepared under a contract between the West Virginia University Bureau of Business
and Economic Research and the West Virginia Division of Energy. The opinions herein are those of the
authors and do not necessarily reflect those of the West Virginia University Board of Governors, West
Virginia Higher Education Policy Commission or the West Virginia Division of Energy.

1
  Economist, WVU BBER
2
  Graduate Research Assistant, WVU BBER
3
  Research Assistant I, WVU BBER
4
  Professor of Economics, Emeritus and former director, WVU BBER

                                                                                                     iii
Table of Contents
List of Figures ............................................................................................................................................. vii
List of Tables ............................................................................................................................................. viii
List of Abbreviations ................................................................................................................................... ix
1 Introduction and Overview ................................................................................................................... 1
2 Economic and Energy Outlook Overview ............................................................................................ 3
2.1 United States economic outlook 2012 - 2017 ............................................................................... 3
2.2 West Virginia economic outlook .................................................................................................. 6
2.3 US energy outlook ........................................................................................................................ 7
2.4 Energy production and price forecasts .......................................................................................... 7
2.4.1 Crude oil................................................................................................................................ 7
2.4.2 Natural gas ............................................................................................................................ 8
2.4.3 Coal ....................................................................................................................................... 8
2.4.4 Biofuel................................................................................................................................... 8
2.4.5 Electricity .............................................................................................................................. 8
2.5 End-user consumption................................................................................................................... 8
2.5.1 Transportation ....................................................................................................................... 8
2.5.2 Industrial ............................................................................................................................... 8
2.5.3 Residential............................................................................................................................. 9
2.5.4 Commercial ........................................................................................................................... 9
2.6 Fuel consumption .......................................................................................................................... 9
2.6.1 Total energy consumption..................................................................................................... 9
2.6.2 Total liquid fuels consumption ............................................................................................. 9
2.6.3 Natural gas consumption....................................................................................................... 9
2.6.4 Coal consumption (including coal-to-liquids) ...................................................................... 9
2.6.5 Renewable fuels .................................................................................................................... 9
2.7 Per capita energy consumption ..................................................................................................... 9
2.8 Energy imports ............................................................................................................................ 10
2.9 Key observations ......................................................................................................................... 11
3 Coal ..................................................................................................................................................... 14
3.1 Introduction ................................................................................................................................. 14
3.2 Overview ..................................................................................................................................... 14
3.3 Coal industry trends .................................................................................................................... 15
iv3.4 West Virginia coal industry forecasts ......................................................................................... 23
3.5 Potential new coal markets ......................................................................................................... 27
3.5.1 Waste coal and gob ............................................................................................................. 27
3.5.2 Coalbed methane ................................................................................................................. 28
3.5.3 Coal to liquids ..................................................................................................................... 30
3.6 Key observations ......................................................................................................................... 32
4 Natural Gas and Oil ............................................................................................................................ 33
4.1 Natural gas industry overview .................................................................................................... 33
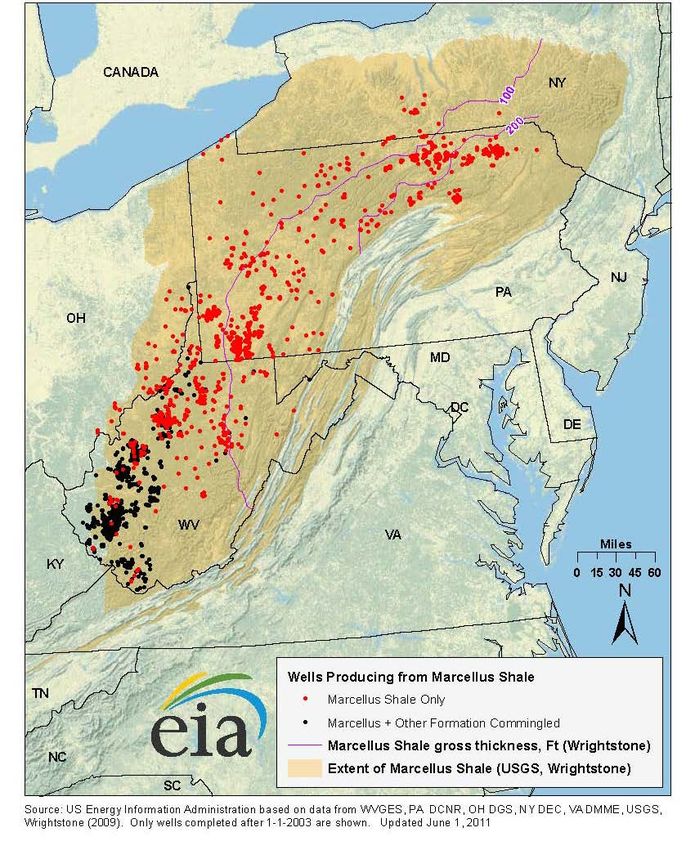
4.2 The Marcellus Shale changed West Virginia’s natural gas industry .......................................... 35
4.3 Natural gas reserves .................................................................................................................... 37
4.4 West Virginia natural gas production and prices ........................................................................ 39
4.5 West Virginia drilling rigs .......................................................................................................... 44
4.6 West Virginia natural gas employment trends ............................................................................ 44
4.7 Consumption and value added opportunities associated with natural gas .................................. 46
4.7.1 Natural gas as a transportation fuel ..................................................................................... 47
4.7.2 Liquefied natural gas for export .......................................................................................... 53
4.7.3 Other value-added opportunities from natural gas .............................................................. 53
4.8 Natural gas pipelines ................................................................................................................... 54
4.9 Storage of natural gas.................................................................................................................. 56
4.10 Oil ............................................................................................................................................... 58
4.10.1 The future of oil shale ......................................................................................................... 62
4.11 Key observations ......................................................................................................................... 63
5 Nuclear ................................................................................................................................................ 64
5.1 Key observations ......................................................................................................................... 64
6 Electric Power ..................................................................................................................................... 65
6.1 Overview of US electric power industry..................................................................................... 65
6.2 Overview of fossil fuel electric power generation in West Virginia........................................... 67
6.3 Trends in coal generation ............................................................................................................ 69
6.3.1 Capacity factors are declining ............................................................................................. 69
6.3.2 Coal stockpiles are increasing ............................................................................................. 69
6.3.3 Plant closures have been announced ................................................................................... 70
6.3.4 New generating capacity moving to natural gas ................................................................. 71
6.4 Environmental policies and implications for the electric power sector ...................................... 72
v6.4.1 Carbon emissions rule ......................................................................................................... 72
6.4.2 Mercury and air toxics standards (MATS).......................................................................... 74
6.5 Carbon reduction technologies.................................................................................................... 74
6.5.1 Carbon capture and storage ................................................................................................. 74
6.5.2 Increased combustion efficiency ......................................................................................... 76
6.6 Key observations ......................................................................................................................... 78
7 Hydrogen Fuels ................................................................................................................................... 79
7.1 Introduction ................................................................................................................................. 79
7.2 Hydrogen production .................................................................................................................. 79
7.2.1 West Virginia ...................................................................................................................... 79
7.2.2 FutureGen ........................................................................................................................... 80
7.3 Primary markets .......................................................................................................................... 80
7.3.1 Transportation ..................................................................................................................... 80
7.3.2 Electricity generation .......................................................................................................... 81
7.3.3 Material handling ................................................................................................................ 81
7.4 Public policies to support hydrogen ............................................................................................ 81
7.5 Future research ............................................................................................................................ 82
7.6 Key observations ......................................................................................................................... 82
8 Bibliography ....................................................................................................................................... 83
viList of Figures
Figure 1: Annual coal production WV and US, 1995-2011........................................................................ 17
Figure 2: Minemouth coal forecast prices (2010 dollars per ton) ............................................................... 17
Figure 3: Annual productivity WV and US, 1992-2010 ............................................................................. 18
Figure 4: WV monthly coal production by region ...................................................................................... 19
Figure 5: Average mine price of WV coal, 1980-2010 ............................................................................... 19
Figure 6: Coal mining employment WV and US (non-seasonally adjusted, in thousands), 1992-2010..... 20
Figure 7: WV gross domestic product by major sector, 2000-2011 ........................................................... 20
Figure 8: Value of WV commodity exports, 1997-2012 ............................................................................ 21
Figure 9: WV consensus forecast coal production, 1990-2030 .................................................................. 25
Figure 10: WV consensus forecast nominal coal prices, 2001-2030 .......................................................... 25
Figure 11: Percent change in central and northern Appalachian coal production: ..................................... 27
Figure 12: Working gas in underground storage compared with historical range, 2010-2012 .................. 30
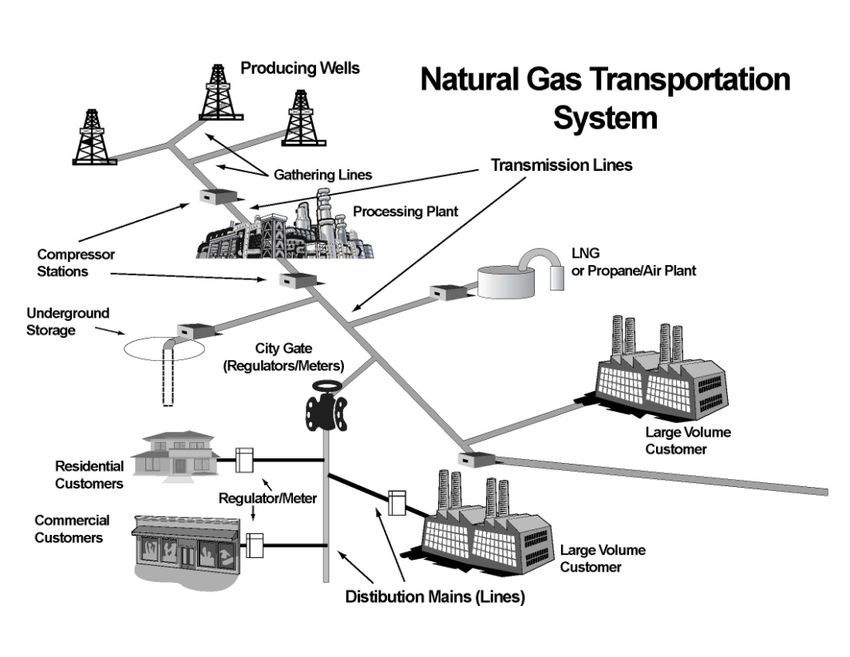
Figure 13: The natural gas industry process ............................................................................................... 35
Figure 14: Marcellus Shale gas play, Appalachian Basin ........................................................................... 36
Figure 15: Marcellus Shale thickness and wells in West Virginia, February 2012 .................................... 37
Figure 16: Proved natural gas reserves, 2000-2009 .................................................................................... 38
Figure 17: Monthly citygate natural gas prices, Jan 2000-April 2012 ........................................................ 42
Figure 18: Natural gas at the wellhead forecast prices (nominal dollars per Mcf), 2009-2035 .................. 43
Figure 19: Natural gas at the wellhead forecast prices (2010 dollars per Mcf), 2009-2035 ....................... 43
Figure 20: Number of rigs and citygate natural gas prices in West Virginia, 2000-2012.......................... 44
Figure 21: West Virginia employment by industry, 2001-2011 ................................................................. 46
Figure 22: West Virginia annual natural gas consumption, 2001-2011...................................................... 47
Figure 23: Weekly oil and natural gas spot prices, 2000-2012 ($/MMBtu) ............................................... 49
Figure 24: West Virginia natural gas state-to-state transmission capacity, 1994-2011 .............................. 56
Figure 25: Annual average natural gas underground storage volume (Mcf) of select states, 2000-2012 ... 57
Figure 26: West Virginia annual crude oil first purchase price, 1992-2011 ............................................... 60
Figure 27: West Virginia crude oil proved reserves, 1977-2009 ................................................................ 61
Figure 28: Annual West Virginia field production of crude oil, 1981-2011............................................... 61
Figure 29: US and West Virginia electricity sales 1990-2010 .................................................................... 66
Figure 30: US Monthly net power generation January 2001 - April 2012 ................................................. 66
Figure 31: Average cost of coal and natural gas for electricity generation................................................. 67
Figure 32: West Virginia power plant net generation (MWH), 2001-2011 ................................................ 69
Figure 33: West Virginia power plant fuel consumption quantity 2001-2011 ........................................... 70
Figure 34: Projected net summer capacity by fuel type, 2009-2035........................................................... 72
viiList of Tables
Table 1: Energy production and consumption, West Virginia 2010............................................................. 1
Table 2: IHS US economic outlook summary forecast March 2012 ............................................................ 5
Table 3: WV employment, labor force, and unemployment rate forecasts................................................. 12
Table 4: Annual energy outlook 2012 summary data ................................................................................. 13
Table 5: US coal production 2010 .............................................................................................................. 15
Table 6: Selected US mining (except oil and gas) ...................................................................................... 15
Table 7: US coal exports, by type and WV share of total (short tons)........................................................ 21
Table 8: Top 10 rankings by value (millions of dollars) and destination of WV coal exports 2008-2011 . 22
Table 9: Top ten WV mineral and ores export destinations........................................................................ 22
Table 10: Top ten WV export industries ranked by value of commodity exports in 2011 (millions of
dollars) ................................................................................................................................................ 23
Table 11: WV coal production and consensus forecast .............................................................................. 26
Table 12: Comparison of coal bed methane and conventional gas reservoir characteristics ...................... 29
Table 13: Proved natural gas reserves by type, 2000-2009 ........................................................................ 39
Table 14: West Virginia natural gas production,consumption, and proved reserves, 2000-2011 .............. 40
Table 15: Natural gas marketed production (MMcf) in select states, 2000-2010 ....................................... 41
Table 16: West Virginia employment by NAICS industry, 2001-2011 ...................................................... 45
Table 17: Annual Average Natural Gas Underground Storage Volume (MMcf) of Select States, 2000-
April 2012 ........................................................................................................................................... 58
Table 18: West Virginia Power Plants Listed by Fuel and Capacity .......................................................... 68
Table 19: CO2 emissions and cost-related capture/storage for different technologies................................ 74
viiiList of Abbreviations
GHGs – greenhouse gases
AEO2012 – Annual Energy Outlook 2012
GW – gigawatt
AEP – American Electric Power Company Inc.
IGCC – integrated gasification combined cycle
AFV – alternative fuel vehicle
IHS – IHS Global Insight
ATV – Advanced technology vehicle
kg – kilogram
BBER – Bureau of Business and Economic
Research kW – kilowatt
Bcf – billion cubic feet LDV – light-duty vehicle
Btu – British thermal unit LNG – liquefied natural gas
CBER – Center for Business and Economic LPG – liquefied petroleum gas
Research
MATS – Mercury and Air Toxics Standards
CCS – Carbon Capture and Storage
mmBtu – million British thermal units
CFB – circulating fluidized bed
MMcf – million cubic feet
CMAQ – Congestion Migration and Air Quality
Improvement program MWh – megawatt hours
CMB – coalbed methane NAFTC – National Alternative Fuels Training
Consortium
CNG – Compressed natural gas
NAICS – North American Industry
CO2 – carbon dioxide Classification System
DEP – WV Department of Environmental NCDC – National clean diesel campaign
Protection
NERC – North American Electric Reliability
DOE – US Department of Energy Corporation
EIA – US Energy Information Administration NETL – National Energy Technology
Laboratory
EOR – Enhanced Oil Recovery
NGCC – natural gas combined cycle
EPA – US Environmental Protection Agency
NGV – Natural gas Vehicle
EVA – Energy Ventures Analysis
NGVA – Natural Gas Vehicles for America
EWV – Ergon West Virginia Inc.
NOx – mono-nitrogen oxide
GDP – Gross Domestic Product
ixOPEC – Organization of Petroleum Exporting Tcf – Trillion cubic feet
Countries
TWh – terawatt hours
SMCRA – Surface Mining Control and
Reclamation Act VALE – voluntary airport low emission program
SO2 – sulfur dioxide WVGES – West Virginia Geological and
Economic Survey
x1 Introduction and Overview
The US Energy Information Administration (hereafter EIA) reports that in 2010 the following production
and consumption data (trillions of Btus) produced, consumed and the difference (exports) in West
Virginia 5, 6:
Table 1: Energy production and
consumption, West Virginia 2010
Energy Production Trillions of Btus
Coal 3,346.1
Natural Gas 283.0
Crude Oil 8.9
Total 3,674.0
Energy Consumption 739.0
Difference -2,935.0
Source: EIA, State Energy Data, 2010
Nearly 80 percent, or 2,935 trillion Btu, of West Virginia’s energy production is exported, second only to
Wyoming, which has 9,998 trillion Btu exported. Thus, West Virginia is a major energy state with this
sector playing a significant role in the state and national economy. With this in mind, the state needs to
ensure that the future growth and development of this sector plays a continuing role in the creation of jobs
and wealth within the state, while at the same time protecting the environment for future generations. The
opportunities to attract new industry, enhance efficiency of existing industries, maintain the affordability
of energy and increase security for energy resources and production are additional goals for state policy
makers.
The West Virginia Division of Energy has commissioned the Center for Business and Economic Research
(CBER) at Marshall University and the Bureau of Business and Economic Research (BBER) at West
Virginia University to assist in the development of its energy policy for submission to the Governor and
the Joint Committee on Government and Finance.7 This policy sets forth a five-year plan for the state’s
energy policies and provides a direction for the private sector. Responsibility for the fossil energy section
was provided to BBER while CBER covers energy efficiency and renewable energy.
This report focuses on the fossil fuels and is divided into the following sections:
US and West Virginia Economic and Energy Outlook
• Coal
• Natural Gas
• Nuclear Energy
• Electric Power
• Hydrogen
5 EIA converts the physical units of the energy source (short tons, mcf, kwh, barrels) into the heat equivalent-BTUs. This data omits biofuels.
6 US Energy Information Administration, "State Energy Data System - State," (2012).
7 See West Virginia code §5B-2F-2.
1• Short-term Development Goals
Each section contains statistics and analysis pertaining to that particular energy source and key
observations relevant to the development of short-term policies.
22 Economic and Energy Outlook Overview
The US and state economic outlooks, coupled with the US energy outlook, will set the stage for the
energy opportunities, options, and strategies identified later in the report. The project team used the IHS
Global Insight (IHS) US Economic Outlook 2012-2017, 8 released in March 2012, as a starting point for
understanding where the national economy is headed. The associated outlook for the West Virginia
economy is based on the West Virginia University Bureau of Business and Economic Research (BBER)
annual economic outlook released in November 2011. Finally, the US energy outlook is based upon the
US Energy Information Administration’s (EIA) Annual Energy Outlook (AEO2012) Early Release
Overview, released in January 2012.
2.1 United States economic outlook 2012 - 2017
A summary of the US economic outlook from IHS in March 2012 is provided in Table 2. While the
likelihood that the United States will relapse into recession is decreasing, the nation is far from fully
recovered from the Great Recession, and certain risk factors remain that could push back economic
recovery. In 2011Q4, the national GDP growth rate was 3.0 percent, but this is expected to slow to 1.9
percent during 2012Q1. The federal budget deficit for FY2011 was $1.3 trillion or 8.7 percent of GDP.
Tighter fiscal policies in 2012 suggest that the budget deficit will decrease to $1.0 trillion. Over the
course of the calendar year, real state and local government spending is expected to decrease by 1.4
percent. There are many fiscal deadlines set for the end of 2012 and beginning of 2013, including the
expiration of the remaining Bush tax cuts, as well as emergency unemployment insurance benefits and a
significant cut in defense spending. This forecast calls for a last-minute bargain in Congress wherein
entitlement spending cuts and tax increases will be phased in over a number of years.
The Federal Reserve Open Market Committee has signaled its intent to keep interest rates low through
2014. Based on its forecast assumptions, IHS does not expect the rate to increase significantly before
2015. Yields on ten-year Treasury bonds should stay between 2.0 and 2.5 percent through the end of
2012, but are expected to increase over the long term. While the dollar is expected to strengthen against
the euro, it will weaken against emerging currencies with the pace dependent upon how quickly China
lets the renminbi appreciate. US export growth is expected to slow from 6.8 percent in 2011 to 4.2 percent
in 2012, making the current account deficit 3.4 percent of GDP (up from 3.1 percent in 2011).
Though payroll employment is increasing, IHS does not expect the unemployment rate to decline
significantly during 2012. During 2011Q4, an average of 245,000 payroll jobs were added each month,
and throughout 2012 job growth is projected to average 190,000 positions per month. Because IHS
expects increases in job availability to attract people back into the labor force, there will be a slow
reduction in the unemployment rate from 8.3 percent in the first two months of 2012 to 8.1 percent by
year’s end.
Consumer spending, though positively impacted by job growth, is rising more slowly than anticipated.
During 2012Q1, consumer spending rose by 1.5 percent on an annualized basis. By the end of 2012, IHS
expects consumer spending growth to reach 1.9 percent on an annualized basis, which is lower than it was
in 2011 (2.2 percent). Certain areas of consumer spending are expected to improve as employment
8
Nariman Behravesh and Nigel Gault, US Economic Outlook 2012-2017: Executive Summary,[Mar. 2012].
3increases; light-vehicle sales are expected to rise as income increases enable consumers to satisfy
demands deferred during the recession. The same is expected to be true of housing starts. As young
people who stayed at home during the recession want to move out, housing starts, especially in the
multifamily segment, are expected to increase in 2012 accompanied by a continued decline in prices.
Despite a more positive outlook, consumer spending is not expected to be a major force behind economic
recovery in 2012.
Growth of business spending on equipment and software slowed to 4.8 percent in 2011Q4, but is
expected by IHS to increase to 7.9 percent on an annualized basis during 2012. Businesses still have to
make a lot of capital equipment repairs and replacements that they deferred during the recession, and will
now have the cash necessary to undertake improvements. Thus, a three percentage point improvement in
capital spending growth is expected by year’s end. Spending growth in the business structures area also
decreased in 2011Q4, but unlike equipment and software spending, significant building spending growth
is not expected until 2013. One factor that will effect business spending in 2012 is the increase in
employment. Labor costs are increasing faster than final demand and productivity, resulting in smaller
profit margins for employers and a slower pace for corporate earnings growth.
Extra focus on rising oil and gasoline prices and international relations with Iran are also particularly
important when looking at US economic outlook for 2012. Average oil price projections for 2012 have
increased by about $12 per barrel from 2011 levels. Though recent gasoline prices have actually fallen,
the national average price of gasoline was expected by IHS to exceed $4 per gallon in the second quarter
of 2012. This projected price increase would have been harmful, according to IHS, decreasing 2012 GDP
growth by 0.1 percent. While current oil and gasoline prices are not high enough to drive the US economy
back into recession, a significant supply disruption would cause serious economic problems. As tensions
over Iran’s nuclear program escalate, so do the risks of oil price increases that could derail global
economic recovery. IHS estimates a 20 percent probability of hostilities in the Persian Gulf, whether they
are accidental or deliberate. The risk premium related to tensions with Iran has increased current oil prices
by $20 to $30 per barrel from a more ‘normal’ level.
4Table 2: IHS US economic outlook summary forecast March 2012
2011 2012 2013 2014 2015 2016 2017
Composition of Real GDP (% change)
Gross Domestic Product 1.7 2.1 2.3 3.4 3.2 2.7 2.5
Total Consumption 2.2 1.9 2.1 2.4 2.3 2.2 2.0
Nonresidential Fixed Investment 8.7 6.6 5.8 7.7 7.1 5.1 4.6
Equipment & Software 10.2 7.9 7.2 7.5 6.1 4.1 4.0
Structures 4.4 3.2 1.8 8.0 9.9 7.9 6.1
Exports 6.8 4.2 7.2 7.6 7.3 6.9 6.7
Federal Government -1.9 -2.0 -3.4 -2.8 -2.0 -1.2 -0.8
State & Local Government -2.3 -1.4 -0.7 0.3 0.7 0.8 0.8
Contribution to Real GDP Growth
Consumption 1.53 1.35 1.48 1.70 1.59 1.57 1.42
Gross Private Domestic Investment 0.59 1.12 0.83 1.54 1.33 0.70 0.59
Nonresidential Fixed Investment 0.83 0.67 0.61 0.83 0.80 0.59 0.54
Equipment & Software 0.71 0.58 0.56 0.61 0.83 0.59 0.54
Structures 0.11 0.09 0.05 0.22 0.29 0.25 0.20
Net Exports 0.06 -0.05 0.34 0.36 0.33 0.45 0.50
Exports 0.87 0.57 1.00 1.11 1.10 1.08 1.07
Government -0.44 -0.33 -0.34 -0.17 -0.06 0.01 0.04
Federal -0.17 -0.17 -0.26 -0.21 -0.11 -0.08 -0.05
State & Local -0.28 -0.17 -0.08 0.03 0.08 0.09 0.09
Other Key Measures
Productivity (%ch) 0.8 0.3 0.9 1.7 1.4 1.5 1.7
Total Industrial Production (%ch) 4.2 4.1 2.8 3.6 3.1 2.6 2.4
Unemployment Rate (%) 9.0 8.2 8.0 7.4 6.7 6.3 6.0
Payroll Employment (%ch) 1.2 1.5 1.5 1.7 1.7 1.5 1.1
Current Account Balance (Bil. $) -471.3 -537.3 -484.1 -469.5 -497.5 -525.1 -507.0
Financial Markets, NSA
Federal Funds Rate (%) 0.10 0.10 0.10 0.11 1.23 3.27 4.00
10-Year Treasury Note Yield (%) 2.79 2.22 2.69 2.91 3.54 4.57 4.88
Exchange Rate, Maj. Trade Partners 0.846 0.871 0.880 0.877 0.867 0.854 0.847
Exchange Rate (%ch) -5.9 3.1 1.0 -0.3 -1.2 -1.5 -0.9
Incomes
Personal Income (%ch) 5.1 3.7 3.9 4.9 4.9 4.8 4.4
Real Disposable Income (%ch) 1.3 1.2 1.6 2.9 2.7 2.7 2.4
Saving Rate (%) 4.7 4.2 3.7 4.1 4.5 4.8 5.0
After-tax Profits (Bil. $) 1476 1494 1601 1689 1620 1556 1508
Billions of Chained 2005 Dollars
Real GDP 13315.3 13593.4 13908.3 14384.5 14844.5 15249.4 15636.9
Personal Consumption Expenditures 9421.7 9600.3 9800.2 10033.7 10259.8 10490.3 10704.3
Fuel Oil & Other Fuels 14.9 14.6 14.6 14.5 14.5 14.5 14.4
Nonresidential Fixed Investment 1433.4 1527.9 1616.6 1740.6 1864.2 1959.6 2050.1
Equipment & Software 1123.8 1212.4 1300.3 1398.3 1483.9 1544.7 1607.1
Structures 322.8 333 338.9 366.2 402.4 434.1 460.4
Exports 1775.9 1849.7 1982 2133.1 2288.7 2446.7 2610
Imports 2187.9 2264.5 2347 2443.2 2544.8 2629.8 2711.3
Government Purchases 2502.4 2461 2418 2395.4 2388.1 2388.8 2394.3
Federal 1055 1033.6 998.9 970.8 951.7 939.9 932.2
State & Local 1453.5 1433.1 1423.6 1427.8 1438.3 1449.9 1462.2
Source: IHS Global Insight, US Economic Outlook 2012-2017: Executive Summary Table
52.2 West Virginia economic outlook
The economic outlook for West Virginia was released by BBER in November 2011 and covers the period
2011 to 2016 . 9 BBER’s forecast was based on IHS’s September 2011 forecasts and thus does not reflect
any revisions since that time. Table 3 presents a summary of this forecast. Table 4 summarizes key
elements of that forecast.
The West Virginia economy has recovered from the recent recession but is still below its peak
employment levels. Between 2009Q4 and 2011Q2, the state gained back about one half of the jobs lost
during the recession, averaging a slightly faster rate of job growth than the nation. The state
unemployment rate peaked at 9.7 percent of the labor force in December 2010, and decreased to 8.5
percent by mid-2011, which was lower than the national rate though still significantly higher than pre-
recession unemployment (4.2 percent in 2008).
State coal production during the first half of 2011 was up 1.3 percent from the previous year. The
northern coal fields accounted for most of the growth (8.0 percent), while the southern fields decreased
production. Coal production growth is attributed to increasing demand for steam and metallurgical coal
from the nation and across the globe. Increased global demand has raised prices for Northern and Central
Appalachian coals, which are $10 to $20 above what they were in 2010. Natural gas production in West
Virginia has also increased (40.9 percent between 2003 and 2009), primarily due to the development of
Marcellus shale.
The state population increased by 46,952 residents between 2000 and 2010, an average of 0.3 percent per
year, which was significantly lower than the national average (0.9 percent). Per capita personal income
reached $31,999 in 2010, before adjusting for inflation, which represented a 3.0 percent growth rate since
2009. This was higher than the national rate and the inflation rate – the West Virginia standard of living
improved in 2010.
Real state GDP growth sped up in 2010, surpassing the national growth rate and the growths rates of all
except four other states. Over the past three years, West Virginia real GDP has been growing faster than
the nation’s real GDP due to gains in sectors including mining; real estate, rental, and leasing;
manufacturing; and retail trade, as well as other sectors.
Job growth is expected to be positive in the state between 2011 and 2016, though at a slower rate than
national job growth. Natural resources and mining job growth is expected to slow over this time due to
declining coal production and increasing regulations on air and water quality. This should be somewhat
offset by gains in oil and gas mining employment as Marcellus shale development plays a bigger part in
the West Virginia economy. Job growth in the construction and manufacturing sectors is expected to be
positive, but the major growth will take place in the service-providing sectors: health care; professional
and business services; and trade, transportation, and utilities. Employment in the government sector is
expected to decline as state, local, and federal budgets tighten.
The overall positive job growth in the state will contribute to a gradual decline in the West Virginia
unemployment rate between 2011 and 2016. The state unemployment rate should fall to 6.4 percent in
2016. Job growth will also result in income growth for the state. The real per capita income growth rate is
9
George W. Hammond, West Virginia Economic Outlook 2012 (Morgantown WV: Bureau of Business and Economic Research, West Virginia
University, 2011).
6expected to be 1.8 percent, which is higher than the expected national rate. Because the job growth rate is
above the national average, West Virginia can also expect an influx of residents and job seekers.
The positive growth expected between 2011 and 2016 is fragile. West Virginia’s growth depends on the
growth of its trading partners—a downturn in the national or global economies could easily push West
Virginia back into recession. There are also internal risks related to the demand for and regulation of the
production of coal and natural gas. Environmental regulations pose limitations to the exploration and
development of Marcellus shale plays in the state, and overall production depends on national and
international demand. While the health care sector is expected to be a significant source of job growth
over the forecast period, actual employment increases depend on the continued funding of the Medicaid
and Medicare programs, an issue that is still under consideration. The leisure and hospitality sector has
been contributing significantly to job growth in the state, primarily due to increases in the gaming
industry, but even this industry faces stiff competition from neighboring states.
2.3 US energy outlook
In January 2012, the EIA released its annual US energy outlook summary (AEO2012), which primarily
covers 2010 through 2035. 10 The complete outlook report was released in June 2012 . 11 The EIA’s
reference case assumes that the laws and regulations in place at the time of publication will remain in
effect over the projection period, unless they have specific sunset dates. There are a few exceptions to this
rule throughout the report and they are openly noted. Also, the economic assumptions made in AEO2012
do not account for short-term fluctuations.
When projecting energy prices, consumption, production, generation, etc., one must consider the state of
the nation’s economy. National recovery from the Great Recession is expected to happen more slowly
than any other recessional recovery since 1960. The resulting slower rates of employment and income
recovery will have an effect on the US energy outlook for the next 25 years. Table 4 presents a summary
of the key forecast values in 2025 and 2035.
2.4 Energy production and price forecasts
2.4.1 Crude oil
Prices averaged between $85 and $110 per barrel in 2011, and the AEO2012 puts the 2016 price at $120
per barrel. By 2035, the price is projected to rise to $145 (2010 dollars) or $230 nominal dollars. This
price increase is the result of expected pipeline capacity increases, world economic recovery, and global
demand growth outpacing the supply available from non-Organization of the Petroleum Exporting
Countries (OPEC)-producers. The AEO2012 also assumes that these non-OPEC producers have
significant potential to produce a lot of liquid fuels in the long-term, due to high oil prices and more
infrastructure and investment in exploration and drilling. Upon delivery to the transportation industry,
motor gasoline and diesel had real prices of $2.76 and $3.00 per gallon respectively in 2010. The
AEO2012 has marked these figures up to $4.09 and $4.49 (2010 dollars) per gallon for 2035. Diesel
prices are expected to stay above gasoline prices on average, due to higher demand for the former fuel.
10
US Energy Information Administration, "Annual Energy Outlook 2012 Early Release," (2012).
11
US Energy Information Administration, Annual Energy Outlook 2012,[2012b].
72.4.2 Natural gas
Production is expected to increase, but prices will stay below $5 Mcf (2010 dollars) until 2024, as the
industry develops wells in shale basins across the nation. Drilling levels should remain high partly due to
high oil prices, because drilling into many, but not all, shale formations yields both natural gas and crude
oil. Prices for natural gas are expected to increase beginning in 2024, reaching $6.52 Mcf (2010 dollars)
in 2035, as domestic demand increases and external US supplies dwindle.
2.4.3 Coal
Prices at the mine mouth are expected to increase by 1.4 percent per year resulting in an increase of $1.76
per million Btu in 2010 to $2.51 per million Btu in 2035 (2010 dollars). This price increase reflects a
higher cost of production, as coal companies mine reserves that are more costly to reach.
2.4.4 Biofuel
Consumption is expected to become increasingly important over the projection period, even though
challenges remain in the marketplace for certain types of biofuel. Ethanol must be below a certain
saturation level to be used in the gasoline pool. Until consumer demand and infrastructure adjust to
energy price changes, it will take more time for the volumes of ethanol above the saturation level to reach
the market. The EIA suggests that by 2035 biofuels will replace 600,000 barrels/day of other liquid fuels,
like gasoline and diesel.
2.4.5 Electricity
Real average delivered electricity prices are expected to decline from 9.8 cents per kilowatt hour in 2010
to 9.2 cents in 2019. The decline results from natural gas prices remaining relatively low, resulting in fuel
switching from coal to natural gas at electric generation plants. These plants often have the lowest cost
and thus set the wholesale price of electricity. By 2035, the EIA expects electricity prices to rise to 9.5
cents per kilowatt hour based on rising natural gas prices as demand increases in the power sector for
natural gas-fired generation.
2.5 End-user consumption
2.5.1 Transportation
This sector is expected to consume an increasing amount of energy over the projection period, from 27.6
quadrillion Btu in 2010 to 28.8 quadrillion Btu in 2035. This consumption can be broken down into light-
duty vehicle (LDV) consumption and heavy truck consumption. LDV energy consumption is expected to
decline over the first 15 years of the projection, primarily due to improvements in gas mileage for
highway vehicles, but also to fewer miles traveled due to lower economic growth and employment rates.
LDV energy consumption should increase after 2025, though it is not expected to exceed the 2010
consumption level. Where heavy trucks are concerned, the EIA projects an overall increase in energy
demand.
2.5.2 Industrial
In 2010, this sector accounted for about one-third of all the energy consumed in the United States. The
AEO2012 projects an increase of 16 percent from 2010 (23.4 quadrillion Btu) to 2035 (27.0 quadrillion
Btu). In 2010, the bulk chemicals industry held the largest percentage of energy consumption in the
industrial sector, but the EIA expects the refining industry to hold this title by 2026.
82.5.3 Residential
Delivered energy consumption in the residential sector is expected to increase from 11.7 quadrillion Btu
in 2010 to 12.0 quadrillion Btu in 2035. The EIA suggests that some natural gas and petroleum
consumption in this sector will be transferred to electricity consumption, with consumption of the latter
outpacing natural gas consumption before 2035.
2.5.4 Commercial
The EIA expects the commercial sector’s energy consumption to grow at a fairly slow rate, about one
percent per year, which is on par with the growth rate of commercial floor area. Commercial energy
consumption was 8.7 quadrillion Btu in 2010, while the forecast puts it at 10.3 quadrillion Btu in 2035.
2.6 Fuel consumption
2.6.1 Total energy consumption
The EIA reports that in 2010 total primary energy consumption was 98.2 quadrillion Btu and is expected
to reach 108.0 quadrillion Btu by 2035. Fossil fuels will make up a smaller percentage of total energy
demand in the US by the end of the same period, shrinking from 83 percent in 2010 to 77 percent in 2035.
2.6.2 Total liquid fuels consumption
This is expected to increase from 19.2 million barrels per day in 2010 to 20.1 million barrels per day in
2035. The transportation sector represents the greatest share of demand for liquid fuels over the projection
period, though its share only increases by one percent during the twenty-five year timeframe.
2.6.3 Natural gas consumption
This is expected to increase from 24.1 trillion cubic feet in 2010 to 26.5 trillion in 2035, according to the
AEO2012. A large part of this growth is due to increased demand for natural gas to be used for electricity
production.
2.6.4 Coal consumption (including coal-to-liquids)
The EIA forecasts an increase from 1,051 million short tons in 2010 to 1,155 million short tons in 2035.
Most of the coal consumption will be directed toward electricity generation and will slow down through
2015, when some of the coal-capacity begins to be retired. After 2015, however, coal-fired electricity
generation increases as production depends more on the smaller number of plants.
2.6.5 Renewable fuels
The EIA forecasts total marketed renewable fuels consumption growing at a rate of 2.8 percent per year
between 2010 and 2035. This growth is thought to be the result of federal and state programs that
encourage and regulate the use of renewable fuels such as wood, biomass, municipal waste,
hydroelectricity, geothermal, ethanol, solar, and wind. Renewable energy sources, apart from
hydroelectricity, are expected to make up an increasing share of electric power generation, from 1.4
quadrillion Btu in 2010 to 3.4 quadrillion in 2035. The majority of this growth will come from wind and
biomass energy.
2.7 Per capita energy consumption
According to the EIA, per capita energy consumption will decrease over the projection period due to
increased electricity efficiency, as well as the slow economic recovery from the Great Recession. Even
9though the nation’s population is expected to increase by one-fourth over the twenty-five year period,
energy use only grows by ten percent, resulting in a decline in per capita usage at an annual rate of 0.5
percent on average between 2010 and 2035. Energy usage per dollar of GDP will also decrease, as will
CO2 emissions per dollar of GDP.
2.8 Energy imports
Over the projection period, the nation’s net energy imports decline in both percentage of imports and
absolute volume. Increased domestic production, rising prices, increased efficiency standards, and
decreased demand are responsible for this change. While net import share of total energy consumption in
the US was 22 percent in 2010, by 2035 it drops off to 13 percent.
Other key results in the EIA’s AEO2012 include:
• Domestic crude oil production was 5.5 million barrels per day in 2010 and is expected to increase
to 6.7 million in 2020. A slight decline takes oil production down to 6.1 million barrels per day
by 2035.
• United States dependence on liquid fuels from outside sources continues to decline due to
increased domestic oil and biofuel production, as well as falling demand for transportation fuels.
Liquid fuel, as a share of national imports, continues to decline from 50 percent in 2010 to 37
percent in 2035.
• Recoverable resources of the nation’s shale gas are estimated to be 482 trillion cubic feet. About
84 trillion cubic feet of this is from the Marcellus shale plays and another 16 trillion is from Utica
plays in the Northeast. In 2016, the nation emerges as a net exporter of liquefied natural gas
(LNG), initially exporting 1.1 billion cubic feet per day that year. By 2021, the United States
should become a net exporter of all natural gas products, adding on the distinction of being a
pipeline exporter in 2025. Imports from Canada will decrease by 62 percent, and exports to
Mexico will increase by 440 percent.
• Coal is still the primary fuel used for electricity generation in the United States. Between 2010
and 2035, domestic coal production grows by an average rate of 0.3 percent per year, starting at
1,084 million short tons and reaching 1,188 million in the last year of the projection. Western
mines account for most of this production increase and represent a growing share of coal
production in the United States. In 2010, western mines held 47 percent of domestic coal
production, but that figure is expected to increase to 56 percent by 2035. Coal production in
Appalachia represents a decreasing share of domestic production over the forecasting period, and
the middle of the nation holds a steady share, though production in that region increases overall
between 2010 and 2035. The EIA estimates that 93 percent of total national coal consumption is
by electricity generation; by 2035, the electricity sector should consume about 19.6 quadrillion
Btu of coal.
• Total electricity consumption is expected to increase from 3,879 billion kilowatt hours in 2010 to
4,775 billion in 2035, with an average annual increase of 0.8 percent. While coal remains the
primary source for electricity generation, its share of total production declines as natural gas and
nuclear power become more prominent. Renewable energy represents a large part of overall
growth in electricity generation over the projection period.
• The nation’s CO2 emissions related to energy consumption increased by about four percent in
2010. Between 2005 and 2035, the EIA estimates that CO2 emissions per capita drop by one
10percent per year on average. This is because of new regulations and increased fuel prices that will
shift production away from coal-fired practices toward lower carbon fuels.
• Between 2010 and 2035, the electricity-related CO2 emissions will increase by 4.9 percent, and
transportation-related emissions are expected to slow compared to their pre-recession levels.
Overall CO2 emissions are 3 percent higher than 2010 levels by the end of the projection period,
and the carbon intensity of national energy consumption is expected to have fallen. The EIA
anticipates energy-related CO2 emissions per dollar of GDP to drop by 45 percent over the 25
year span.
2.9 Key observations
• Since the release of the national state and energy outlooks cited above by IHS Global Insights,
EIA and BBER, international and national economic forecasts continue to point towards much
slower economic growth than was experienced in the 1990s and early part of this century.
Continued deterioration in the European economy and slowdowns in Asian economies may
jeopardize economic growth in the US. The looming ‘fiscal cliff’ facing Congress after the
elections has resulted in a reduction in current domestic investment and consumption and could
result in the US economy tipping back into recession.
• Since increases in energy demand are driven by economic growth, the energy forecasts could be
too optimistic if the economy continues to languish. This could affect the levels of production of
various fossil fuels nationally as well as the energy demands by the various consumption sectors.
11Table 3: WV employment, labor force, and unemployment rate forecasts
Indicator Actual Forecast
2010 2011 2012 2013 2014 2015 2016
Total Jobs 692.0 698.4 702.3 706.7 714.5 724.4 734.9
Goods Producing 112.8 116.6 116.7 117.1 120.2 124.5 127.3
Natural Resources & Mining 31.1 34.4 35.1 34.9 34.9 35.0 35.3
Mining 29.3 32.8 33.5 33.4 33.4 33.5 33.9
Coal Mining 20.5 22.7 22.4 21.7 21.3 21.1 21.1
Other Mining 8.8 10.1 11.1 11.7 12.1 12.4 12.8
Natural Resources 1.8 1.6 1.6 1.5 1.5 1.5 1.4
Construction 32.7 32.7 31.9 32.1 34.7 37.9 39.9
Manufacturing 49.1 49.4 49.7 50.0 50.7 51.6 52.1
Durable Manufacturing 29.6 30 30.6 31.3 32.3 33.3 34.0
Wood Products 6.5 6.5 6.6 7.1 7.9 8.6 9.0
Nonmetallic Minerals 3.1 2.8 2.7 2.6 2.7 2.7 2.8
Primary Metals 4.7 4.8 5.0 4.9 4.8 4.8 4.7
Fabricated Metals 5.8 6.0 6.0 6.0 6.1 6.2 6.3
Transportation Equipment 4.4 4.5 4.7 5.0 5.3 5.5 5.5
Other Durables 5.2 5.4 5.5 5.6 5.5 5.6 5.6
Non-Durable Manufacturing 19.5 19.4 19.0 18.7 18.4 18.2 18.1
Food Products 3.4 3.4 3.3 3.2 3.2 3.2 3.1
Chemicals 9.4 9.3 9.2 9.2 9.1 9.2 9.3
Plastics & Rubber 3.3 3.4 3.4 3.4 3.3 3.3 3.3
Other Non-Durables 3.4 3.3 3.1 2.9 2.7 2.6 2.4
Service Producing 579.2 581.8 585.6 589.7 594.2 600.0 607.6
Trade, Transportation, & Utilities 131.4 132.7 134.4 135.9 136.2 137.2 138.1
Wholesale Trade 23.0 23 23.4 23.6 23.9 24.2 24.5
Retail Trade 86.6 87.7 89.0 90.3 90.3 90.7 91.0
Utilities 5.6 5.5 5.6 5.6 5.6 5.7 5.9
Transportation & Warehousing 16.2 16.5 16.4 16.4 16.4 16.5 16.7
Information 10.3 10.7 10.8 10.8 10.9 11.1 11.2
Financial Activities 26.4 26 25.6 25.6 25.7 26.0 26.2
Professional & Business Services 60.4 61.8 61.3 61.9 64.4 67.1 69.6
Educational & Health Services 115.2 117.1 120.0 121.6 123.6 125.5 129.3
Educational Services 5.5 5.6 5.5 5.4 5.2 5.1 5.0
Health Care & Social Assistance 109.7 111.4 114.5 116.2 118.4 120.3 124.3
Leisure & Hospitality 72.1 71.4 72.2 72.6 72.5 72.6 72.8
Other Services 20.7 20.6 20.4 20.3 20.3 20.2 20.2
Government 142.6 141.4 141.0 141.1 140.7 140.3 140.3
Federal Civilian 24.4 23.5 23.5 23.6 23.4 23.2 23.2
State & Local 118.3 117.9 117.6 117.5 117.3 117.2 117.1
Labor Force 782.2 781.2 781.5 782.7 783.3 783.8 785.3
Employed 711.1 712.1 713.5 717.3 722.5 728.5 734.8
Unemployment Rate (%) 9.1 8.8 8.7 8.4 7.8 7.1 6.4
Data are measured in Thousands.
*These columns contain the average yearly change during the 2010-2016 period
**Beginning with the West Virginia Economic Outlook 2008, employment is measured by covered employment (ES-202).
12Table 4: Annual energy outlook 2012 summary data
Energy and economic factors 2010 2025 2035
Primary energy production (quadrillion Btu)
Petroleum 14.37 17.48 16.81
Dry natural gas 22.10 26.63 28.51
Coal 22.08 22.51 23.51
Nuclear Power 8.44 9.60 9.35
Hydropower 2.51 2.97 3.06
Biomass 4.05 6.73 9.68
Other renewable energy 1.34 2.13 2.80
Other 0.64 0.76 0.88
Total 75.52 88.79 94.59
Net imports (quadrillion Btu)
Liquid fuelsa 20.35 16.33 16.22
Natural gas 2.66 -0.81 -1.39
Coal/other (- indicates export) -1.58 -1.44 -1.29
Total 21.43 14.08 13.54
Consumption (quadrillion Btu)
Liquid fuelsa 37.25 37.04 38.00
Natural gas 24.71 25.80 27.11
Coal 20.76 20.60 21.57
Nuclear power 8.44 9.60 9.35
Hydropower 2.51 2.97 3.06
Biomass 2.88 4.52 5.85
Other renewable energy 1.34 2.13 2.80
Net electricity imports 0.29 0.28 0.24
Total 98.16 107.95 107.97
Liquid fuels (million barrels per day)
Domestic crude oil production 5.47 6.42 6.12
Other domestic production 6.42 5.71 6.66
Net imports 9.53 7.39 7.36
Consumption 19.17 19.46 20.08
Natural gas (trillion cubic feet)
Dry gas production + supplemental 21.65 26.07 27.90
Net imports 2.58 -0.84 -1.43
Consumption 24.13 25.20 26.48
Coal (million short tons)
Production 1,098 1,202 1,204
Net imports -64 -19 -49
Consumption 1,051 1,182 1,155
Prices (2010 dollars)
Imported low-sulfur, light crude oil ($/barrel) 79.39 132.50 144.56
Imported crude oil ($/barrel) 75.87 121.23 132.69
Domestic natural gas at wellhead ($/thou. ft3) 4.16 5.23 6.52
Domestic coal at minemouth ($/short ton) 35.61 43.87 49.24
Average electricity price (cents/kilowatt hour) 9.8 9.3 9.5
Economic indicators
Real GDP (billion 2005 dollars) 13,088 19,176 24,639
GDP chain-type price index (2005 = 1.000) 1.110 1.459 1.762
Real disposable personal income (bil. 2005 dollars) 10,062 14,474 18,252
Value of manufacturing shipments (bil. 2005 dollars) 4,260 5,735 6,270
Primary energy intensity (thou. Btu/2005 dollar of 7.50 5.37 4.38
GDP)
Carbon dioxide emissions (million metric tons) 5,634 5,618 5,806
a
Includes petroleum-derived and non-petroleum derived fuels and petroleum coke, which is
Source: US EIA AEO2012 National Energy Modeling System.
13You can also read