FOUR CORNERS PROPERTY TRUST - NYSE: FCPT
←
→
Page content transcription
If your browser does not render page correctly, please read the page content below
FOUR CORNERS PROPERTY TRUST
        NYSE: FCPT

  I N V E S T O R P R E S E N T AT I O N | S E P T E M B E R 2 0 1 8   www.fcpt.com

1 | FCPT | SEPTEMBER 2018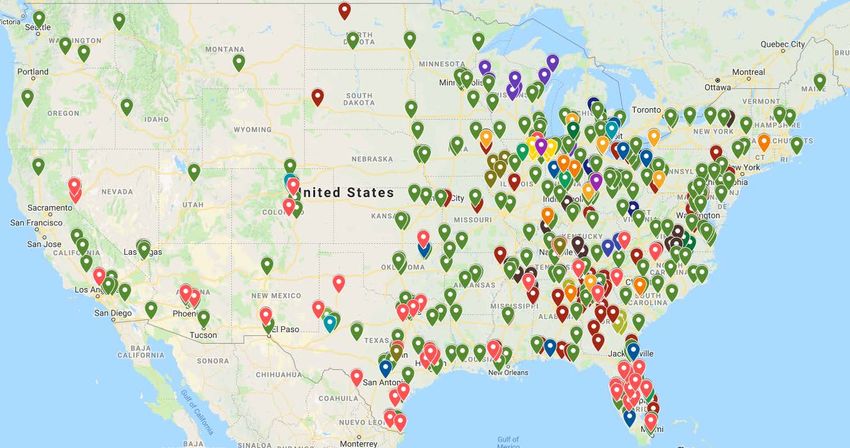
FORWARD LOOKING STATEMENTS
AND DISCLAIMERS

Cautionary Note Regarding Forward-Looking Statements:
This presentation contains forward-looking statements within the meaning of the federal securities laws. Forward-looking statements include all
statements that are not historical statements of fact and those regarding the Company’s intent, belief or expectations, including, but not limited
to, statements regarding: operating and financial performance; expectations regarding the making of distributions and the payment of dividends;
capital resources; and pending acquisitions. Words such as “anticipate(s),” “expect(s),” “intend(s),” “plan(s),” “believe(s),” “may,” “will,” “would,”
“could,” “should,” “seek(s)” and similar expressions, or the negative of these terms, are intended to identify such forward-looking statements.
Forward-looking statements speak only as of the date on which such statements are made and, except in the normal course of the Company’s
public disclosure obligations, the Company expressly disclaims any obligation to publicly release any updates or revisions to any forward-
looking statements to reflect any change in the Company’s expectations or any change in events, conditions or circumstances on which any
statement is based. Forward-looking statements are based on management’s current expectations and beliefs and the Company can give no
assurance that its expectations or the events described will occur as described. Forward-looking statements are subject to a number of risks
and uncertainties that could cause actual results to differ materially from those set forth in or implied by such forward-looking statements. For a
further discussion of these and other factors that could cause the Company’s future results to differ materially from any forward-looking
statements, see the section entitled “Risk Factors” in the Company’s annual report on Form 10-K for the year ended December 31, 2017, and
other risks described in these documents and in other documents filed by the Company from time to time with the Securities and Exchange
Commission.

Notice Regarding Non-GAAP Financial Measures:
The information in this communication contains and refer to certain non-GAAP financial measures, including FFO and AFFO. These non-GAAP
financial measures are in addition to, not a substitute for or superior to, measures of financial performance prepared in accordance with GAAP.
These non-GAAP financial measures should not be considered replacements for, and should be read together with, the most comparable GAAP
financial measures. Reconciliations to the most directly comparable GAAP financial measures and statements of why management believes
these measures are useful to investors are included in the supplemental financial and operating report, which can be found in the investor
relations section of our website at www.fcpt.com.

2 | FCPT | SEPTEMBER 2018
AGENDA

 Company Overview and Business Update      Page 3

 Key Investment Highlights                Page 11

 Acquisition & Diversification Strategy   Page 18

 Appendix                                 Page 27

3 | FCPT | SEPTEMBER 2018
SENIOR MANAGEMENT TEAM
Former Board member and Chair of the Finance and Real Estate Committee at Darden Restaurants, Inc.
Member of the Board of Directors of Macy’s, Inc.
Former Board member and Chairman of the Investment Committee at Gramercy Property Trust, Inc.
William Lenehan
President and CEO Former CEO of Granite REIT, an investment grade single-tenant, triple-net REIT listed on the TSX
Ten years at Farallon Capital Management
B.A. from Claremont McKenna College
Former CFO of Amstar, served on Amstar’s Executive and Investment Committees
Former Managing Director of Financial Strategy & Planning at Prologis, Inc.
Former President and CFO of American Residential Communities
Gerald Morgan Served as a Senior Officer with Archstone prior to the company’s sale
CFO
Former consultant at Bain & Co.
B.S. in Mechanical Engineering and MBA from Stanford University
Former Partner in the real estate department at the law firm of Pircher, Nichols & Meeks where he had
practiced since 1998
B.A. from Macalester College
James Brat Juris Doctorate from the UCLA School of Law
General Counsel
4 | FCPT | SEPTEMBER 2018
OVERVIEW OF FCPT
Four Corners Property Trust (“FCPT”) is an investment grade rated REIT FCPT Portfolio Brands
Property
primarily engaged in the ownership, acquisition, and leasing of restaurant Brand Count % of ABR
Olive Garden 299 59.4%
properties Longhorn Steakhouse 105 16.1%
Chili's 50 8.4%
FCPT’s portfolio has 589 properties, diversified by geography and brand, Bahama Breeze 9 2.4%
Bob Evans 16 2.1%
417 of which are leased to Darden under long-term triple-net leases Buffalo Wild Wings 9 1.3%
Red Lobster 7 1.2%
FCPT began with five Darden-operated restaurant brands at spin-off and Seasons 52 2 0.6%
has since added 26 brands to its portfolio Wildfish 1 0.3%
Steak N' Shake 3 0.3%
Cheddar's 1 0.1%
Portfolio tenancy is 79% investment grade with positive operating trends, Denny's 1 0.1%
fulsome public disclosure, and strong rent coverage BJ's Restaurant 1 0.1%
Casual / Family Dining 504 92.4%
FCPT’s strategy is to grow and diversify the portfolio through acquisitions Burger King 21 2.4%
KFC 20 1.4%
and sale-leasebacks Arby's 8 0.7%
Taco Bell 6 0.5%
o FCPT closed its largest acquisition to date on 8/8/2018 ($156 million McAlister's Deli 4 0.5%
Hardee's 4 0.4%
sale-leaseback transaction with Brinker International consisting of 48 Pizza Hut 6 0.3%
Chili’s properties1,2) Wendy's 3 0.3%
Popeyes 2 0.2%
Starbucks 2 0.2%
Low leverage and flexible unsecured capital structure to support
Mod Pizza / Del Taco4 1 0.2%
diversification strategy McDonald's 2 0.2%
Zaxby's 1 0.1%
Scaled platform with equity market capitalization of $1.7 billion and a total Chick-fil-A 1 0.1%
Panera Bread 1 0.1%
market capitalization of $2.3 billion3 Panda Express 1 0.1%
___________________
Figures as of 9/21/2018
Fazoli's 1 0.1%
1. On 8/8/2018, FCPT closed on 46 of the 48 properties; FCPT is in the process of carrying out diligence on the remaining two properties. Quick Service 84 7.6%
2. FCPT purchased three more Chili’s properties from Brinker International for $9 million in a separate sale-leaseback transaction on 9/14/2018.
3. Based on a share price of $25.69 as of 9/21/2018. Total FCPT Portfolio 589 100%
4. FCPT owns one dual tenant Mod Pizza / Del Taco property.
5 | FCPT | SEPTEMBER 2018
COMPANY UPDATE &
    MOMENTUM SINCE SPIN-OFF

FCPT Team and Portfolio Highlights                                                                               Market Access & Capital Raising Highlights

•    Continue to build out acquisition, legal and accounting / finance                                            •   FCPT continues to trade with an attractive cost of capital
     teams
                                                                                                                  •   Recycled Capital Accretively
•    Added two additional board members with extensive restaurant                                                      - Sold six properties since October 2016 at a weighted average
     management experience                                                                                               4.9% cap rate for $57 million of proceeds, redeploying into
      - Charley Jemley (Yum! Brands, Starbucks, Hardee’s / CKE                                                           new properties in 6.5%-7.0% cap rate range
        Restaurants) and Eric Hirschhorn (Burger King / Restaurant
        Brands International)                                                                                     •   December 2016: Launched At-the-Market (“ATM”) equity program
                                                                                                                       - Utilized ATM equity program to raise $69 million from Q4 2016
•    Darden (Baa2/BBB/BBB; Enterprise Value of $14.7 billion / 1,746                                                     to Q2 2018
     owned restaurants1) spin-off portfolio continues to perform well
     with EBITDAR to rent coverage increased from 4.2x to 5.0x                                                    •   January 2017: Obtained Investment Grade rating (Fitch: BBB-)
      - Darden outpacing performance / same-store sales growth of                                                 •   June 2017: Issued debut $125 million Private Note offering of
         casual dining peers while maintaining low leverage
                                                                                                                      7-year and 10-year notes
•    Closed acquisitions of $399 million (177 restaurant properties) at
                                                                                                                  •   September 2017: Recast and extended $650 million Credit
     an average 6.6% cap rate
                                                                                                                      Facility in September 2017 with reduced interest rates
•    Grown the portfolio from 5 brands at spin-off to 31 national brands;
                                                                                                                  •   August 2018: Successful inaugural secondary offering of
     Darden tenant concentration has declined from
     100% to 79%                                                                                                      4.0 million shares for $101 million of gross proceeds which was
                                                                                                                      oversubscribed
•    Sourced unique portfolio of up to 41 mall / shopping center
                                                                                                                  •   September 2018: Closed $100 million Private Note offering of
     outparcel restaurants from Washington Prime ($67 million)
                                                                                                                      8-year and 10-year notes (to be funded in December 2018) at
      - Low rent sites with strong brands and corporate operators                                                     4.6% and 4.8% interest rates, respectively
      - Aim to replicate this strategy with other retail landlords
•    Closed on largest acquisition to date with the 48 property /
     $156 million Brinker International sale-leaseback transaction2,3
    ___________________
    1.   Market Data as of 9/21/18;Company figures as of 8/26/2018
    2.   On 8/8/2018, FCPT closed on 46 of the 48 properties; FCPT is in the process of carrying out diligence on the remaining two properties.
    3.   FCPT purchased three Chili’s properties from Brinker International for $9 million in a separate sale-leaseback transaction on 9/14/2018.

     6 | FCPT | SEPTEMBER 2018
SELECT TRANSACTION OVERVIEW:
WASHINGTON PRIME MALL OUTPARCEL
PORTFOLIO
• On September 20, 2017, FCPT announced the acquisition of 41 restaurant properties from Washington Prime Group (“WPG”) for a purchase price of
   approximately $67 million (6.7% initial cash yield) with a weighted average remaining 8-year lease term
     -    Solid Centers with Attractive Anchors: ~83% of rent is from properties on out-lots to open-air properties or WPG’s “Tier One Enclosed” malls
     -    Unencumbered Sites: Outparcels to malls or shopping center locations are unencumbered by property level debt
     -    Diverse Portfolio with Strong Demographics: 22 different restaurant brands across 12 states with strong population, traffic and household
          income demographics in line with the original Darden portfolio
     -    Low Rents: Low rent properties / ground leases representing 4% rent-to-sales (assumes brand average sales when tenant financials unavailable)
     -    Strong, Corporate Tenants: >80% of leases (by rent) are with the brand’s corporate entity, with the remaining leased to established franchisees

• The first 17 properties / $28 million have closed and the majority of the remaining properties are expected to close in multiple tranches before the end
   of 2018

                                                                                                                      22 Portfolio Brands

         FCPT Current Portfolio

         WPG Portfolio

 Portfolio as of 9/21/2018 and remaining WPG properties scheduled to close.
   7 | FCPT | SEPTEMBER 2018
SELECT TRANSACTION OVERVIEW:
   BRINKER SALE-LEASEBACK

On August 8, 2018, FCPT acquired 46 Chili’s properties for $149.8 million from Brinker International (NYSE: EAT) through a
sale-leaseback transaction. Two additional properties are expected to close by the end of
Q3 2018 for $5.9 million, bringing the total transaction size up to 48 properties / $155.7 million.

Transaction Overview:

• Properties: 48 Chili’s (all corporate-operated)
• Initial Rent: ~$9.9 million (10% increase every
   5 years)
• Corporate Operator / Guarantor: Brinker
   International (rated Ba1/BB+/BB+ by
   Moody’s/S&P/Fitch)
• Long Term Leases: 15-year initial term
• Diverse Geography: 15 states (primarily
   Florida and Texas) with western U.S. exposure
• Strong Rent Coverage: 3.9x EBITDAR / Rent
   Coverage1

                                                                                                                                                                                                FCPT Current Portfolio

                                                                                                                                                                                                Brinker Portfolio

    ___________________
    1. Based on company-provided restaurant level EBITDAR for the trailing 12 months ending March 2018. EBITDAR is 4-wall, which does not include an allocation of Brinker’s corporate overhead expense.

     8 | FCPT | SEPTEMBER 2018
TENANT EVOLUTION SINCE SPIN-OFF:
SIGNIFICANT PROGRESS ON DIVERSIFYING
TENANT BASE

                                                                  Brand Breakdown by Annual Base Rent

                                                                            +27.7% growth in annual
                                                                              base rent since spin1

                                                                                                                      16%
                                                                                                                     105 units
                                                     20%
                                                104 units
                                                                                                                                 8%
                                                              6%                                       59%                  50 units
                                                         14 units
                                  74%                                                                 299 units
                               300 units                                                                                  13%
                                                                                                                         122 units

                         Initial Portfolio at Spin:                                               FCPT Portfolio Today (9/21/18)1:
                               418 Properties                                                             589 Properties
                      Annual Base Rent of $94.4 million                                          Annual Base Rent of $120.6 million1
                          100% Darden Exposure                                                        79% Darden Exposure

 ___________________
 1.   Represents current scheduled minimum contractual cash rent as of 9/21/2018.

  9 | FCPT | SEPTEMBER 2018
HIGH QUALITY PORTFOLIO

  FCPT Portfolio Summary

                                    • 589 Properties
 Properties:                        • 79% Investment grade tenancy
                                    • 31 brands – 13 Casual, Family & Fine Dining / 18 Quick Service & Fast Casual

                                                                                                                         Casual,
                                    • 45 states                                                                          Family
 Geography:
                                    • Only Texas (12.4%) and Florida (11.6%) are above 10% of NOI                        & Fine
                                                                                                                         Dining

                                    • 12.4 years
 Term Remaining:
                                    • Only 2.1% of NOI expiring before 2027

 Contractual Rent
                                    $120.6 million
 (Cash):

 EBITDAR / Rent
                                    4.6x1                                                                                 Quick
 Coverage:
                                                                                                                         Service
                                                                                                                         & Fast
                                                                                                                         Casual
 Annual Rent
                                    ~1.5% average fixed annualized rent increase
 Escalation:

                                    Net leases with tenant responsible for repair and maintenance costs, property tax,
 Lease Structure:                   insurance and building restoration
                                    Predominantly individual leases to allow landlord flexibility
___________________
Note: Unless otherwise stated, figures are as of 9/21/2018 and pro forma for the Q3’18 acquisitions through 9/21/2018.
1. As of 6/30/2018.

 10 | F C P T | S E P T E M B E R 2 0 1 8
AGENDA Company Overview and Business Update Page 3 Key Investment Highlights Page 11 Acquisition & Diversification Strategy Page 18 Appendix Page 27 11 | F C P T | S E P T E M B E R 2 0 1 8
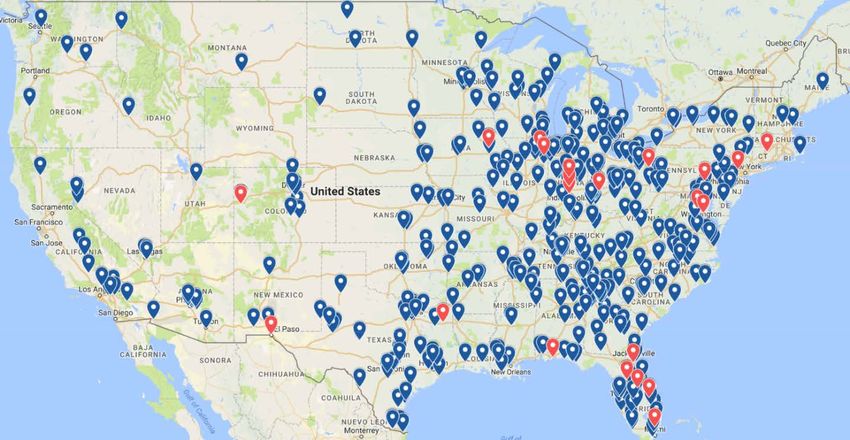
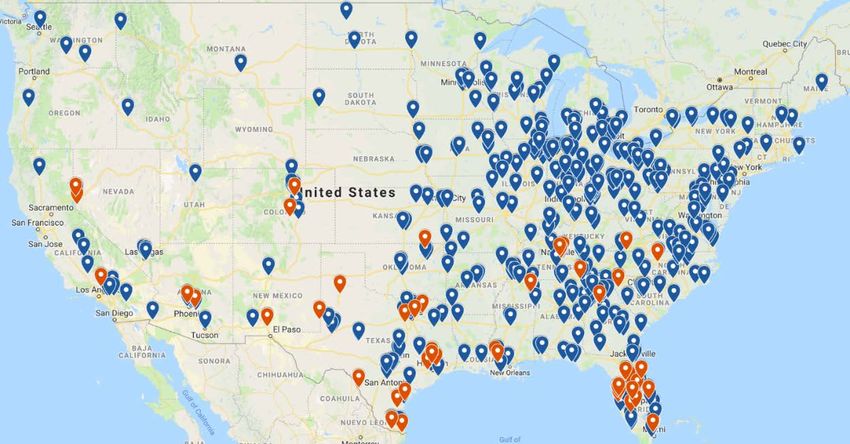
NATIONAL FOOTPRINT WITH INCREASING
BRAND DIVERSIFICATION
ND
WA MT
589 Properties MN
ME
SD WI
ID MI VT NH
OR
WY NY
IA MA
NE CT RI
PA
45 States NV
UT CO
IL IN
OH
MD
NJ
KS WV DE
MO
KY VA
Annualized
CA TN
OK NC Base Rent (%)
31 Brands AZ NM
AR
≥10.0%
SC
MS AL 5.0%–10.0%
GA
TX
LA 3.0%–5.0%
2.0%–3.0%
4.0 mm sq ft FL
1.0 %–2.0%NATIONAL FOOTPRINT WITH INCREASING
BRAND DIVERSIFICATION (CONTINUED)
1
589 Properties
31 Brands
___________________
1. Data as of 9/21/2018
2. Other includes two Seasons 52 properties, as well as one property for each of the following brands: BJ’s Restaurant, Cheddar’s, Chick-Fil-A, Del Taco/Mod Pizza, Denny’s, Fazoli’s, Panda Express,
Panera Bread, Wildfish and Zaxby’s. Includes one vacant property.
13 | F C P T | S E P T E M B E R 2 0 1 8LEASE MATURITY SCHEDULE
Lease Maturity Schedule (% Annualized Cash Base Rent1)
16.2%
99.9% occupied2 14.3%
13.9%
12.4%
12.1% 11.8%
Weighted average lease
term of 12.4 years
8.7%
Only 2.1% of
rental income matures
prior to 2027
3.3% 3.4%
0.7% 0.9%
0.4% 0.2% 0.3% 0.5% 0.3%
0.0% 0.0% 0.1% 0.2% 0.1% 0.2% 0.1%
2018 2019 2020 2021 2022 2023 2024 2025 2026 2027 2028 2029 2030 2031 2032 2033 2034 2035 2036 2037 2038 2039 2040
___________________
Note: Excludes renewal options. All Data as of 9/21/2018.
1. Annualized cash base rent is calculated using the scheduled minimum contractual rent.
2. Occupancy based on portfolio square footage.
14 | F C P T | S E P T E M B E R 2 0 1 8SUMMARY CAPITALIZATION AND
FINANCIALS
Capitalization FCPT Current Trading Metrics FCPT Current1
($ million, except per share) Current1 Cash NOI ($ million)3 $120.6
Share price (9/21/2018) $25.69 Implied Cap Rate 5.3%
Shares and OP units outstanding (millions) 67.4 Quarterly Dividend per share $0.2750
Equity value $1,731 Annualized Dividend per share $1.10
Debt: Dividend Yield 4.3%
Bank term debt $400
Revolving credit facility $0
Peer Leverage Comparison: Debt / EBITDAre2
Unsecured private notes $125
Total market capitalization ("TMC") $2,256 6.9x
Annualized Adjusted EBITDAre2 $108 6.2x
1.1x
5.6x 5.7x 5.7x
1.1x
4.9x
4.0x
0.3x
5.8x
5.1x
FCPT
3.7x
Credit Metrics Current1
Debt to TMC 23.3%
2
Debt to EBITDAre 4.9x
FCPT SRC O ADC STOR NNN VER
___________________
Note: FCPT uses NAREIT defined EBITDAre adjusted. EBITDAre is a non-GAAP figure calculated as EBITDA excluding gains or impairments and acquisition / disposition transaction.
1. “FCPT Current” column represents FCPT financials as of 6/30/2018 and $101 million equity offering closed on 8/7/2018.
2. As previously disclosed, see our Supplemental Financial & Operating Information for the Quarter and Six Months ended June 30, 2018 for a reconciliation to net income. Does not include an additional
$11,992,522 in rent for transactions closed through 9/21/2018.
3. Scheduled minimum contractual cash rent as of 9/21/2018.
15 | F C P T | S E P T E M B E R 2 0 1 8FCPT DEBT MATURITY SCHEDULE
Current Debt Maturity Schedule1
Weighted average Drawn Revolver
maturity of 5.5 years1
Undrawn Revolver Capacity
$400
Unsecured Term Loan
Unsecured Notes
New Unsecured Notes
$250
$75
$50 $50 $50
$0 $0 $0 $0 $0
2018 2019 2020 2021 2022 2023 2024 2025 2026 2027 2028
___________________
Figures as of 9/21/2018.
1. Excludes undrawn revolver; Includes announced $100 million additional unsecured notes due 2026 and 2028 which will be funded in December 2018
16 | F C P T | S E P T E M B E R 2 0 1 8FCPT CAPITALIZATION AND PORTFOLIO
CREATE A STRONG PLATFORM FOR GROWTH
High quality portfolio diversified geographically and by concept across 45
states and 31 tenant brands
Stable rental stream, 100% anchored with service retail tenants and 79%
investment grade tenancy with long-term lease-life of 12.4 years and strong
4.6x tenant rent coverage
Meaningful fixed increases in contractual annual base rent
Proof of concept in large addressable restaurant net lease market, with
$399 million of acquisitions across 177 properties since inception (July 2016);
flexibility to close both small granular deals and large portfolio transactions
Strong credit profile with access to investment grade debt market and ample
liquidity
Conservative financial position with 4.2x net leverage, amongst the lowest in
net lease REIT sector
Experienced management and board in both real estate and restaurant
industries
___________________
Figures as of 9/21/2018 and pro forma for all Q3 acquisitions and August 2018 $101 million secondary equity offering.
17 | F C P T | S E P T E M B E R 2 0 1 8AGENDA Company Overview and Business Update Page 3 Key Investment Highlights Page 11 Acquisition & Diversification Strategy Page 18 Appendix Page 27 18 | F C P T | S E P T E M B E R 2 0 1 8
FCPT ACQUISITION PHILOSOPHY
AND UNDERWRITING CRITERIA

Acquisition Philosophy
•   Acquire nationally recognized branded restaurants that are well located with creditworthy lease guarantors
•   Purchase assets only when accretive to cost of capital
•   Increase diversification by targeting different brands, meal price-points, cuisine types, and geographies

Underwriting Criteria
•   Acquisition criteria is approximately split 50% / 50% between credit and real estate metrics
•   Initial screening decisions are informed by a property scorecard based on these metrics, but investment
    decisions ultimately rely on thorough credit and property-level diligence

                                    Credit Criteria (~50%):   Real Estate Criteria (~50%):
                                    − Guarantor credit        − Location
                                    − Brand durability        − Re-use potential
                                    − Store performance       − Lease structure
                                    − Rent-to-sales           − Absolute rent
                                    − Lease term              − Rent growth

19 | F C P T | S E P T E M B E R 2 0 1 8
FCPT ACQUISITION TARGET CRITERIA
Summary Criteria
• Single-tenant restaurant properties net leased to credit-worthy tenants
operating well-known brands; select multi-tenant properties considered
Properties:
• Existing leases or new sale-leasebacks
• Minimum deal size of $1 million
• All 50 states and Canada, currently in 45 states
Geography • Demographics of 20,000+ in a 3-mile radius with average daily vehicles of at
/ Location: least 15,000
• Preference for hard-corner intersection real estate
• Corporate or strong franchisee tenants
Tenant:
• For franchisees, primarily focusing on “Franchise Times: Top 200”
• At least 10 years for new leases
Term:
• Preference of 5+ years for existing leases
• 2.5x
• Rent metrics criteria will vary based on brand
Annual Rent • Fixed contractual rent escalations preferred over variable
Escalation: • Target of annualized rent escalations of 1.0-2.5%
Lease Structure: • Triple net leases preferred, no landlord obligations
20 | F C P T | S E P T E M B E R 2 0 1 8INVESTMENT OPPORTUNITY SOURCING
FCPT is principally building its acquisition pipeline through five channels:
1) Consolidating Franchisees:
The franchisee industry is highly fragmented, but is undergoing consolidation and growth by top players.
FCPT partners with large franchisees on real estate transactions as they grow their operations.
2) Mall and Shopping Center Outparcels:
FCPT has announced several portfolio transactions with mall and shopping center REITs and continues to
work on replicating this strategy. The added complexity and delayed closing timeframe for these deals gives
FCPT an advantage over non-institutional investors.
3) Repeat Tenant Transaction:
FCPT’s tenant base includes many strong franchisee and corporate operators. FCPT has endeavored to
build strong relationships with its tenants, and, as a result, receives opportunities for off-market and repeat
sale-leaseback transactions for many of these restaurant operators.
4) Fully Marketed Broker Sourcing:
The investment team is in close contact with net lease brokers across the country and reviews marketed
properties on a daily basis. Although there is strong competition in this market, FCPT is able to secure deals
due to its strong reputation for timely execution.
5) Large Sale-Leaseback Transactions:
These transactions are large in scale, but infrequently available. They typically have a competitive bidding
process amongst institutional investors. Both the Brinker and Bob Evans sale-leaseback transactions are
examples.
21 | F C P T | S E P T E M B E R 2 0 1 8FOOD & BEVERAGE AMONG
MOST E-COMMERCE RESILIENT
RETAIL CATEGORIES
US eCommerce Penetration by Retail Category (2016)
50%
46.7%
45%
40%
35%
31.8%
30%
25%
20%
16.4%
14.8%
15%
11.1% 11.0% 10.5%
10%
7.3%
5% 2.8%
0.9%
0%
Consumer Books & Toys & Hobbies Apparel & Health & Jewelry & Sports & Fitness Furniture & Total Food &
Electronics Magazines Accessories Personal Care Watches (ex apparel) Home Grocery 1 Beverage 1
(incl appliances)
Online / digital sales penetration has remained low within restaurants
___________________
Source: ComScore, Census Bureau, BEA, Internet Retailer, Wall Street Research.
1 Calculated using estimated online sales.
22 | F C P T | S E P T E M B E R 2 0 1 8VAST ADDRESSABLE MARKET WITHIN
RESTAURANT INDUSTRY SUBSECTORS
US GDP – $18.6 Trillion
Consumption Investment Government
$12.8T $3.0T $3.3T
Net Exports Retail Sales
-$0.5T
$4.85T
Restaurants
(~11% of Retail Sales, $523bn)
Family Fine
Quick Service & Fast Casual Casual Dining
/ Buffet Dining
$268bn $194bn
$42bn $19bn
Sand- Mex- Varied Mex- Sea-
Hamburger Pizza Coffee Chicken Other Italian Steak Asian Other
wich ican Menu ican food
$82bn $40bn $29bn $24bn $39bn $24bn $20bn $19bn $30bn
$31bn $23bn $67bn $22bn $12bn
FCPT
Target ~ ~ ~ ~
___________________
Note: Data reflects estimated sales for each respective subsector or industry.
Source: Technomic, Census Bureau, Bureau of Economic Analysis, Wall Street Research as of May 2018; all Data as of December 2016.
23 | F C P T | S E P T E M B E R 2 0 1 8RAPID FRANCHISEE CONSOLIDATION
CREATES REAL ESTATE OPPORTUNITIES
IN RESTAURANT INDUSTRY
Units Owned by the Top 200 Franchisees Average units per Top 200 Franchisees
141
28,109
135
26,993
126
25,176
116
23,177
109
21,831
102
20,331
18,408
92
17,887
89
16,915 85 82 84
16,715
16,030 16,489 80
2006 2007 2008 2009 2010 2011 2012 2013 2014 2015 2016 2017 2006 2007 2008 2009 2010 2011 2012 2013 2014 2015 2016 2017
The franchisee industry is highly fragmented, but undergoing consolidation and
growth by top players, presenting new partnership opportunities for FCPT
___________________
Source: Franchise Times: Restuarant 200 (August 2018)
24 | F C P T | S E P T E M B E R 2 0 1 8INDUSTRY BENCHMARKING:
CONCENTRATING ON STABLE BRANDS
FCPT is focused on acquiring restaurants operated by top brands within each cuisine type
% of % of Typically Top 5
Top 5 Brands by Market Share (% of cuisine type)1
Revenue Dining Restaurant Free-Standing % of
($bn) Sector Industry Buildings #1 #2 #3 #4 #5 Subsector
Quick Service:
Burger $82 31% 16% Yes McDonald's (45%) Burger King (12%) Wendy's (11%) Sonic Drive-In (6%) Dairy Queen (4%) 77%
Pizza $40 15% 8% No Pizza Hut (25%) Domino's (23%) Little Caesars (16%) Papa John's (13%) Papa Murphy's (4%) 81%
Sandwich $31 12% 6% Yes Subway (50%) Arby's (16%) Jimmy John's (10%) Jersey Mike's Subs (4%) Firehouse Subs (3%) 83%
Coffee $29 11% 6% No Starbucks (63%) Dunkin Donuts (29%) Tim Hortons (3%) Krispy Kreme (3%) Peet's Coffee (1%) 99%
Chicken $24 9% 5% Yes Chick-fil-A (35%) KFC (20%) Popeyes (13%) Zaxby's (7%) Bojangles' (5%) 80%
Mexican $23 9% 4% Yes Taco Bell (55%) Chipotle (23%) Qdoba (5%) Del Taco (4%) Moe's Southwest (4%) 91%
Other
$39 15% 7% Yes Panera Bread (52%) Panda Express (31%) Captain D's (6%) Long John Silver's (5%) Pei Wei (4%) 97%
(Asian, Seafood, Misc)
Total Quick Service $268 100% 51%
Casual Dining:
Varied Menu $67 35% 13% Yes Applebee's (17%) Buffalo Wild Wings (14%) Chili's Grill & Bar (13%) Cheesecake Factory (8%) Red Robin (6%) 58%
Italian $24 12% 5% Yes Olive Garden (61%) Carrabba's (11%) Maggiano's (6%) Macaroni Grill (4%) Brio Tuscan Grille (4%) 86%
Mexican $22 11% 4% Yes On the Border (43%) Chuy's (39%) El Torito (18%) - - 100%
Steak $20 10% 4% Yes Outback (33%) Texas Roadhouse (30%) LongHorn (21%) Logan's (8%) Sizzler (3%) 95%
Asian $19 10% 4% No P.F. Chang's (75%) Benihana (25%) - - - 100%
Seafood $12 6% 2% Yes Red Lobster (67%) Bonefish Grill (17%) Joe's Crab Shack (10%) Bubba Gump (6%) - 100%
Other $30 15% 6% NA - - - - - 0%
Total Casual Dining $194 100% 37%
Family Dining / Buffet $42 100% 8% Yes IHOP (23%) Cracker Barrel (21%) Denny's (20%) Golden Corral (12%) Waffle House (9.0%) 85%
Fine Dining $19 100% 4% No Ruth's Chris (19%) Capital Grille (12%) Fleming's (8%) Saltgrass (8%) Morton's (8%) 56%
Restaurant Industry $523 100% Green font denotes FCPT owned brands;
Orange font denotes brands under contract
___________________ announced in Washington Prime portfolio
Source: “Nation’s Restaurant News Top 200”, Census Bureau, Bureau of Economic Analysis, Wall Street Research as of May 2018; Data as of December 2016.
1. Market share is defined as total brand sales as a percentage of the sum of all sizable brands within each cuisine type subsector. Brand selection is based on data from “Nation’s Restaurant News Top 200”.
25 | F C P T | S E P T E M B E R 2 0 1 8FURTHER BRAND SELECTION
CONSIDERATIONS SURROUND
LONG-TERM CASH FLOW PROTECTION
Brand Average Sales
Volume ($000s) Casual
$6,000 $10,495 Dining
$5,000 Fast
Brands with mid-range sales have more
options for re-tenanting in case of vacancy Casual
$4,000
Quick
Service
$3,000
$2,000
$1,000
$0
FCPT pursues properties within the median range of Casual Dining, Fast Casual and Quick Service;
Concepts with mid-level sales volumes provide rent support, while keeping rent at replaceable levels in case of vacancy
Source: Brand average sales per Nation’s Restaurant News Top 200 (2018 edition, uses 2017 sales volumes).
26 | F C P T | S E P T E M B E R 2 0 1 8AGENDA Company Overview and Business Update Page 3 Key Investment Highlights Page 11 Acquisition & Diversification Strategy Page 18 Appendix Page 27 27 | F C P T | S E P T E M B E R 2 0 1 8
FCPT CLOSED ACQUISITIONS
   (2018 YEAR TO DATE)

                                                         # of                                                  Purchase   Initial Cash    Term
Tenant                                 Location       Properties   Operator / Guarantor Information         Price ($mm)           Yield   (yrs)   Announced

Buffalo Wild Wings                           IL           2        World Wide Wings (40+ unit franchisee)         $6.6          6.6%       14     1/10/2018
                    st
WPG Portfolio: 1 Closing
                                     FL, IL, IA, OH      10        8 corporate and 2 franchisees                 $13.8          6.6%       7      1/12/2018
(10 concepts)

Popeyes                                     TN            1        New concept with 150 unit guarantor            $1.7          6.6%       20     4/30/2018

Red Lobster                                 PA            1        700-unit operator                              $1.8          7.1%       9      5/29/2018

Popeye's                                    TN            1        New concept with 150 unit guarantor            $1.7          6.6%       20     5/31/2018

PREIT
                                            SC            1        Corporate                                      $1.7          6.6%       14     6/29/2018
(Buffalo Wild Wings)
WPG Portfolio: 2nd Closing              IN, IL,
                                                          5        4 corporate and 1 franchisee leases            $9.5          6.4%       9      6/29/2018
(5 concepts)                          FL, OH, TX

Buffalo Wild Wings                          TX            1        Corporate                                      $3.6          6.9%       6      7/16/2018

WPG Portfolio: 3rd Closing
                                            CT            2        1 Corporate and 1 Franchisee                   $4.6          7.1%       8      7/27/2018
(2 concepts)

Arby's                                       MI           1        Corporate                                      $1.6          7.0%       6       8/6/2018
                                AZ, CA, CO, FL, GA,
Brinker Portfolio               LA, MS, NC, NM, NV,      46        Corporate                                    $149.8          6.4%       15      8/8/2018
                                OK, SC, TN, TX, VA
Buffalo Wild Wings                          TN            1        Corporate                                      $1.7          7.5%       4       8/8/2018

Chili's 3-unit portfolio                   TX, OK         3        Corporate                                      $9.0          6.4%       15     9/14/2018

Total 2018 (year to date through 9/17/2018)              75                                                     $207.0          6.4%       14
Total since inception (7/1/2016 to 9/17/2018)            177                                                    $399.6          6.6%       16

   Note: Figures updated as of 9/21/2018
    28 | F C P T | S E P T E M B E R 2 0 1 8
FCPT CLOSED ACQUISITIONS
(2016 & 2017)
# of Purchase Initial Cash Term
Tenant Location Properties Operator / Guarantor Information Price ($mm) Yield (yrs) Announced
Pizza Hut IL, IN 6 40-unit sub. of 150-unit operator $5.7 7.2% 20 7/18/2016
Wendy's TX 1 2-unit operator $2.1 6.5% 10 8/2/2016
Arby's NC 2 24-unit operator $3.5 6.6% 18 9/6/2016
KFC MI 4 360-unit operator $3.9 7.1% 20 9/14/2016
Buffalo Wild Wings IL, IA 3 7-unit operator (assigned to 40-unit operator) $7.9 6.5% 12 9/15/2016
Dairy Queen OK 1 76-unit operator $2.6 6.6% 18 10/20/2016
Burger King VA, NC, MS, AL 5 98-unit operator $11.5 6.5% 20 10/28/2016
Arby's VA, NC 2 24-unit operator $4.3 6.6% 18 11/4/2016
USRP Portfolio: Tranche 1 MI, KY, OH, IN,
10 Mix of corporate and strong franchisees $15.6 6.6% 10 11/9/2016
(7 concepts) IL, FL, CO, GA
KFC IN, MI, WI 16 130-unit operator $21.1 6.5% 20 11/10/2016
Taco Bell IN 1 85-unit sub. of 250-unit operator $1.3 6.7% 5 11/15/2016
Hardee's AL & GA 4 35-unit operator $6.9 6.5% 20 12/15/2016
Burger King TN 4 115-unit operator $7.7 6.5% 20 12/28/2016
Total 2016 59 $94.0 6.6% 17
USRP Portfolio: Tranche 2
AL, IN, NY, TN 4 Mix of corporate and strong franchisees $5.8 6.5% 12 1/12/2017
(3 concepts)
Taco Bell SC 1 60-unit sub. of 250-unit operator $2.4 6.5% 12 1/13/2017
McAlister's TX 4 40-unit operator $8.9 6.7% 15 3/17/2017
DE, IN, MD, MI, NY,
Bob Evans 16 524-unit operator $35.1 7.1% 20 5/1/2017
OH, PA, VA, WV
Burger King MS, TN 7 115-unit operator $16.0 6.7% 20 6/30/2017
Taco Bell IN 2 270-unit operator $3.4 6.5% 20 7/26/2017
MOD Pizza/Del Taco MI 1 5-unit sub. of 90-unit operator $2.7 7.4% 10 9/15/2017
Red Lobster OH, MI, PA, GA 5 700-unit operator $19.4 6.7% 21 11/2/2017
LongHorn Steakhouse SC 1 490-unit sub. of 1,695-unit operator $1.5 6.6% 10 12/7/2017
Burger King MS 2 115+ unit franchisee $3.3 6.7% 20 12/19/2017
Total 2017 43 $98.6 6.8% 19
29 | F C P T | S E P T E M B E R 2 0 1 8FCPT CLOSED DISPOSITIONS
# of Sale Initial Cash Term
Tenant Location Properties Operator / Guarantor Information Price ($mm) Yield (yrs) Announced
Bahama Breeze Tampa, FL 1 Bahama Breeze Holdings, LLC $18.5 4.8% 12 10/24/2016
Olive Garden Pembroke Pines, FL 1 Darden Restaurants, Inc. $6.3 4.8% 16 10/24/2016
Olive Garden Lakeland, FL 1 Darden Restaurants, Inc. $5.2 5.1% 15 5/17/2017
Olive Garden Fairfax, VA 1 Darden Restaurants, Inc. $5.9 4.7% 16 9/13/2017
Olive Garden Pinellas Park, FL 1 Darden Restaurants, Inc. $5.1 4.7% 16 11/24/2017
Bahama Breeze Orlando, FL 1 Bahama Breeze Holdings, LLC $16.2 5.1% 11 5/25/2018
Total / Wtd. Avg. 6 $57.2 4.9% 13
Note: Figures updated as of 9/21/2018
30 | F C P T | S E P T E M B E R 2 0 1 8You can also read