FREEZE THE FARES A REPORT ON PUBLIC TRANSPORT PRICING OPTIONS AT HOME AND ABROAD - BY MALCOLM MCCRACKEN, MAULIK THAKKAR AND LINDSEY HORNE ...
←
→
Page content transcription
If your browser does not render page correctly, please read the page content below
FREEZE THE FARES
      A report on Public Transport Pricing
              Options at home and abroad

   By Malcolm McCracken, Maulik Thakkar
                     and Lindsey Horne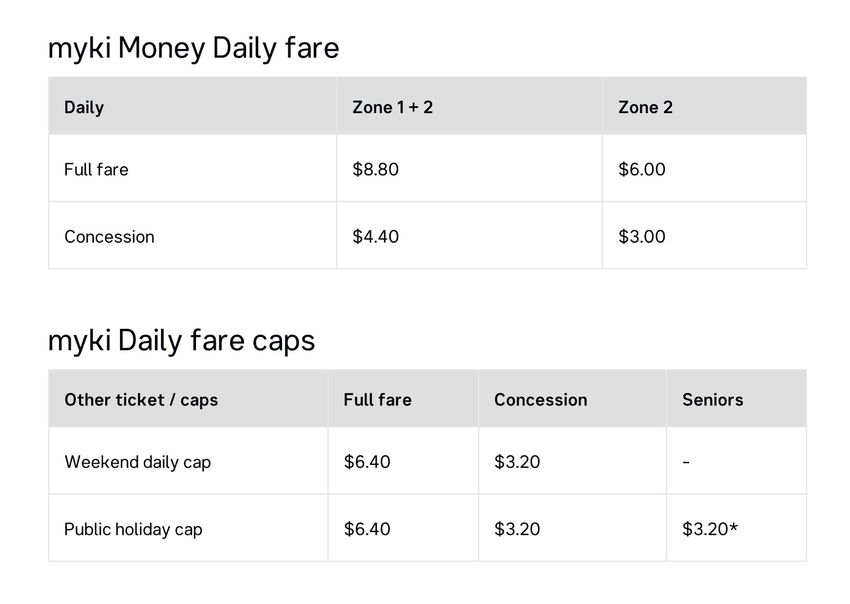
Contents

Executive Summary ............................................................................................................................... 2

Introduction ........................................................................................................................................... 3

How this Report Will Contribute to the Conversation ........................................................................... 3

An Overview of North American Case Studies....................................................................................... 4

An Overview of European Case Studies ................................................................................................. 8

An Overview of Australia and New Zealand Case Studies ................................................................... 11

A Summary of Auckland’s Status Quo at Present ................................................................................ 15

Recommendations for the Auckland Context...................................................................................... 16

Funding ................................................................................................................................................ 21

Conclusions .......................................................................................................................................... 22

                                                                                                                                                        1
Executive Summary
This report was called for to provide empirical evidence to the idea that alternative options for
public transport pricing should be considered by Auckland Council and Auckland Transport in the
wake of the fare increases announced in January 2019. Several of Auckland’s contemporaries have
proposed or adopted a number of alternative methods of fare collection that have boosted fare
revenues while increasing patronage. Regulatory frameworks used by public transport systems have
been successfully adapted to allow for these alternative methods to be put in practice, which we
have yet to undertake in Auckland’s context. This report aims to support the public transport system
in Auckland by recommending changes to the fare collection framework currently in place.
The following measures is recommended (reliant on the removal of the Farebox Recovery Policy)
• Daily Fare Caps
• Tertiary Student Discounts
• Increasing the free transfer time period to 1 hour
• Free travel for children under 12 and everyday $0.99 child fares for those who are 12 to 15
years old
• Free weekends for families travelling together
• Weekend and Six-Hour unlimited pass add-ons for HOP Cards
• Introducing a Disposable paper-based HOP Card for Visitors
• Providing $6 credit on all new HOP Cards
2Introduction
The Farebox Recovery Ratio (FRR) is not designed for growth. If a council wants to grow patronage
and their public transport network, this increases costs, 50% of which must be covered by fares. This
is counterproductive as increased fares make Public Transport less accessible despite any
improvements to the network. It also hits our most economically vulnerable communities the
hardest, according to Auckland Council. Auckland Transport’s own estimates were that were the fare
to increase on the 10th of February 2019, this would lead to a reduction in patronage to the tune of
830,000 trips per year1.
How this Report Will Contribute to the Conversation
This report will look at the limitations of the Farebox Recovery Ratio by providing key opportunities
sourced from public transport decision-making in several contemporary cities across the world and
draw parallels to Auckland’s unique public transport context. It will be structured into a series of
overviews of case studies from overseas and summarise the opportunities in a bullet-point format. It
will conclude by tracing the path from where Auckland is at present with its public transport status
quo to the adoption of some of this report’s recommendations.
1
Auckland Transport. “PT Opex / Funding Update (Fares Review).” Auckland Transport Board Meeting, 11-12-
18, Auckland Transport, 2018, Page 289, Auckland Transport Public Archives,
https://at.govt.nz/media/1979279/item-87-closed-session-dec-18-pt-opex-funding-update.pdf
3An Overview of North American Case Studies
Vancouver, British Columbia
A publicly-funded study commissioned by Vancouver City Council, at the School of Regional and
Community Planning within the University of British Columbia recommended a variety of measures
to make fare collection more efficient and cost-effective while addressing distinct income levels
among the end users of the public transport system in Vancouver in the summer of 2016.2 These
measures included a minimum of two zones for which a fare is paid, the introduction of differential
pricing for peak and off-peak hours, the introduction of an extra dollar surcharge on every individual
fare collected for the busiest zone in the city during peak hours, and the introduction of a super pass
tier to guarantee unlimited ridership across all zones on evenings and weekends (as well as
unlimited bike-sharing privileges).
Additionally, the study recommended the adoption of decreasing cost per kilometre and a maximum
fare cap of about $5 per day for regular (non-pass) fare users, as well as a rebate system to return a
dollar or two to passholders who travelled outside of peak hours, the standardisation of cost to the
passenger’s wallet across all concession monthly passes. Alternatively, the study proposed free
travel for certain times of day for regular fares and passholders, and a ‘select your perk’ programme
for superpass tier holders where additional family members and group members could be added
onto one’s pass for no extra fee during evenings and weekends. The conclusion emphasised that
messaging was most important to clarify to the public why the adoption of frequent public transport
2
Peter Lipscombe. ‘Transit Fare Policy - An International Best Practices Review for Metro Vancouver’ UBC Press,
2016.
4use would contribute to progressive mobility outcomes3, including minimisation of the city’s carbon
footprint.
Key opportunities:
• Minimum zone fares
• Peak and off-peak pricing
• Surcharge pricing for busiest zones during peak
• Introduction of a super-pass tier for unlimited travel
• Decrease cost per kilometre
• Maximum fare cap per day
• Off peak rebates
• Free travel periods
• ‘Select your perk’ programme for super-pass tier holders
• Rolling out messaging to win over the hearts and minds of the public
Toronto, Ontario
Chin, Lai and Chow published the first case study on fare pricing policy specific to Toronto in the
Transportation Research Record, funded by the Canada Research Chairs4. The study confirms that a
simple distance-based formula will be inadequate to provide for all subsections of Toronto’s
population. The authors recommend further study of congestion-dependent pricing and schedule-
based dynamic pricing when calculating fares. The authors contend that fixing fares across zones to
3
Legacy, Crystal & Stone, John, 2019. "Consensus planning in transport: The case of Vancouver’s
transportation plebiscite," Transportation Research Part A: Policy and Practice, Elsevier, vol. 120(C), pages 295-
305.
4
Chin, Anchor, Andy Lai, and Joseph YJ Chow. "Nonadditive Public Transit Fare Pricing Under Congestion with
Policy Lessons from a Case Study in Toronto, Ontario, Canada." Transportation Research Record: Journal of the
Transportation Research Board 2544 (2016): 28-37.
5around $2 and considering some population sections for a distance-based add-on of about 6 cents
per kilometre as a reasonable marker for future consideration by the Toronto Transit Commission
and Metrolinx, the provincial agency which operates the city’s automated fare payment system,
Presto.
Key opportunities
• Looking beyond a distance-based formula
• Exploring congestion-dependent pricing and schedule-based dynamic pricing
• Fixed fare pricing with some distance-based add-ons
The New York-New Jersey Metropolitan Area, United States of America
Bueno, Gomez, Peters and Vassalo confirm in their study of employers providing transit benefits to
employees in the New York-New Jersey area that mode choice is influenced by both individual and
household characteristics where commuting is observed. These transit benefits include free parking
for employees, reimbursement of toll fees and mileage reimbursements for private motor vehicle
fuel. Where employers were found to provide reimbursements for public transport monthly passes,
commuters were 9 times more likely to prefer public transport use and 3 times more likely to adopt
walking and cycling as last-mile connectivity solutions5.
Prominently, the study also finds that those with a driving licence are less likely to choose public
transport or cycling or walking. It was statistically significant to the authors to mention that
Caucasian employees were more likely to use private motor vehicles to commute, indicating a
degree of cultural habit behind motivations among households faced with choices of how to get to
5
Bueno, Paola Carolina, et al. "Understanding the effects of transit benefits on employees’ travel behaviour:
Evidence from the New York-New Jersey region." Transportation Research Part A: Policy and Practice 99
(2017): 1-13.
6work. Additionally, owning more than one private motor vehicle decreased probability of commuting
using public transport by 96%, walking by 95% and cycling by 97%.
The authors found that living near more than one public transport option increased the probability
of commuting by public transport by 127% in the New York-New Jersey metropolitan area.
Individuals in Manhattan were therefore found to use public transport to commute most frequently
when compared to the Hudson or Essex counties. The authors recommend that employers
proactively choosing to provide public-transport-based incentives to employees rather than private-
transport-based incentives to change travel-related choices where commuting is concerned. They
also found no statistical significance in the linkages between household income level and their
commuting choices in their analysis, published in Transportation Research in 2017.
Key opportunities:
• Switch vehicle incentives, such as free parking for employees and mileage reimbursement,
to public transport reimbursements, such as transport passes.
7An Overview of European Case Studies
Madrid, Spain
Burguillo, Romero-Jordan and Sanz-Sanz investigated the impact of increases in public transport
pricing for end users using the lens of welfare in 2016, and found that the bulk of middle-income
earners were worse off in real terms. They also found that placing a stronger emphasis on keeping
automotive fuel pricing constant as a policy decision had a detrimental impact on the sustainability
of urban mobility solutions in Madrid. The authors summarised their findings by stating that there
must be a clear promotion of sustainable solutions for urban mobility, given that their results clearly
demonstrated that the poorest and most vulnerable were not better off following the 10% increase
in fares for Madrid’s residents in 2009 and 20126.
Key opportunities:
• Clear promotion of sustainable urban mobility, particularly for more vulnerable sectors of
the community.
Stockholm, Sweden
The Stockholm School of Economics analysed peak-load pricing in public transport, bringing the
impact of pricing choices on demand in their city in focus. The authors of this 2012 study found that
encouraging passengers to travel during off-peak hours would aid the public transport authority to
overcome congestion issues during peak hours could be facilitated by price discrimination. They
6
Mercedes Burguilloa, Desiderio Romero-Jordán & José Félix Sanz-Sanz. The new public transport pricing in
Madrid Metropolitan Area: A welfare analysis. Research in Transportation Economics, Vol. 62.
8suggested that doing this would add to the economic efficiency of the service provided, by
increasing revenue and uptake of the service in overall terms. They also noted that an automatic
fare collection method in the form of a personal digital wallet would enable more constructive data
to be collected about the travel behaviour of passengers, while also facilitating rebates for off-peak
travel7.
Key opportunities:
• Encourage off-peak travel through rebates
• Utilise a personal digital wallet in order to collect further behavioural data and to facilitate
the off-peak travel rebate
Tallinn, Estonia
Cats, Reimal and Susilo provided empirical evidence from a fare-free scheme in Tallinn, Estonia. In
an effort to improve accessibility and mobility for its residents, Tallinn introduced a fare-free public
transport (FFPT) service. After public transport fares were identified as a primary mobility hindrance
in Tallinn, a popular referendum saw an FFPT policy after it was supported by 75% of the voters. A
before-and-after comparison of the total number of boarding passengers reveals an increase of 3%
in passenger demand. The corresponding increase in total passenger kilometres was 2.6%. The
highest increase of more than 10% occurred in the north-eastern district of Lasnamae, the most
populous and dense district; it is characterised by higher unemployment rates. Districts with high
shares of elderly and unemployed people and low motorisation rates were also associated with
higher demand levels.
7
Rantzien, Vilhelm Horn af, and Anna Rude. "Peak-load pricing in public transport: a case study of Stockholm."
Journal of Transport Literature 8.1 (2014): 52-94.
9The authors also note additional benefits, including the saving of related costs and improved
operational efficiency. The public transport agency saves fare collection and control costs, and it can
capitalise on public transport economies of scale when extending system supply. In the case of an
onboard payment validation, FFPT is expected to result in shorter dwell times at stops, these shorter
dwell times may result in higher commercial speeds and even fleet operations savings.
Other European cities have introduced FFPT policies since the late 1990s - Hasselt, Belgium; Templin,
Germany; and Aubagne and nearby municipalities in France, in 1996, 1997, and 2009, respectively.
All these programs were introduced together with substantial additions to the network supply and
were followed by a dramatic increase in ridership. Similarly, all students in Holland have been
eligible for FFPT in the entire country since 1991. While the impact of FFPT on passenger demand in
the case of Tallinn is lower than that of previous FFPT programs, it is of worth noting that Tallinn had
already taken many steps towards improved accessibility and public transport uptake. For instance,
Tallinn’s public transport fare was relatively low prior to the free fares, 36% of all passengers had an
exemption before the introduction of full-scale FFPT and 24% are entitled to special discounts; and
their public transport share was relatively high (40%) compared to other cities that have
implemented fare-free public transport.
Key opportunities:
• Fare-free public transport across all passengers
• Fare-free public transport for students
• Exemptions and discounts for larger proportions of passengers (upward of 30%)
10An Overview of Australia and New Zealand Case Studies
Melbourne, Victoria, Australia
The City of Melbourne utilises daily fare caps based on the two zones in the metropolitan area.
Public Transport Victoria also provides a 50% discount for concession holders, this includes students.
Figure 1 Melbourne Fare Caps
Key opportunities:
• Daily fare caps
• 50% discounted fares for concession holders
11New South Wales, Australia
Fare caps are used in many cities to encourage the use of public transport for more than just the
commute to and from work, but all travel in between. For instance, the Sydney Adult Opal card
allows passengers to travel across the Opal network - which includes trains, ferries, buses and light
rail - for no more than $15.80 a day, $63.20 per week or $2.70 on Sunday8. In addition train users
also receive a 30% discount when travelling off peak. As with the Fare Cap system, this incentivises
public transport use beyond the peak work commute hours. This is of particular benefit to tertiary
students and shift workers.
Figure 2 Sydney Train Fares
Key opportunities:
• Daily and weekly fare caps
• Off peak discounts
8
Transport NSW. "Adult Fares”. New South Wales Government, Source: https://transportnsw.info/tickets-
opal/opal/fares-payments/adult-fares
12Queensland, Australia
In Queensland, off peak fares are discounted by 20%. Off peak travel times, in this case, are 8.30am-
3.30pm and 7pm-6am during weekdays and all day during weekends and public holidays.
Figure 3 Queensland Public Transport Fares
Key opportunities:
• Off-peak fare discounts including weekends and public holidays
13Perth, Western Australia, Australia
A study of Effective Ways To Grow Urban Bus Markets, found that in the short term decreasing fares
by 10% will increase demand by 4% while increasing service frequency by 10% will increase demand
by 3.5%. While this is a marginal difference, the Farebox Recovery Ratio (FRR) limits Auckland
Transport to doing one action or the other to increase patronage. The removal of the FRR would
enable multiple actions to increase patronage to take place once. This would be a more effective and
efficient way of increasing patronage.
Queenstown, New Zealand
November 2016 saw the Queenstown Bus Network move to a flat fares system, whereby every trip
is $2 with a GoCard, regardless of distance travelled. The use of $2 as the figure for flat fares creates
a more legible user experience, as well as the branding of ‘gold coin fares.’ Within the first 6 months,
bus patronage was up 250% than the same period last year. The number of trips travelled increased
154% from 240 076 to 607 609 between January and June 2017. As a result of the fare price
decrease, fare revenue has increased by 4%.9 The Otago Regional Council also introduced 7 day
visitor passes which they also credit for part of the patronage growth.
Key opportunities:
• Flat fare pricing
9
Tracy Roxburgh. “Bus use soars in Queenstown.” “Otago Daily Times,” Source
www.odt.co.nz/regions/queenstown/bus-use-soars-queenstown
14A Summary of Auckland’s Status Quo at Present
Auckland’s Public Transport system is hamstrung by the Farebox Recovery Ratio (FRR), which
requires fares to increase to match the 50% funding of services as costs increase. This means that for
the network to improve with adding more frequency and routes, the fares must go up. Fares
increasing makes it harder to use, cancelling out some of the increased patronage which comes with
the improved services.
Currently there are concessions for children, students and Gold Card holders as well as free 30
minute transfers. While they help improve patronage by making it cheaper for those target age
groups, the costs are met by those who do not fit in those age brackets. The removal or reduction of
the FRR would allow more actions to be taken to increase patronage such as fare caps, larger
discounts for students or family discounts.
15Recommendations for the Auckland Context
Daily Fare Caps
This report recommends the introduction of Daily Fare Caps based on the number of zones
travelled through. The use of round numbers for the proposed Fare Caps is for a more
legible user experience, similar to that of the flat fares model.
Fare Zones in Current Structure (2019) AT HOP Fare (NZD) Proposed Daily Fare Cap (NZD)
1 Zone 1.95 5.00
2 Zones 3.45 7.50
3 Zones 4.90 9.00
4 Zones 6.30 12.00
5 Zones 7.60 14.00
6+ Zones 8.90-12.20 16.00
Figure 4 Proposed Daily Fare Caps
A Daily Fare Cap for 6+ zones will give the heaviest subsidy to those who travel the furthest. This
reflects that those who travel the furthest are typically forced to do so due to rents being cheaper
further from the City Centre. These commuters typically suffer from less stable income streams as
well as relative transport poverty. We are also not proposing a daily cap for City Link users.
This policy could later be expanded to include weekly and monthly caps to mirror Sydney.
16Tertiary Student Discount
The current Tertiary Discount promises a minimum 20% discount for those with a student
concession.
Zone HOP Adult Fare HOP Tertiary Fare
City Link 0.50 0.40
1 zone 1.95 1.50
2 zones 3.45 2.60
3 zones 4.90 3.75
4 zones 6.30 4.90
5 zones 7.60 5.85
6 zones 8.90 6.85
7 zones 10.00 7.70
8 zones 11.10 8.40
9 zones 12.20 8.80
Figure 5 Current Tertiary HOP Fares
Despite the discount it can still be cheaper for two students to carpool and pay for parking than use
public transport for two zones. A change to standardise the student discount at 50% of AT HOP fares
and proposed daily fare cap would mirror Melbourne and reduce the number of students who drive,
not just to their tertiary institution but for all trips.
17Increasing the free transfer time period to 1 hour
The New Network has been designed around connections between buses and trains to allow a more
efficient use of resources. To support this a 30 minute free transfer was introduced, allowing users
to pay a single fare for their journey instead of a separate fare for each service travelled on. While
this works for most journeys, there remains some bus routes, including the new 995 route between
Warkworth and the Hibiscus Coast Bus Station, with only hourly services off-peak. This means
someone transferring from an NX1 who misses the hourly service would be forced to pay and extra
$2.40 as well as wait an hour. Although having all services running at 30 minute frequencies all day
would be the ideal solution. A change to 1 transfers would offer more security for those using our
less frequent routes. This would also encourage more ‘multipurpose trips’ where the user may stop
to run errands, shop or have meetings before continuing their journey at no extra cost. This would
align with the vision for an ‘All Day Network.’
Weekend and Six-Hour Unlimited Pass Add-Ons for Hop Cards
At present, Auckland Transport only provide a daily and monthly pass to Hop cardholders, available
as top ups at automatic ticketing machines at train stations and major bus stops. Introducing
additional add-ons would increase the options available to passengers, which would exponentially
increase revenue from those who travel frequently. The Dutch experience with OV-chipkaart
demonstrates that the addition of more travel choices for passengers increases revenues for
transport operators to a significant extent, which bolsters the argument in favour of these add-ons
being rolled out across all ticketing platforms.
18Free travel for children under 12 and everyday 99 cent child fares for those who are
12 to 15 years old.
It is currently expensive for families to use Public Transport with separate fares each. The current
fare structure to address this allow children under 5 years travel for free with a paying adult,
discounts for those with child concessions loaded on their HOP Card and $0.99 weekend fares.
CHILD HOP FARES
City Link $0.30
1 zone $1.05
2 zones $2.05
3 zones $2.90
4 zones $3.70
5 zones $4.50
6 zones $5.15
7 zones $5.60
8 zones $6.00
9 zones $6.30
Figure 6 Current Child HOP Fares
The age for free travel should be raised to 12 with those age 5-12 not needing to be with a paying
adult. The $0.99 should be extended to every day to help create a public transport culture in future
generations and reduce the number of car journeys taking children to schools.
19Free Weekends
Councillor Chris Darby recently proposed that under 15’s should travel for free on public transport
on weekends as a measure to incentivise families to use Public Transport. The current fares system
means it is usually cheaper to drive than pay for multiple tickets on public transport. This is the most
likely time of the week for families to be travelling together and could be easily implemented with
bus drivers discretion for recognising families travelling together. At Train stations which are gated it
would be at the discretion of the gate manager and on the trains it would be at the discretion of the
ticket inspectors.
Generation Zero supports this measure, but sees it as a stepping stone to free weekends for
everyone. This would incentivise Public Transport when traffic conditions make driving more
favourable and help drive patronage growth until major infrastructure projects like the City Rail Link,
Light Rail and the Busway works are complete.
Either option would boost weekend patronage and make Public Transport a genuine travel option
for families and groups travelling together, while reducing weekend traffic and emissions.
Introducing a Disposable Paper-based Hop Card for Tourists
Cash Fares on the Auckland’s Public Transport network are significantly more than the HOP cards
fares. Introducing a disposable thick-paper-based RFID-embedded Hop card is designed to
encourage HOP card usage which speeds up the boarding process. However, this policy has a
negative impact on visitors ability to access public transport. This paper HOP card would have an
expiry date of 7 days after purchase, for the price of $2, to which the user can add credit at ticketing
machines. The number of these machines would need to increase at visitor entry points to the
region like the Cruise Ship Terminal and Auckland International Airport.
20Providing a $6 credit on all new Hop Cards
Currently a HOP Card is $10 to purchase and the user must load credit at extra cost.
HOP cards coming pre-loaded with credit would increase public transport accessibility
for those from lower socio-economic backgrounds who often struggle with the upfront
cost of the HOP Card system and revert to cash fares which ultimately cost more in
the long run. By providing the $6 credit the HOP Card is effectively only $4 which is
much more affordable for those struggling to make ends meet.
Funding
Removal of the Farebox Recovery Ratio would require an increase of funding from either Auckland
Council through Auckland Transport or from the National Land Transport Fund and the NZTA or a
combination of both. This report recognises that different regions have different priorities. The
removal of the Farebox Recovery Ratio would allow each region to choose if they spend extra
funding trying to grow public transport or keep the status quo. In Auckland’s case it would then have
the independence to fund the recommendations given in this report.
21Conclusions
The Farebox Recovery Ratio and resultant fare increases block Auckland from meeting its public
transport potential. Australian cities have reduced public transport fares by introducing fare caps,
and Tallinn has adopted a fares-free public transport model. Other cities in Europe and North
America have incentivised public transport through peak and off-peak pricing, as well as mode-
switching incentives. In New Zealand, Queenstown has achieved this by adopting a flat fares model,
creating a more legible fare system and boosting ridership by over 150% while also increasing
revenue.
Further fare increases will minimise the potential impact of major infrastructure projects, such as the
City Rail Link and Light Rail, and ultimately result in the failure of Auckland’s public transport as a
public service. The fares must work in favour of the people who use public transport; this can involve
discounts for students and families, as well as fare caps and extended free transfer windows.
Passengers who will benefit from these initiatives the most may struggle with inner city rent prices
and consequently have long-distance commutes.
Auckland’s public transport is currently at a tipping point. We can continue to treat our ‘public’
service like a commodity and rely on fares to pay for operational costs, dampening any chance of the
system advancing from an accessory transport alternative for the few who can afford it. Or we can
mobilise Aucklanders by reducing our reliance on fares--this will maximise the potential of large
infrastructure projects and transform the way all Aucklanders, of every socio-economic background,
think about transport.
22You can also read