Freezing Pressurized Water into a Standard Cylindrical Ice Sample in a Triaxial Cell
←
→
Page content transcription
If your browser does not render page correctly, please read the page content below
Hindawi
Geofluids
Volume 2021, Article ID 6678966, 17 pages
https://doi.org/10.1155/2021/6678966

Research Article
Freezing Pressurized Water into a Standard Cylindrical Ice
Sample in a Triaxial Cell

          Baosheng Wang ,1 Peixin Sun,1 Tingting Luo,1,2 Tao Zhang,1 and Weihao Yang                                             1,2

          1
            State Key Laboratory for Geomechanics and Deep Underground Engineering, China University of Mining and Technology, Xuzhou,
            Jiangsu, China
          2
            School of Mechanics and Civil Engineering, China University of Mining and Technology, Xuzhou, Jiangsu, China

          Correspondence should be addressed to Weihao Yang; whyang@cumt.edu.cn

          Received 27 October 2020; Revised 19 November 2020; Accepted 7 April 2021; Published 23 April 2021

          Academic Editor: Chun Zhu

          Copyright © 2021 Baosheng Wang et al. This is an open access article distributed under the Creative Commons Attribution License,
          which permits unrestricted use, distribution, and reproduction in any medium, provided the original work is properly cited.

          The mechanical characteristics of high-pressure frozen ice are a basis for the design of deep underground frozen walls, the drilling
          of thick permafrost and ice sheets, and the probing of extraterrestrial ice. The continuous control of the sample stress state from
          freezing to testing is essential for the experimental study of in situ mechanical response of high-pressure frozen ice. In the
          context, we developed a preparation technique for freezing pressurized water into a standard cylindrical ice sample in a triaxial
          cell. Through theoretical analysis, a cylindrical water sample with precise dimensions and strong sealing was fabricated using
          heat shrinkable tubing, sectional end caps, and an assembly cylinder. A mounting device was designed to insert the water
          sample into the triaxial cell without deformation. In order to deal with the lateral surface irregular of the resulting ice sample
          caused by freezing expansion, we proposed a pressurization method in which the volume of the confining medium is controlled
          to restrict the radial deformation of the sample, and the axial pressure on the sample is kept constant; thus, the freezing
          expansion will develop along the height direction through releasing the expansion pressure. Based on the analysis of sample
          deformation and finite element numerical simulations, the control method of the temperature fields of the sample and the
          confining medium was obtained, and the standard cylindrical ice sample which satisfies the geometric accuracy requirements was
          produced. The comparison of ice samples frozen by different freezing methods showed that the control of the confining medium
          mean temperature and the sample unidirectional freezing is necessary to improve the dimensional precision of the ice sample.

1. Introduction                                                          to be drilled and sampled [13], which restricts the process of
                                                                         related scientific investigation. To solve these problems, the
As the underground resource exploitation goes deeper, engi-              mechanics experiments of deep frozen soil [14–16] and fro-
neering disasters have become increasingly prominent in                  zen rock [17–19] have been widely studied, whereas little
unstable aquifers [1–6], and the artificial ground freezing is            attention has been paid to the coupling problems of ice-
the primary sinking method in such thick stratum [7]. The                soil and ice-rock and the mechanical characteristics of the
frozen depths of alluviums and aqueous strata have reached               ice in deep environment are the basis of the above prob-
750 m [8] and 950 m [9], respectively. However, due to the               lems. Compared with the shallow layer conditions, the for-
inadequate understanding of the formation mechanism of                   mation pressure of deep underground surges dramatically;
frozen soil and frozen rock in deep underground, the static              coupled with the ground restrictions imposed on frost
[10] and dynamic [11] responses of deep frozen wall mea-                 heave, the freezing pressure of deep underground water
sured in the field are obviously different from the theoretical            may be above 10 MPa. The influence of such high freezing
expectation. The depth of the permafrost in the Arctic can               pressure on the mechanical characteristics of the ice needs
exceed one kilometer [12], but the deep permafrost is difficult            to be further studied.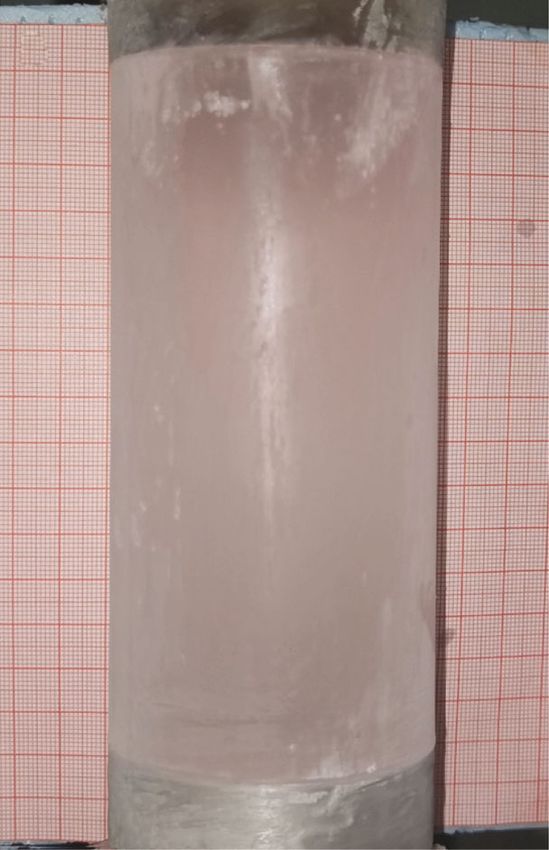
2                                                                                                                        Geofluids

    Lake Vostok in Antarctica lies beneath a 4 km thick ice        2. Ice Sample Size and Precision Standards
sheet [20]. The lake water is of great scientific value as it
has existed for a quite long history and was completely iso-       The size range of the cylindrical ice samples used in ice
lated from the outside world. At the beginning of this cen-        mechanics experiments is wide; the diameters range between
tury, a Russian scientific investigation team started drilling      18 mm and 100 mm, and the heights range from 40 mm to
the thick ice sheet to sample the lake water. However, before      260 mm [28–33]. According to the research of Kuehn et al.
drilling through the bottom of the ice sheet, the unexpected       [34], the results of mechanical tests of ice samples are nearly
accident that the lake water suddenly gushes into the drill        independent of the sample size when the ratio of height to
hole has occurred many times, resulting in poor sampling           diameter is fixed. Related studies [35–37] have indicated that
qualities [21]. Isotope studies showed that over 200 m thick       within the range of height/diameter ratios of 2–2.5, the radial
of bottom ice was frozen by high-pressure lake water [22];         constraints at the end planes can be neglected. Hence, we
thus, revealing the mechanical characteristics of high-            chose to prepare an ice sample of 61.8 mm in diameter and
pressure frozen ice can promote the drilling and sampling          125 mm in height, which is a standard sample size for
technology of thick ice sheet. Beside, high-pressure water         mechanical tests of frozen soil.
icing also exists in extraterrestrial aqueous environments.            The proposed preparation technique involves freezing
For instance, the liquid water of Europa is stored beneath         the water sample under soft lateral constraints. Due to freez-
an ice layer of approximately 150 km in thickness, and a           ing expansion, the lateral surface of the resulting ice sample is
substantial part of basal ice was accreted by high-pressure        easy to be irregular. However, neither previous ice sample
water [23]. As the observation of ice shell rheology is one of     preparation techniques [26, 38] nor ice mechanical test
the principal means to explore the extraterrestrial liquid         standards [39] have specifically mentioned the geometric tol-
water resources, whether freezing pressure affects the rheo-        erances of the samples. Because the accuracy in the radial
logical characteristics of ice is worth to be studied.             dimension directly influences the test results, we therefore
    The control of the sample stress state in the processes of     employed sample dimension tolerances from rock test stan-
sample preparation and experiment is a key technique of            dards [40], which specify that the lateral surface of a cylindri-
the experimental study of high-pressure frozen ice. At             cal sample should be straight to within 0.5 mm over the full
present, the preparation technique of ice sample mainly            height. In addition, the relative error between the average
includes three steps, first freezing water (from the top            diameter and the design value should be no more than
down) into large-scale ice mass in a tank, then the ice            0.5% to limit the error on the cross-sectional area of the cyl-
samples need to be drilled, cut, and ground to the standard        inder to less than 1%. Accordingly, the average diameter of
shape, and finally the ice samples are transferred from the         our ice sample should be within 61:8 ± 0:3 mm. The height
preparation apparatus into the test equipment [24–26].             error of the sample has no obvious effect on the test results,
Although this preparation technique can apply freezing             but considering the requirements on the height/diameter
pressure by adding a hydraulic system to the tank, it is still     ratio, the ice sample height should be within 125 ± 1mm.
inaccessible to the control of the sample stress state during
freezing. In addition, in the processes of sample shaping          3. Preparation of a Cylindrical Water Sample
and transfer, the stress state of the ice sample cannot be
controlled, and some negative stress paths will inevitably         The first procedure of the preparation technique is to
be produced, such as the sudden relief of freezing pressure.       produce a cylindrical water sample. Unlike solid materials,
These stress paths may cause stress concentrations, micro-         liquids have no definite shape; therefore, the geometry of a
cracks, and other defects in the ice sample [27], leading to       water sample must be formed and maintained by its packag-
inaccurate testing results, meaning that the effect of the          ing. Thus, we planned to fabricate a cylindrical package with
freezing pressure cannot be fully reflected. Accordingly, a         a soft flank and then inject water into it. Water expands by
preparation technique that enables continuous control of           9% in volume when frozen to ice Ih [41], and the preparation
the sample stress state from freezing to testing is required       technique would force the freezing expansion to develop
to carry out suitable mechanical experiments on ice frozen         along the height direction. Hence, the ratio of the ice sample
under high pressure.                                               height to the water sample height will be 1.09, and the desired
    To address the challenges above, we proposed a process         water sample dimensions are therefore 61.8 mm in diameter
that consists of first preparing a cylindrical water sample,        and 114.7 mm in height.
then pressurizing the water sample in a triaxial cell, and
finally freezing it into a standard cylindrical ice sample under    3.1. Flexible Membrane. The cylindrical sample to be pressur-
stable pressure. After freezing is complete, the stress state of   ized in the triaxial cell should be centred between two rigid
the ice sample can be transitioned from the freezing pressure      end caps and wrapped in a flexible tubular membrane to pre-
state to the test conditions in a controllable way. Because of     vent the confining medium from coming into direct contact
the flexible side constraints of such a cylindrical sample, the     with the experimental material. Our novel preparation tech-
sample lateral surface is easy to be irregular during the          nique also requires the membrane to maintain the geometry
fabrication and insertion of a water sample and the freezing       of the water sample. This means that the perfect membrane
process. Hence, it is necessary to conceive a technique for        should not only possess sufficient stiffness and thickness to
shaping and sealing a water sample and then conduct the            resist the initial internal water pressure and prevent the water
study of the pressuring and freezing techniques.                   sample from bulging beyond its limit but also be soft enough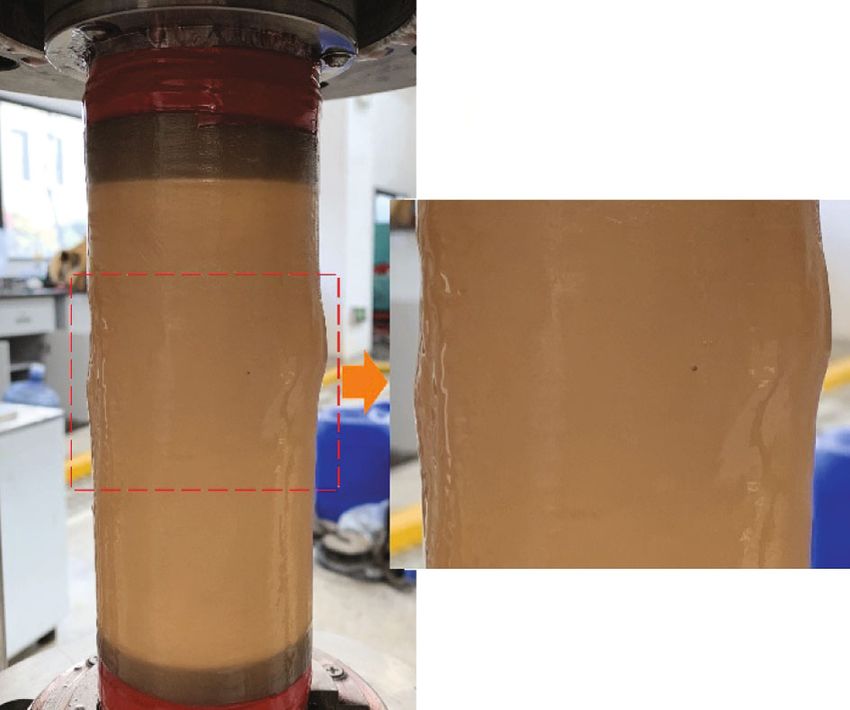
Geofluids                                                                                                                               3

                                                                                r

                                               r

                                                                                                   Δrmax
                               hw                              Δrmax   pc      pw           pw      pc
                                              pw0     pw0

                                                    (a)                               (b)

Figure 1: Mechanical models of the flexible tubular membrane: (a) bulging due to the initial internal water pressure and (b) compressed by
confining pressure.

that the confining pressure can be transmitted without                  within the geometric tolerance. By substituting Δr max ≤ 0:25
reduction. Because the deformation resistance of the mem-              mm, p = pc − pw , and the E and t values of the heat shrinkable
brane is much weaker than that of the end caps (steel), the            tubing into equation (1), pc − pw ≤ 0:016 MPa is obtained.
mechanical model of the tubular membrane can be simplified              This difference is far less than the planned confining pressure
as a thin-walled cylindrical shell with fixed ends (Figure 1). It       (at least 10 MPa), meaning that pc is approximately equal to pw
is difficult to solve this model under a linearly varying radial         and the transmission rate for the confining pressure is close to
pressure, which is the actual distribution of the initial inter-       a hundred percent. Therefore, we selected heat shrinkable tub-
nal water pressure. We therefore assume that the maximum               ing as the flexible membrane.
water pressure is equally distributed inside the sample to
estimate the bulging deformation (Figure 1(a)), such that              3.2. Fabrication of the Cylindrical Water Sample. Two prob-
the initial internal water pressure is pw0 = γw hw , where γw is       lems needed to be solved for the fabrication of the cylindrical
the specific gravity of water and hw is the height of the water         water sample. One was that a cylindrical supporting structure
sample. The maximum radial displacement of the model,                  must initially be centred between the two end caps to support
Δr max , under a uniform pressure p can be calculated as [42]          the shrunken size of the heat shrinkable tubing, and it must
                                                                       be able to be removed after shrinkage. The other was that
                                                                       the sealing between the heat shrinkable tubing and the end
                                     pr 2
                          Δr max =        ,                   ð1Þ      caps should prevent not only the inflow of the confining
                                     Et                                medium but also outward seepage of the water, which cannot
                                                                       be achieved through the traditional method of arranging
where r, E, and t are the radius, elastic modulus, and thickness,      sealing rings on the sides of the end caps. To address these
respectively, of the membrane. On the basis of the geometric           problems, we developed the sample package fabrication pro-
tolerance of the ice sample, Δrmax should be no greater than           cess depicted in Figure 2. One of the two end caps was
0.25 mm. Substituting p = pw0 into equation (1), we obtain             divided into an outer cap and an inner cap with a threaded
Et ≥ 4:4 MPa mm. The typical membrane materials used in                connection. A water injection hole equipped with a closure
triaxial tests of ice, frozen soil, and rock are separately            bolt was introduced into the other end cap on the central
indium [43], rubber [44], and heat shrinkable tubing [45,              axis. An assembly cylinder consisting of an inner location
46]. Among them, indium is expensive, complicated to form              column and an outer split tube was machined. The location
into a thin cylinder, and with low radioactivity. The elastic          column consists of two concentric sections: a long section
modulus and thickness of a typical rubber jacket are approxi-          whose diameter is equal to the inside diameter of the outer
mately 6 MPa and 0.5 mm, respectively, which means that                cap and a short section with the same diameter as the water
such a jacket would allow our water sample to bulge past its           injection hole. The split tube is divided into four pieces along
limit. By contrast, PVC heat shrinkable tubing has an elastic          the circumferential direction, with the same external dimen-
modulus of approximately 150 MPa and a thickness of                    sions and internal diameter as the water sample and the outer
0.4 mm after shrinkage, allowing it to maintain the dimensions         cap, respectively. During the fabrication process, first, the
of the water sample. The mechanical model of the water                 outer cap and the end cap are separately placed around the
sample compressed by confining pressure pc is shown in                  ends of the location column, and the split tube is fitted
Figure 1(b), where pw is the internal water pressure. Under            together around the outside to compose the assembly cylin-
these circumstances, the radial deformation should remain              der (Figure 2(a)). Note that the split tube must be in direct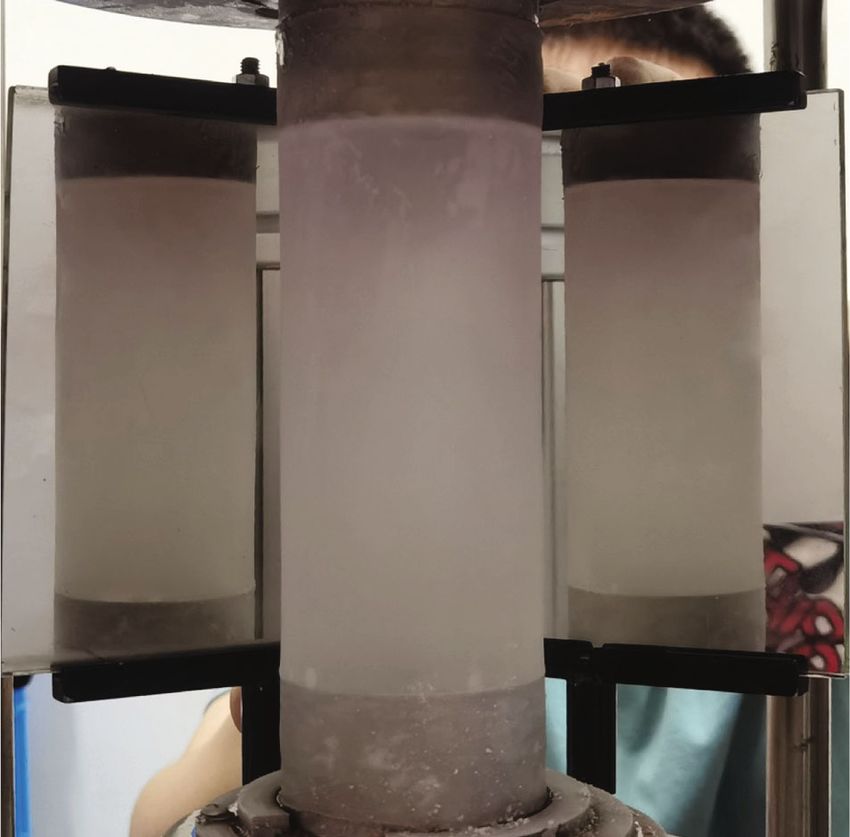
4 Geofluids
Split tube A End cap Heat shrinkable tubing
End cap
Location
column Injection
Inner cap
hole
Outer cap Outer cap
A A-A
(a) (b)
Figure 2: Fabrication process for the water sample package, including (a) the composition of the assembly cylinder and (b) the completed
state of the water sample package.
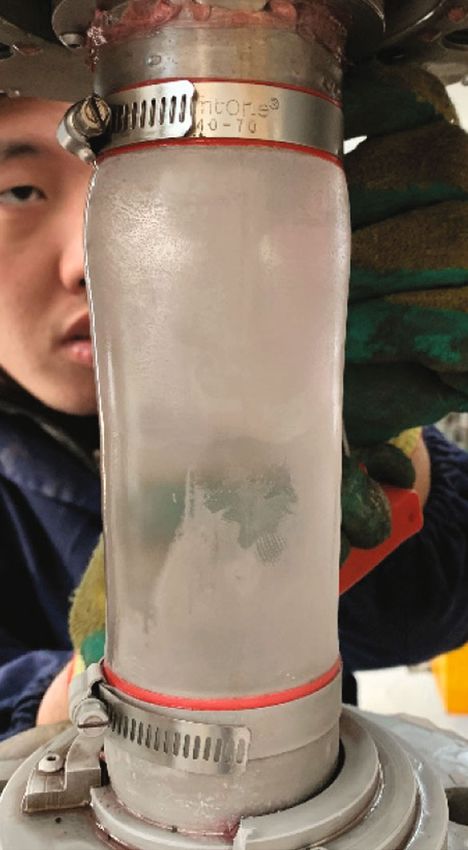
(a) (b)
Figure 3: The fabricated water sample: (a) the side lengths of a big square and a small one in the grid is 1 cm and 1 mm, respectively, and (b)
the included angle of the mirrors is 120°.
Table 1: Physical properties of three commonly used low-
temperature hydraulic fluids, as provided by the manufacturers.
Hanger
Hanger rod Bulk
Pour Volume thermal
modulus
point (°C) expansion (°C)
Pressure (GPa)
vessel Low-temperature
Fixed -35 1.6 7:8 × 10⁻⁴
Plunger hydraulic oil
platform
Dimethyl silicone
-60 1.1 9:9 × 10⁻⁴
oil
End Water
Aviation hydraulic
caps sample -65 1.4 9:8 × 10⁻⁴
oil
Baseplate
Lifting
Figure 3 shows that the lateral surface of the fabricated water
platform
sample is quite straight.
3.3. Insertion of the Water Sample. As the water sample has
Figure 4: Mounting device. no deformation resistance to bear the gravity of the end cap
and the plunger, measures should be taken to maintain the
contact with the two caps. Then, a type of flexible adhesive relative positions of the upper and lower ends of the water
with low-temperature resistance and a slow curing speed is sample invariant during the insertion process. For this rea-
daubed onto the sides of the caps. Heat shrinkable tubing is son, we designed a mounting device shown in Figure 4, which
placed around the whole structure and heated to tightly wrap mainly consists of a fixed platform and a lifting platform. The
the caps and split tube. After the adhesive is fully cured, the pressure vessel is clamped at the centre of the fixed platform.
location column and the split tube are removed in turn The lifting platform is equipped with a hanger and two
through the outer cap. Finally, by fastening the inner cap to hanger rods. The plunger is suspended inside the pressure
the outer cap, the water sample package is completed vessel by the hanger rods, and the baseplate is placed on the
(Figure 2(b)). After filling the package with degassed distilled lifting platform. The central axes of the plunger, the pressure
water through the water injection hole and then tightening vessel, and the baseplate are aligned. During the insertion of a
the closure bolt, the final cylindrical water sample is obtained. water sample, its upper and lower end caps are fastened to the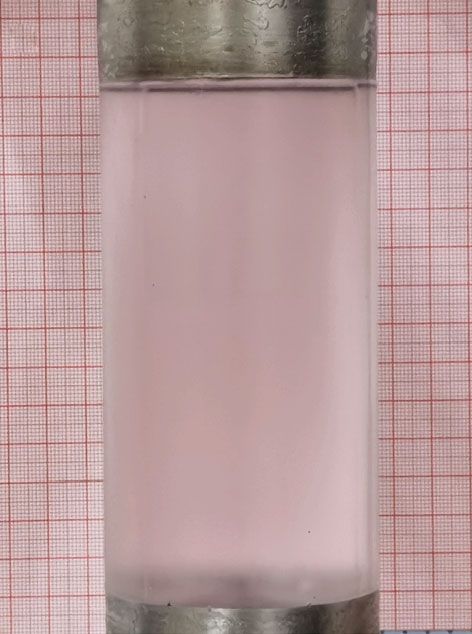
Geofluids                                                                                                                               5

                                                                                                Load cell
                                                                                                Insulation layer
                                                              Load frame

                          Circulation                                                           Triaxial cell
                         thermostat A                                                           Insulation jacket

                                                                                                Thermistor

                                                                                                     Acquisition
                                                                                                     instrument
                          Circulation
                         thermostat B                           Sample
                                                                                                      Pressure
                                                                                                      volume
                         Insulation layer                                                            controller

                          Circulation                                                                 Injection
                         thermostat C                                                                  pump

                                                                                                     Cryogenic
                           Loading ram                                                               incubator

                 Figure 5: Schematic diagram of the KTL-401 servo-controlled low-temperature triaxial testing system.

plunger and the baseplate, respectively. Then, the lifting plat-                           pc            pa            pc
form synchronously raises the plunger and the baseplate. As
a result, the water sample is inserted without deformation.
                                                                                                      End cap

4. Pressurization Method
                                                                                                         pw
4.1. Apparatus. The water sample is pressurized and frozen                            pc                                    pc
by a KTL-401 servo-controlled low-temperature triaxial test-                                    pw                pw

ing system, which is codeveloped by China University of
                                                                                                      Sample
Mining and Technology and KTL Instruments Company. It
is capable of imposing an axial load of up to 400 kN and                      Symmetry                                      Symmetry
                                                                                plane                   Heat                  plane
the confining pressure of up to 64 MPa with an accuracy of                                  pt        shrinkable        pt
0.05%. The triaxial cell is cooled by circulating refrigerant                                          tubing
from three circulation thermostats, A, B and C, passing
through the upper, lateral, and lower freezing channels of           Figure 6: Mechanical model of the water sample under stable
the cell, respectively. The triaxial cell temperature is con-        pressure.
trolled by regulating the temperature of the circulation ther-
mostats (adjustable down to -60°C in increments of ±0.1°C).          ation hydraulic oil as the confining medium because its com-
A 60 mm thick insulation jacket is wrapped around the cell to        pressibility and thermal expansion are lower than those of
prevent excessive inward heat flow from the surroundings,             dimethyl silicone oil.
and two 1 mm thick insulation layers are placed at the top               Before the pressurization process, the aviation hydraulic
and bottom of the cell to reduce the cooling energy loss to          oil is first subjected to a vacuum of -0.1 MPa for 24 h to
the load frame. The internal temperature of the triaxial cell        remove air bubbles; then, it is sealed and stored in a cryogenic
is measured by two thermistors with a resolution of 0.01°C,          incubator for at least 24 h to be cooled to a sufficiently low
which are threaded through the lateral wall and connected            temperature. After that, the oil is injected by an injection
to an acquisition instrument.                                        pump whose inlet and outlet pipes are connected to the cryo-
                                                                     genic incubator and the triaxial cell, respectively (Figure 5).
4.2. Confining Medium Injection and Pressurization. The               The injection pump and the connecting pipes are insulated
choice of confining medium was dictated by the require-               to maintain the temperature of the oil during injection. Once
ments that the medium should remain fluid at low tempera-             the injection process is completed, within approximately 30 s,
ture and its volume should be little influenced by changes in         the water sample is pressurized to a given pressure at a speed
temperature and pressure. Three commonly used low-                   of 0.2 MPa s-1 by a pressure volume controller. During oil
temperature hydraulic fluids were compared (Table 1).                 injection and pressurization, the height of the water sample
Because of its high pour point, low-temperature hydraulic            is kept constant by the load frame.
oil loses fluidity below -35°C; therefore, it is difficult to be
injected and inappropriate for pressure conduction at such           4.3. Pressure Stabilization. After the pressure of the water
low temperatures. Between the other two fluids, we chose avi-         sample reaches the given value, the water sample must be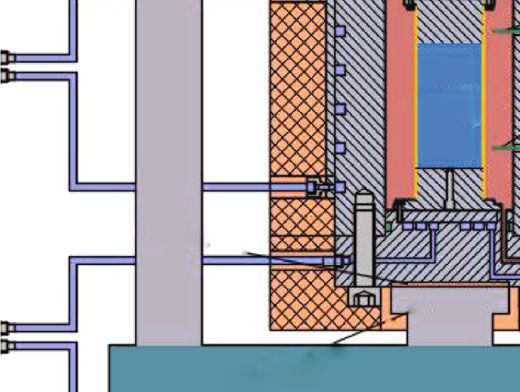
6                                                                                                                           Geofluids

                                                                              Sample

                                                    Sample

                                                     (a)                       (b)

                                                                          x

                                                    Sample
                                                                          Δrmax
                                                                                       h

                                                                     Δr

                                                     (c)                       (d)

Figure 7: Radial deformation of the sample caused by (a) water cooling, (b) water compression, and (c) the thermal volume change of the
confining medium and (d) the deformation model.

frozen under stable pressure. To force the freezing expansion        where Aa and At are the cross-sectional areas of the end cap
to develop along the height direction of the sample, the quan-       and the heat shrinkable tubing, respectively, and can be easily
tity of the confining medium in the triaxial cell is locked by        calculated from the dimensions of the water sample package.
the pressure volume controller, and the sample pressure is           According to the mechanical analysis of the heat shrinkable
then controlled by the load frame, which is set to apply a con-      tubing presented in Section 3.1, pc = pw was obtained in the
stant axial pressure. When freezing expansion occurs, the            radial direction of the sample. Thus, equation (2) is con-
radial deformation of the sample is restricted by the stable         verted into
volume of the confining medium, and the freezing expansion
develops along the height direction as the expansion pressure                              pc = 1:03pa + 0:027pt :                 ð3Þ
releases.
     The mechanical model of the water sample under stable
                                                                         The material used as the heat shrinkable tubing is a kind
pressure is shown in Figure 6. Along the height direction,
                                                                     of PVC film. Uniaxial tensile tests [47, 48] have indicated that
the axial pressure pa applied by the load frame, the tensile
                                                                     the stress-strain relation of such PVC film is linear in a strain
stress of heat shrinkable tubing pt produced by the extension        range of 0-20%. Hence, the heat shrinkable tubing exhibits
of the sample, the confining pressure pc , and the internal           linear deformation during sample extension, that is,
water pressure pw have the following relation:
                                                                                                          Δh
                                                                                                 pt = E      ,                     ð4Þ
                  pa Aa + pc At + pt At = pw Aa ,            ð2Þ                                          hw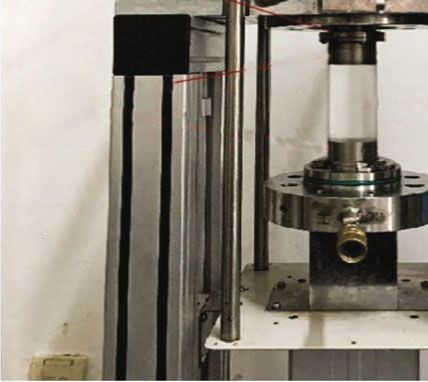
Geofluids                                                                                                                            7

where Δh is the increase in the sample height, hw is the height
of the water sample, and E is the elastic modulus of the PVC
heat shrinkable tubing. Substituting equation (4) into (3), we
obtain

                      pc = 1:03pa + λΔh,                   ð5Þ

where λ = 0:035 MPa/mm. We can see that pc is slightly
greater than pa . Because pa is constant controlled by the load
frame, pc increases linearly with Δh by a gradient of
0.035 MPa/mm. Ideally, the sample should extend 10.3 mm
in the height direction due to freezing expansion; thus, the
total increment in pc during freezing will be approximately
0.36 MPa.

5. Freezing Technique
                                                                                              Sample
Given the pressurization method described above, the freezing
                                                                                              Atmosphere/
technique should satisfy the following three requirements:                                    aviation hydraulic oil

                                                                                              304 stainless steel
   (1) Although the quantity of the confining medium in
       the triaxial cell is locked by the pressure volume                                     Insulation jacket

       controller, the volume of the confining medium still                                    Insulation layer
       depends on its temperature. Hence, the mean tem-                                       Heat shrinkable tubing
       perature of the confining medium should be con-
       trolled in order to control its volume                     Figure 8: Finite element model of the triaxial cell and its internal
                                                                  components.
   (2) The freezing form of the sample should be unidirec-
       tional (along the central axis)                                    the ratio of volumetric change of water. The water is
   (3) The whole sample freezing process should occur                     cooled from room temperature (20°C) to the melting
       under stable pressure, which means that the sample                 point. According to the test results of Kell [49],
       should not begin to freeze before the completion of                during this cooling process, the water volume first
       pressurization                                                     decreases and then increases (the density of water is
                                                                          highest at 4°C), and the total ratio of volumetric
    As the confining medium mean temperature must be                       change is −1:63 × 10−3
below the melting point of water when the sample is being
                                                                      (2) The water sample is radially compressed during the
frozen, the aviation hydraulic oil should be maintained at a
                                                                          pressurization process (Figure 7(b)). According to
stable negative temperature from the injection of the oil to
                                                                          the results of the analysis presented in Section 3.1,
the completion of the sample freezing. To avoid the low-
                                                                          the confining pressure pc is approximately equal to
temperature oil being rapidly heated by the hot triaxial cell,
we designed an operating procedure in which the triaxial cell             the internal water pressure pw ; thus, the volumetric
is first precooled, and then, the precooled oil is injected and            compression of the water sample ΔV wp can be
the sample is pressurized, and finally, the sample is frozen               expressed as
under stable pressure.
                                                                                                                  V w pc
5.1. Analysis of Sample Radial Deformation. It is impossible                                   ΔV wp = −                 ,        ð7Þ
                                                                                                                   Kw
to control the mean temperature of the confining medium
without any error. To determine the permissible range of var-             where K w = 2:2 GPa is the bulk modulus of water [50]
iation of the mean temperature, we analysed the radial defor-
mation of the sample during pressurization and freezing,              (3) When the sample is frozen under stable pressure, its
which is mainly caused by the following three phenomena:                  radial deformation is controlled by the volume of
                                                                          the confining medium (Figure 7(c)), which varies
   (1) The water sample shrinks radially when being cooled                with the mean temperature of the confining medium.
       (Figure 7(a)), leading to a sample volume reduction                This volume change, ΔV c , can be calculated as
       ΔV wc , which can be calculated as
                                                                                               ΔV c = βc V c ΔT c ,               ð8Þ
                           ΔV wc = αw V w ,                ð6Þ
                                                                          where βc is the volume thermal expansion coefficient
        where V w is the volume of the water sample and αw is             of aviation hydraulic oil (Table 1), V c = 2:2 × 10⁶ m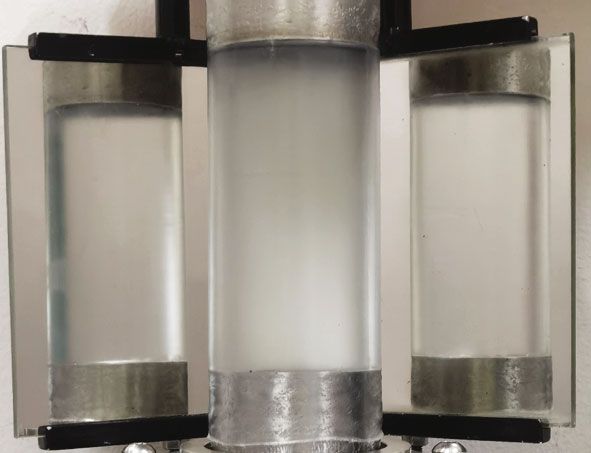
8                                                                                                                                            Geofluids

Table 2: Material parameters of the finite element model. The water and ice parameters were taken from Blue [56], Slack [57], Gu and Stefan
[58], and Ramires et al. [59]; the 304 stainless steel parameters were taken from Cubberly et al. [60]; the atmospheric parameters were from
Tsilingiris [61]; and the parameters of the other components were provided by the manufacturers.

                                                    304 stainless     Heat shrinkable       Aviation                         Insulation     Insulation
                              Water           Ice                                                             Atmosphere
                                                        steel             tubing          hydraulic oil                         layer         jacket
Density (kg m-3)              1000 920                  7930               1400               865                  1.293       1500           100
Heat capacity (kJ kg-1°C-1)   4200 2100                 500                1200               2100                 1004        1400           2250
Thermal conductivity
                              0.58            2.3        15                 0.2               0.15                 0.025       0.15           0.05
(W m-1°C-1)

        m3 is the initial volume of the confining medium in                        numerical simulations to indirectly acquire information on
        the triaxial cell, and ΔT c is the change in the mean                     the temperature in the triaxial cell. A finite element model
        temperature of the confining medium                                        of the triaxial cell and its internal components was built in
                                                                                  the ANSYS software (Figure 8). In this model, all compo-
    To comprehensively consider the above three factors, we                       nents have the same dimensions as in the actual condition
established a deformation model of the sample, which is                           except the sample, which has a fixed size equal to that of
shown in Figure 7(d). The relation between the volume                             the ice sample, meaning that freezing expansion is neglected.
changes caused by these three factors and the radial deforma-                     The material parameters of the model components are
tion of the sample is                                                             shown in Table 2. According to the conclusions of Makita
                                 ðh                                               [52] and Otero et al. [53], the material parameters of water
                                                                                and ice change little within the temperature and pressure
       ΔV wc + ΔV wp + ΔV c =                πðr + Δr Þ2 − πr 2 dx,      ð9Þ
                                     0
                                                                                  ranges of the KTL-401 system, so they are taken to be equal
                                                                                  to their values under standard atmospheric pressure. The
where r is the sample radius. According to the analytical cal-                    latent heat of water freezing is 335 kJ kg-1 [54], but because
culations of Huang et al. [51], the deflection of the model can                    of the neglect of freezing expansion, the latent heat of the
be approximated as a sinusoidal curve, that is,                                   modelled sample is taken to be equal to that of water divided
                                                                                  by 1.09, which is 307.3 kJ kg-1. The freezing temperature of
                                              xπ                                water, T f , is affected by pressure and can be obtained through
                     Δr = Δr max sin              :                    ð10Þ       the iterative solution of the accurate regression formula
                                                h
                                                                                  reported by Wagner et al. [55]:
    The radial deformation of the sample should not exceed                                                     "          −3 #
the geometric tolerance. By substituting ∣Δr max ∣ ≤0:25 mm                                               6    Tf
into equations (6)–(9), the permissible variation range of                           1 − 0:626000 × 10 × 1 −                       + 0:197135 × 106
                                                                                                               Tn
the confining medium mean temperature can be simulta-                                      "   #
neously determined:                                                                              T f 21:2  p
                                                                                        × 1−              = f,
                                                                                                Tn         pn
           ΔT c ∈ ½−2:1 − 0:073pc , 1:6 − 0:073pc ° C,                ð11Þ
                                                                                                                                                     ð12Þ
where the unit of pc is MPa. The permissible variation range
can also be expressed as ½ð−0:25 – 0:073 pc Þ ± 1:85° C. This                    where T n = 273:16 K, Pf is the freezing pressure, and
means that once the sample begins to freeze, the volume of                        Pn = 0:000611657 MPa. The side of the model is in direct
the confining medium should be slightly decreased by chang-                        contact with the air, so the boundary conditions at these sur-
ing the mean temperature by ð−0:25 – 0:073 pc Þ° C to allow the                   faces correspond to convective heat transfer. Because the top
freezing expansion to develop to a small extent along the radial                  and bottom of the triaxial cell are engaged with the metallic
direction to compensate for the small radial shrinkage of the                     loading frame, which is directly exposed to air, the tempera-
water sample caused by cooling and compression, then the                          tures of these two surfaces are assumed to be constant. To
mean temperature of the confining medium should remain                             determine the boundary parameters, a pressurized freezing
constant until the sample is completely frozen, and the per-                      operation was implemented by circulating refrigerant at a
missible fluctuation of above temperature control is ±1.85°C.                      constant temperature of -25°C in the lateral freezing channel
                                                                                  to precool the triaxial cell for 30 min and then freeze the sam-
5.2. Finite Element Model. The essence of the freezing tech-                      ple under 20 MPa with an initial oil temperature of -15°C,
nique is to control the temperature field developments of                          and the measured temperature changes were recorded. Then,
the sample and the confining medium, and its basic require-                        a numerical simulation of the temperature field during the
ment is to know the real-time status and variation trend of                       above operation was carried out. The initial temperature of
the temperature field. However, the KTL-401 system has only                        the model in the simulation was set equal to the actual ambi-
two temperature measurement points, which are unable to                           ent temperature of 20°C. The freezing temperature of the
provide the necessary temperature data. Therefore, we used                        sample was determined by iteratively solving equation (12)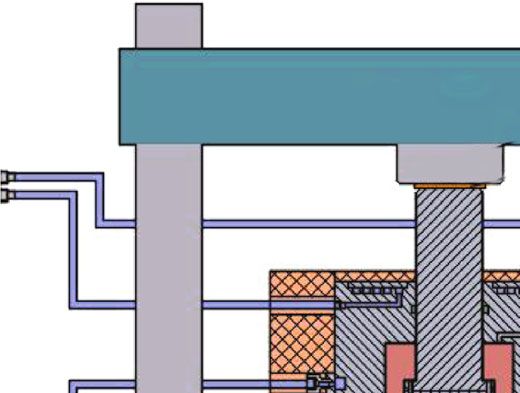
Geofluids                                                                                                                                9

                                        –6.0

                                       –10.5

                                       –15.0

                                       –19.5

                                       –24.0
                                               0      80       160      240        320     400    480

                                                                     Time (min)

                                                   Simulated temperature of upper point
                                                   Measured temperature of upper point
                                                   Simulated temperature of lower point
                                                   Measured temperature of lower point

                       Figure 9: Simulated and measured temperature changes at the two measurement points.

and was found to be -1.53°C. In the simulation of the precool-
ing of the triaxial cell, atmospheric properties (Table 2) were
assigned to the elements in the region of the confining
medium. Considering that the oil injection and pressuriza-                                                                      10°C
tion process takes only 3 min, this process was simplified as
instantaneous in the simulation. Once the oil was injected,
the properties of these elements were replaced with the mate-
                                                                                                                                0°C
rial parameters of the aviation hydraulic oil (Table 2), and the
instantaneous temperature of the corresponding nodes was
modified to the initial oil temperature. The boundary param-
eters were adjusted to cause the simulated temperature                                                                          –10°C
change at the measurement locations close to the measure-
ment results, and the definitive parameters were as follows:
the temperature and heat convection coefficient at the sides
                                                                                                                                –20°C
of the model were 20°C and 25 W m-2°C-1, respectively, and
the temperatures at the top and bottom of the model were
8°C and 13°C, respectively. The simulated and measured
temperatures at the two measurement points are shown in
                                                                                     (a)                    (b)
Figure 9. Because of both the neglect of the change in the
sample size and the simplification of the oil injection and                        Sample
pressurization process, which mainly affected the accuracy                         Atmosphere
of the simulation in the early stage, the differences between
the simulated and measured results prior to 240 min are                Figure 10: Simulated temperature fields in the finite element model
obviously larger than the differences after that time, and the          under cooling by (a) the lateral freezing channel and (b) the upper
maximum and minimum differences are 1.25°C and 0.5°C,                   and lower freezing channels with a constant temperature
respectively.                                                          constraint of -25°C for 40 min.

5.3. Freezing Method. Two problems needed to be solved to
realize the desired freezing technique. One was to determine           the confining medium to meet the three requirements pro-
which of the three freezing channels in the triaxial cell are          posed at the beginning of this chapter.
most appropriate to use for the precooling of the triaxial cell,           First, the evolution of the temperature field in the finite
oil injection and pressurization, and the freezing of the sam-         element model was simulated under 40 min of cooling with
ple, respectively. The other was to determine how to regulate          different freezing channels by a constant freezing channel
the temperatures of the three circulation thermostats to con-          temperature constraint of -25°C. According to the simulation
trol the temperature field developments of the sample and               results shown in Figure 10, the cooling energy of the upper
10                                                                                                                                                                  Geofluids

                                                               4

                                                               0

                                                             –12
                                                            –13.6

                                                             –30

                                                             –35

                                                             –40
                                                                    0        100       200         300       400      500          600

                                                                                                Time (min)

                                                                           Confining medium mean temperature
                                                                           Upper freezing channel temperature constraint
                                                                           Lateral freezing channel temperature constraint
                                                                           Lower freezing channel temperature constraint

Figure 11: Changes in the adjusted temperature constraints on the three freezing channels and the simulated mean temperature of the
confining medium under the conditions that the initial oil temperature is -12°C and the freezing pressure is 20 MPa.

                                                                                                                                         Confining pressure (kPa)
                                                   14                                                                            20440
                              Height change (mm)

                                                    7                                                                            20220

                                                    0                                                                            20000

                                                             –1.53°C

                                                             –8°C

                                                             –16°C

                                                             –24°C

                                                        0            110        220       330        440       550         660

                                                                                      Time (min)

                                                                Height change
                                                                Confining pressure

Figure 12: Changes in the simulated freezing state of the sample, the measured sample height, and the measured confining pressure over time
by the use of the freezing technique. The freezing state of the sample is shown through an axisymmetric plane, and the time corresponds to the
symmetry axis (left border of the plane).

and lower freezing channels can be rapidly transferred to the                                     pass through the whole triaxial cell, which means that the tri-
ends of the sample through the plunger and baseplate, which                                       axial cell must be effectively cooled before the sample begins
is suitable for freezing the sample, and the freezing effect of                                    to freeze. Therefore, the lateral freezing channel is more
the lower channel is better than that of the upper channel.                                       appropriately employed for precooling the triaxial cell as well
By contrast, the efficiency of cooling energy transmission                                          as during the oil injection and pressurization process, while
from the lateral freezing channel to the ends of the sample                                       the upper and lower freezing channels are more suited for
is comparatively low because the cooling energy must first                                         freezing the sample.
Geofluids 11
(a) (b)
Figure 13: Ice sample frozen by the freezing technique: (a) the side lengths of a big square and a small one in the grid are 1 cm and 1 mm,
respectively, and (b) the included angle of the mirrors is 120°.
Then, based on this usage of the freezing channels, a satis- (2) After the simulation of oil injection and pressuriza-
factory evolution of the temperature fields of the sample and tion, the temperature constraint on the lateral freezing
the confining medium can be simulated by adjusting the tem- channel is deleted, and the temperature constraints on
perature constraints of the freezing channels in simulation, the upper and lower freezing channels are adjusted to
and the results of simulated temperature constraints of freezing gradually form a gradient temperature field of cold in
channels can be used for the regulation of the temperatures of the lower and hot in the upper in the triaxial cell and
the circulation thermostats during the actual freezing operation. maintain the fluctuations of the mean temperature of
In the simulation, the sample is controlled to freeze in bottom- the oil within ±0.6°C
up direction, which is more efficient than top-down freezing
(Figure 10). According to equation (11), the control error of (3) Once the sample begins to freeze, according to
the mean temperature of the confining medium is ±1.85°C. equation (11), the temperature constraints on the
Considering that the maximum difference between the simu- upper and lower freezing channels are adjusted to
lated result and the actual measured temperature is 1.25°C slowly decrease the mean temperature of the oil by
(Figure 9), the mean temperature control tolerance in the sim- ð−0:25 – 0:073 pc Þ° C
ulation is reduced to ±0.6°C. In accordance with the actual oper- (4) After the mean temperature of the oil decreases by
ating procedures, the simulation was divided into four stages: ð−0:25 – 0:073 pc Þ° C, the temperature constraints on
the upper and lower freezing channels are adjusted
(1) The first stage corresponds to the simulation of the to stabilize the mean temperature of the oil at its cur-
processes of triaxial cell precooling and oil injection rent value and limit the fluctuations to within ±0.6°C
and pressurization. The temperature constraint on until the sample is completely frozen. Meanwhile, the
the lateral freezing channel and the precooling time sample should be controlled to freeze in bottom-up
are adjusted to limit the fluctuations in the simulated direction
mean temperature of the oil to less than ±0.6°C dur-
ing oil injection and pressurization. As mentioned 6. Preparation Results of Ice Samples
above, the 3 min process of oil injection and pressur-
ization is simplified as being completed instanta- 6.1. Use of the Freezing Technique. An ice sample was pre-
neously in the simulation; then, we use the 3 min of pared by the pressurization method and the freezing tech-
time after the activation of the aviation hydraulic oil nique with an initial oil temperature of -12°C and a freezing
properties to approximately simulate the develop- pressure of 20 MPa. The numerical simulation was firstly
ment of the temperature field during this period. If adjusted to obtain a satisfactory evolution of the temperature
the sample begins to freeze in this stage, it indicates fields of the sample and the confining medium, and the
that the initial oil temperature is too low, and the changes in the adjusted temperature constraints on the three
simulation should be restarted after properly increas- freezing channels and the simulated mean temperature of the
ing the oil temperature confining medium are shown in Figure 11. The pressurized12 Geofluids
125.33
120° A
100
12
Height position (mm)
0°
B 75
C
50
25
0
61.5 61.8 62.1
Diameter (mm)
A
B
C
(a) (b)
Figure 14: Ice sample diameter: (a) measurement intervals and (b) measurement results.
freezing operation was then performed by regulating the cir-
culation thermostats in accordance with the temperature
constraints determined from the simulation. During freezing,
as Figure 12 shows, the change in the sample height over time
coincided with the development of sample freezing, and the
total increase in the sample height was 10.15 mm, which is
close to the theoretical value. The confining pressure
increased with minor fluctuations, and the increments in
the confining pressure and sample height approached the lin-
ear relation expressed in equation (5).
After the sample was frozen, the freezing pressure was
slowly unloaded by a rate of 0.05 MPa/s with a condition that
the axial pressure is equal to the confining pressure. Then, the
ice sample was taken out and was observed with no visible
irregularities, as shown in Figure 13. The ice sample height
was measured to be 125.33 mm (noted that the ice sample
height slightly increased during the pressure relief), satisfying
the height requirement. The sample diameters were mea-
sured along the height direction three times with the same
circumferential interval of 120° (Figure 14(a)), and the mea-
surement results are shown in Figure 14(b). The maximum
and minimum diameters were 62.01 mm and 61.68 mm,
respectively; accordingly, the radial error was 0.33 mm,
within the specified dimensional tolerance. The average Figure 15: Ice sample frozen in bottom-up direction but neglecting
diameter was 61.92 mm, also within the specified limit. the change in the oil temperature.
6.2. Neglect of the Control of the Mean Temperature of the
Confining Medium. To verify the necessity of the control of and the freezing pressure were also -12°C and 20 MPa,
the mean temperature of the confining medium, an ice sam- respectively. The operations of triaxial cell precooling and
ple was frozen in bottom-up direction but neglecting the oil injection and pressurization were similar with those in
change in the oil temperature, and the initial oil temperature Section 6.1, and then, the sample was frozen in a gradientGeofluids 13
–9 20600
–13 20000
–17 19400
0 120 240 360 480 600 720
Time (min)
Oil mean temperature
Confining pressure
Figure 16: Changes in the simulated freezing state of the sample, the simulated mean temperature of the confining medium, and the
measured confining pressure over time under the conditions that the sample was frozen in bottom-up direction but the change in the oil
temperature was neglected. The freezing state of the sample is shown through an axisymmetric plane, and the time corresponds to the
symmetry axis (left border of the plane).
temperature field which was formed by separately circulating calculated from equation (11), and most of the temperature
refrigerants of 1°C and -30°C in the upper and lower freezing decreases occurred in the middle and later period of the
channels. During freezing, the confining pressure did not freezing. Therefore, the radial expansion of the top half of
monotonically increase, as concluded from the analysis in the sample cannot be properly limited due to the excessive
Section 4.3, but rather initially increased and then decreased, cold contraction of the confining medium. The results of
and the total increase in the sample height was only 6.3 mm, the above analysis confirmed the necessity of controlling
which is significantly lower than the theoretical value of the mean temperature of the confining medium.
10.3 mm. The resulting ice sample failed to satisfy the geo-
metric tolerance and showed marked swelling on the top half 6.3. Neglect of the Unidirectional Freezing of the Sample. To
(Figure 15). verify the necessity of the unidirectional freezing, an ice
To determine the reason for this swelling, the freezing sample was frozen under the condition that the mean tem-
process was analysed through a comprehensive comparison perature of the confining medium was controlled but the
of the changes in the simulated freezing state of the sample, sample was frozen with two freezing fronts developing
the simulated mean temperature of the confining medium, towards each other. The initial oil temperature and the freez-
and the measured confining pressure over time (Figure 16). ing pressure were also -12°C and 20 MPa, respectively. The
In the earlier stage of the sample freezing (0–200 min), the adjustment simulation was carried out with identical temper-
freezing rate of the sample was relatively fast, and the mean ature constraints on the upper and lower freezing channels.
temperature of the confining medium first increased 2.5°C The pressurized freezing operation was then performed by
and then decreased 2.5°C, meaning that the volume of freez- regulating the circulation thermostats in accordance with
ing expansion was larger than the volume contraction of the the temperature constraints determined from the simulation.
confining medium; consequently, the confining medium was During freezing, as shown in Figure 17, the confining pres-
compressed, and the confining pressure rose. After that, the sure slowly rose at a rate close to that indicated by equation
sample freezing was slowing, while the mean temperature (5) until the terminal phase, when it abnormally increased
of the confining medium steadily dropped, resulting in a by approximately 1.5 MPa. The total increase in the sample
reversal of the relationship between the volume of freezing height was 8.9 mm, which is lower than the theoretical value.
expansion and the volume contraction of the confining Most of the radial deformation of the ice sample was
medium; thus, the interaction between the sample and the restricted except a notable expansion at the middle position
confining medium weakened, and the confining pressure (Figure 18).
declined. During the whole freezing process, the decrease of To illustrate the reason for this middle expansion, the
the confining medium mean temperature was up to approx- development of the simulated freezing state of the sample
imately 8°C, more than double the permissible value 3.25°C was also shown in Figure 17. Then, we can see that the start14 Geofluids
10 21800
Height change (mm)
Confining pressure
(kPa)
5 20900
0 20000
–1.53°C
–8°C
–16°C
–24°C
0 70 140 210 280 350 420
Time (min)
Height change
Confining pressure
Figure 17: Changes in the simulated freezing state of the sample, the measured sample height, and the measured confining pressure over time
under the condition that the mean temperature of the confining medium was controlled but the sample was frozen with two freezing fronts
developing towards each other. The freezing state of the sample is shown through an axisymmetric plane, and the time corresponds to the
symmetry axis (left border of the plane).
7. Conclusions
A preparation technique for freezing pressurized water into a
standard cylindrical ice sample in a triaxial cell was devel-
oped, in which the dimensional accuracy of the ice sample
is guaranteed by the following measures:
(1) A cylindrical water sample with precise dimensions
and strong sealing is fabricated using heat shrinkable
tubing, sectional end caps, and an assembly cylinder,
and a specially designed mounting device is used to
maintain invariant relative positions between the
upper and lower ends of the water sample during
the insertion of the water sample into the triaxial cell
(2) During freezing, the quantity of the confining
medium in the triaxial cell is locked by a pressure vol-
ume controller to restrict the radial deformation of
Figure 18: Ice sample frozen with two freezing fronts developing the sample, and the pressure on the sample is
towards each other. The middle expansion is shown with double controlled by the load frame, which is set to apply
magnification. constant axial pressure. This ensures that freezing
expansion will develop along the height direction
through releasing the expansion pressure
time of the abnormal increase in the confining pressure was
very close to the moment at which the two freezing fronts (3) As the volume of the confining medium changes
begin to merge, and after this merging, the sample height with temperature, the mean temperature of the
showed almost no further increase. This indicated that the confining medium should be controlled to vary
merging of the two freezing fronts locked the sample height, ½ð−0:25 – 0:073 pc Þ ± 1:85° C. This means that once
preventing freezing expansion from continuing to occur the sample begins to freeze, the volume of the confin-
along the height direction and causing the remaining freezing ing medium should be slightly decreased by changing
expansion to develop only in the radial direction, thereby the mean temperature by ð−0:25 – 0:073 pc Þ° C to
compressing the confining medium; hence, the confining allow the freezing expansion to develop to a small
pressure abnormally increased, and the ice sample expanded extent along the radial direction to compensate for
in the middle. Therefore, the sample should be unidirection- the small radial shrinkage of the water sample caused
ally frozen to allow the freezing expansion to develop along by cooling and compression, then the mean tempera-
the height direction throughout the whole freezing process. ture of the confining medium should remain constantGeofluids 15
until the sample is completely frozen, and the control- [6] Q. Yin, H. Jing, G. Ma, H. Su, and R. Liu, “Investigating the
ling error should not exceed ±1.85°C roles of included angle and loading condition on the critical
hydraulic gradient of real rock fracture networks,” Rock
(4) The sample should be frozen by one freezing front Mechanics and Rock Engineering, vol. 51, no. 10, pp. 3167–
developing in the bottom-up direction to ensure that 3177, 2018.
the freezing expansion will develop in the height [7] Y. Ji, G. Zhou, Y. Zhou, M. R. Hall, X. Zhao, and P. Q. Mo, “A
direction throughout the whole freezing process separate-ice based solution for frost heaving-induced pressure
during coupled thermal-hydro-mechanical processes in freez-
(5) The control of the confining medium mean tempera- ing soils,” Cold Regions Science and Technology, vol. 147,
ture and the sample unidirectional freezing can be pp. 22–33, 2018.
realized by a numerical simulation in which the tem-
[8] J. Wang, Y. Zhang, Z. Qin, S. Song, and P. Lin, “Analysis
perature constraints of the three freezing channel are method of water inrush for tunnels with damaged water-
adjusted resisting rock mass based on finite element method-smooth
(6) The complete preparation procedures are as follows: particle hydrodynamics coupling,” Computers and Geotech-
nics, vol. 126, p. 103725, 2020.
first, the adjustment simulation of the temperature
fields is carried out to determine the adjustments to [9] J. P. Wang, W. M. Liu, and H. Wang, “Comparisons on ground
the temperature constraints on the freezing channels; freezing constructions in 1000 m depth mine shafts,” Mine
Construction Technology, vol. 38, no. 4, pp. 34–37, 2017.
then, according to the simulation results, the temper-
ature fields of the sample and the confining medium [10] B. Zhang, W. H. Yang, and B. S. Wang, “Elastoplastic design
theory for ultra-deep frozen wall considering large deforma-
in the stages of triaxial cell precooling and precooled
tion features,” Chinese Journal of Geotechnical Engineering,
hydraulic oil injection and pressurization are con- vol. 41, no. 7, pp. 1288–1295, 2019.
trolled by the lateral freezing channel, and the upper
[11] R. L. Shan, Y. Bai, L. Song, and Y. Song, “Experimental study of
and lower freezing channels are used to control the
blasting vibration and damage characteristics on frozen shaft
temperature fields during the freezing process wall,” Chinese Journal of Rock Mechanics and Engineering,
vol. S3, no. 34, pp. 3732–3741, 2015.
Data Availability [12] R. Margesin, Permafrost Soils, Springer Science & Business
Media, Heidelberg, Berlin, 2008.
The data used to support the findings of this study are [13] M. Ramos, A. Hasler, G. Vieira, C. Hauck, and S. Gruber,
included within the article. “Drilling and installation of boreholes for permafrost thermal
monitoring on Livingston Island in the maritime Antarctic,”
Conflicts of Interest Permafrost & Periglacial Processes, , pp. 57–64, 2009.
[14] D. Li, C. Zhang, G. Ding et al., “Fractional derivative-based
The authors declare that they have no conflicts of interest. creep constitutive model of deep artificial frozen soil,” Cold
Regions Science and Technology, vol. 170, p. 102942, 2020.
Acknowledgments [15] D. Wang, W. Ma, X. Chang, and A. Wang, “Study on the resis-
tance to deformation of artificially frozen soil in deep allu-
This work was supported by funding from the National Key vium,” Cold Regions Science and Technology, vol. 42, no. 3,
Research and Development Program of China (Grant No. pp. 194–200, 2005.
2016YFC0600904). [16] Y. Yang, Y. Lai, and X. Chang, “Laboratory and theoretical
investigations on the deformation and strength behaviors of
References artificial frozen soil,” Cold Regions Science and Technology,
vol. 64, no. 1, pp. 39–45, 2010.
[1] J. T. Chen, J. Zhao, S. Zhang, Y. Zhang, F. Yang, and M. Li, “An [17] Y. Bai, R. Shan, Y. Ju et al., “Experimental study on the
experimental and analytical research on the evolution of min- strength, deformation and crack evolution behaviour of red
ing cracks in deep floor rock mass,” Pure and Applied Geophys- sandstone samples containing two ice-filled fissures under tri-
ics, vol. 177, no. 11, pp. 5325–5348, 2020. axial compression,” Cold Regions Science and Technology,
[2] B. Chen, S. Zhang, Y. Li, Z. Li, and H. Zhou, “Physical simula- vol. 174, p. 103061, 2020.
tion study of crack propagation and instability information [18] Y. Bai, R. Shan, Y. Ju, Y. Wu, P. Sun, and Z. Wang, “Study on
discrimination of rock-like materials with faults,” Arabian the mechanical properties and damage constitutive model of
Journal of Geosciences, vol. 13, no. 18, p. 966, 2020. frozen weakly cemented red sandstone,” Cold Regions Science
[3] D. K. Liu, Z. Gu, R. Liang et al., “Impacts of pore-throat system and Technology, vol. 171, p. 102980, 2020.
on fractal characterization of tight sandstones,” Geofluids, [19] R. L. Shan, Y. Bai, H. Dou, T. Han, and F. Yan, “Experimental
vol. 2020, Article ID 4941501, 17 pages, 2020. study on the mechanical properties and damage evolution of
[4] T. Wang, H. Zhang, G. Q. Zhou, and X. Y. Liu, “Evaluation of red sandstone containing a single ice-filled flaw under triaxial
variability characteristics of mechanical parameters of artifi- compression,” Arabian Journal of Geosciences, vol. 13, no. 14,
cially frozen clay in deep alluvium,” Cold Regions Science and 2020.
Technology, vol. 171, p. 102978, 2020. [20] M. J. Siegert, R. Kwok, C. Mayer, and B. Hubbard, “Water
[5] Q. Yin, G. Ma, H. Jing et al., “Hydraulic properties of 3D exchange between the subglacial Lake Vostok and the over-
rough-walled fractures during shearing: an experimental lying ice sheet,” Nature, vol. 403, no. 6770, pp. 643–646,
study,” Journal of Hydrology, vol. 555, pp. 169–184, 2017. 2000.16 Geofluids
[21] V. Lukin and S. Bulat, “Vostok subglacial lake: details of [40] R. Ulusay, The ISRM Suggested Methods for Rock Characteri-
Russian plans/activities for drilling and sampling,” in Geophys- zation, Testing and Monitoring: 2007-2014, Springer Interna-
ical Monograph Series, American Geophysical Union, 2011. tional Publishing, Switzerland, 2015.
[22] J. Jouzel, J. R. Petit, R. Souchez et al., “More than 200 meters of [41] V. Petrenko and R. Whitworth, Physics of Ice, Oxford Univer-
lake ice above subglacial Lake Vostok, Antarctica,” Science, sity Press, 2002.
vol. 286, no. 5447, pp. 2138–2141, 1999. [42] S. Timoshenk and S. W. Krieger, Theory of Plates and Shells,
[23] M. H. Carr, M. J. S. Belton, C. R. Chapman et al., “Evidence for McGraw-Hill, 1959.
a subsurface ocean on Europa,” Nature, vol. 391, no. 6665, [43] P. R. Sammonds, S. A. F. Murrell, M. A. Rist, and D. Butler,
pp. 363–365, 1998. “The design of a high-pressure low-temperature triaxial defor-
[24] G. A. Kuehn, R. W. Lee, W. A. Nixon, and E. M. Schulson, mation cell for ice,” Cold Regions Science and Technology,
“The structure and tensile behavior of first-year sea ice and vol. 19, no. 2, pp. 177–188, 1991.
laboratory-grown saline ice,” Journal of Offshore Mechanics [44] B. D. Alkire and O. B. Andersland, “The effect of confining
and Arctic Engineering, vol. 112, no. 4, pp. 357–363, 1990. pressure on the mechanical properties of sand–ice materials,”
[25] T. R. Smith and E. M. Schulson, “The brittle compressive fail- Journal of Glaciology, vol. 12, no. 66, pp. 469–481, 1973.
ure of fresh-water columnar ice under biaxial loading,” Acta [45] Y. L. Chen, “Permeability evolution in granite under compres-
Metallurgica et Materialia, vol. 41, no. 1, pp. 153–163, 1993. sive stress condition,” Geotechnical and Geological Engineer-
[26] W. F. Weeks and G. F. N. Cox, Laboratory Preparation of Arti- ing, vol. 36, no. 1, pp. 641–647, 2018.
ficial Sea and Salt Ice, Cold Regions Research and Engineering [46] Q. Yin, R. Liu, H. Jing, H. Su, L. Yu, and L. He, “Experimental
Laboratory, 1974. study of nonlinear flow behaviors through fractured rock sam-
[27] I. L. Meglis, R. E. Gagnon, and R. P. Young, “Microcracking ples after high-temperature exposure,” Rock Mechanics and
during stress-relief of polycrystalline ice formed at high pres- Rock Engineering, vol. 52, no. 9, pp. 2963–2983, 2019.
sure,” Geophysical Research Letters, vol. 22, no. 16, pp. 2207– [47] J. W. Chen, H. Q. Hou, and W. J. Chen, “Study on deformation
2210, 1995. performance of PVC membrane materials under biaxial cyclic
[28] M. Arakawa and N. Maeno, “Mechanical strength of polycrys- tensile loads,” Advanced Materials Research, vol. 479-481,
talline ice under uniaxial compression,” Cold Regions Science pp. 36–40, 2012.
and Technology, vol. 26, no. 3, pp. 215–229, 1997. [48] S. R. Chen, P. L. Kuai, and Q. L. Zhang, “Experimental
[29] R. E. Gagnon and P. H. Gammon, “Triaxial experiments on research on mechanical properties of PVC membrane after
iceberg and glacier ice,” Journal of Glaciology, vol. 41, artificial accelerated aging,” Structural Engineer, vol. 29,
no. 139, pp. 528–540, 1995. no. 5, pp. 150–154, 2013.
[30] S. Y. Kim and K. Choi, “Standardization of laboratory experi- [49] G. S. Kell, “Precise representation of volume properties of
mental techniques with a cold room in Korea,” in Proceedings water at one atmosphere,” Journal of Chemical and Engineer-
of the 18th IAHR International Symposium on Ice, Sapporo, ing Data, vol. 12, no. 1, pp. 67–69, 1967.
Japan, 2006. [50] A. Bahadori and H. B. Vuthaluru, “Prediction of bulk modulus
[31] P. M. Melanson, I. L. Meglis, I. J. Jordaan, and B. M. Stone, and volumetric expansion coefficient of water for leak tight-
“Microstructural change in ice: I. Constant-deformation-rate ness test of pipelines,” International Journal of Pressure Vessels
tests under triaxial stress conditions,” Journal of Glaciology, and Piping, vol. 86, no. 8, pp. 550–554, 2009.
vol. 45, no. 151, pp. 417–422, 1999. [51] Y. Huang, G. J. Tang, and M. Zhu, “Large deformation analysis
[32] M. A. Rist and S. A. F. Murrell, “Ice triaxial deformation and of elastic thin shells,” Engineering Mechanics, vol. 19, no. 1,
fracture,” Journal of Glaciology, vol. 40, no. 135, pp. 305–318, pp. 66–71, 2002.
1994. [52] T. Makita, “Application of high pressure and thermophysical
[33] B. M. Stone, I. J. Jordaan, J. Xiao, and S. J. Jone, “Experiments properties of water to biotechnology,” Fluid Phase Equilibria,
on the damage process in ice under compressive states of vol. 76, pp. 87–95, 1992.
stress,” Journal of Glaciology, vol. 43, no. 143, pp. 11–25, 1997. [53] L. Otero, A. D. Molina-García, and P. D. Sanz, “Some interre-
[34] G. A. Kuehn, E. M. Schulson, D. E. Jones, and J. Zhang, “The lated thermophysical properties of liquid water and ice. I. A
compressive strength of ice cubes of different sizes,” Journal user-friendly modeling review for food high-pressure process-
of Offshore Mechanics and Arctic Engineering, vol. 115, no. 2, ing,” Critical Reviews in Food Science and Nutrition, vol. 42,
pp. 142–148, 1993. no. 4, pp. 339–352, 2002.
[35] I. Hawkes and M. Mellor, “Uniaxial testing in rock mechanics [54] D. Eisenberg and W. Kauzmann, The Structure and Properties
laboratories,” Engineering Geology, vol. 4, no. 3, pp. 177–285, of Water, Oxford University Pressure, London, 2005.
1970. [55] W. Wagner, A. Saul, and A. Pruss, “International equations for
[36] K. Mogi, Experimental Rock Mechanics, Taylor & Francis, the pressure along the melting and along the sublimation curve
2006. of ordinary water substance,” Journal of Physical and Chemical
[37] M. S. Paterson and T. F. Wong, Experimental Rock Deforma- Reference Data, vol. 23, no. 3, pp. 515–527, 1994.
tion - the Brittle Field, Springer, 2005. [56] R. W. Blue, “The librational heat capacity of ice and of heavy
[38] D. M. Cole, “Preparation of polycrystalline ice specimens for ice,” Journal of Chemical Physics, vol. 22, no. 2, pp. 280–283,
laboratory experiments,” Cold Regions Science and Technology, 1954.
vol. 1, no. 2, pp. 153–159, 1979. [57] G. A. Slack, “Thermal conductivity of ice,” Physical Review B,
[39] J. Schwarz, R. Frederking, V. Gavrillo et al., “Standardized test- vol. 22, no. 6, pp. 3065–3071, 1980.
ing methods for measuring mechanical properties of ice,” Cold [58] R. Gu and H. G. Stefan, “Year-round temperature simulation
Regions Science and Technology, vol. 4, no. 3, pp. 245–253, of cold climate lakes,” Cold Regions Science and Technology,
1981. vol. 18, no. 2, pp. 147–160, 1990.You can also read