Frequently Asked Questions About Prescription Drug Pricing and Policy
←
→
Page content transcription
If your browser does not render page correctly, please read the page content below
Frequently Asked Questions About
Prescription Drug Pricing and Policy

Suzanne M. Kirchhoff
Analyst in Health Care Financing

Judith A. Johnson
Specialist in Biomedical Policy

Susan Thaul
Specialist in Drug Safety and Effectiveness

April 24, 2018

                                              Congressional Research Service
                                                                    7-5700
                                                               www.crs.gov
                                                                     R44832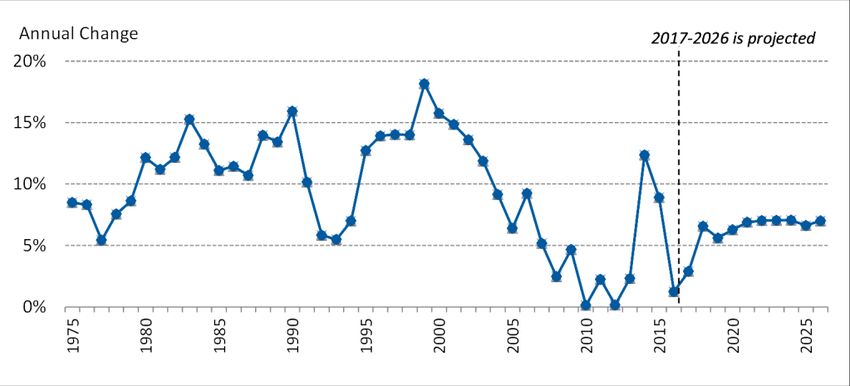
Frequently Asked Questions About Prescription Drug Pricing and Policy

Summary
Prescription drugs play an important role in the U.S. health care system. Innovative, breakthrough
drugs are providing cures for diseases such as hepatitis C and helping individuals with chronic
conditions lead fuller lives. Studies show that prescription drug therapy can produce health care
savings by reducing the number of hospitalizations and other costly medical procedures.
Congress and presidential administrations have attempted to ensure that Americans have access to
pharmaceuticals by enacting the Medicare Part D prescription drug benefit as part of the
Medicare Modernization and Prescription Drug Act of 2003 (MMA; P.L. 108-173) and expanding
drug coverage under the 2010 Patient Protection and Affordable Care Act (ACA; P.L. 111-148, as
amended). Congress also has enacted laws to encourage manufacturing of lower-cost generic
drugs, as well as cutting-edge biologics and biosimilars.
Americans are using more prescription drugs, and for longer periods of time, than in past decades.
Still, access to prescription drugs remains an issue for a number of consumers, particularly those
without insurance; those prescribed expensive specialty drugs for treating serious or rare diseases;
or those enrolled in private insurance or public health plans with high cost-sharing requirements,
such as drug deductibles and coinsurance.
Prescription drug affordability has gained renewed attention during the past few years as retail
drug spending has risen at the fastest pace in more than a decade—growing 12.4% in 2014 and
8.9% in 2015 before slowing to a 1.3% increase in 2016. There are several reasons for the recent
volatility in drug spending. Manufacturers have been introducing new drugs at a record rate and
raising prices for many existing brand-name products. The introduction of new hepatitis C drugs
at the end of 2013 had a major impact on total drug spending in 2014 and 2015. At the same time,
fewer brand-name drugs have lost patent protection than in previous years, resulting in less
impact from the use of lower-cost generic substitutes. The Centers for Medicare & Medicaid
Services (CMS) forecasts that retail drug spending could average 6.3% annual growth from 2017
to 2026. Although that growth rate would be a reduction from the average level of the past several
years, CMS expects retail drug spending to increase faster than other areas of medical spending in
this10-year period.
This report will address frequently asked questions about government and private-sector policies
that affect drug prices and availability. Among the prescription drug topics covered are federally
funded research and development, regulation of direct-to-consumer advertising, legal restrictions
on reimportation, and federal price negotiation. The report provides a broad overview of the
issues as well as references to more in-depth CRS products. The appendixes provide references to
relevant congressional hearings and documents (see Appendix A) and a directory of CRS
prescription drug experts (see Appendix B).

Congressional Research Service
Frequently Asked Questions About Prescription Drug Pricing and Policy
Contents
Introduction ..................................................................................................................................... 1
U.S. Prescription Drug Spending .................................................................................................... 3
How Much Does the United States Spend on Prescription Drugs? .......................................... 3
How Does 2016 Drug Spending Compare to Other Years? ...................................................... 5
What Is Behind the Recent Volatility in Retail Drug Spending? .............................................. 6
Changes in Drug Mix .......................................................................................................... 6
Changes in Drug Prices ....................................................................................................... 8
Drug Utilization ................................................................................................................ 10
Are U.S. Consumer Out-of-Pocket Drug Costs Rising? ......................................................... 10
Government Role in Prescription Drug Spending ......................................................................... 13
How Much U.S. Drug Spending Is Paid by Government Programs? ..................................... 13
How Does the Federal Government Pay For Prescription Drugs? .......................................... 14
Can the HHS Secretary Negotiate Medicare Part D Drug Prices? .......................................... 16
What Are U.S. States Doing to Address Drug Costs? ............................................................. 18
Is U.S. Prescription Drug Spending Higher Than in Other Nations? ...................................... 19
Pharmaceutical Development and Marketing................................................................................ 21
How Much Does Publicly Funded Research Contribute to Drug Development? ................... 21
How Much Does It Cost to Develop New Drugs? .................................................................. 23
Does Congress Regulate Prescription Drug Ads? ................................................................... 25
May U.S. Consumers Import Drugs from Abroad?................................................................. 29
Figures
Figure 1. National Retail Prescription Drug Spending .................................................................... 4
Figure 2. Annual Percentage Change in Retail Prescription Drug Spending .................................. 5
Figure 3. U.S. Retail Prescription Drug Price Inflation ................................................................... 8
Figure 4. Consumer Out-of-Pocket Spending as a Share of Retail Drug Spending .......................11
Figure 5. Per Capita Out-of-Pocket Spending for Retail Prescription Drugs ................................ 13
Figure 6. Share of Spending for Retail Prescription Drugs by Source .......................................... 14
Figure 7. Per Capita Spending on Retail Drugs in U.S. and Other Countries ............................... 20
Figure 8. Direct-to-Consumer Prescription Drug Advertising ...................................................... 26
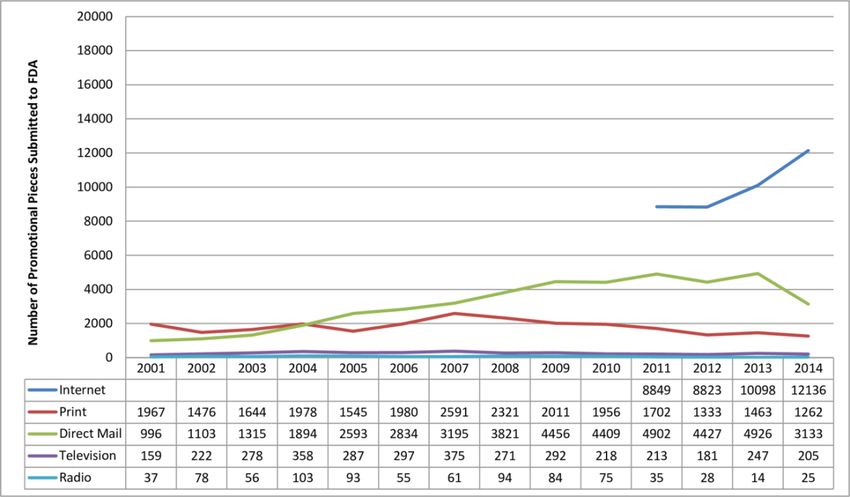
Figure 9. Number of Prescription Drug Ads Reviewed by FDA ................................................... 27
Tables
Table 1. Commonly Used Prescription Drug Terms ........................................................................ 1
Table 2. Selected Federal Programs Providing Prescription Drug Coverage ................................ 15
Table B-1. CRS Prescription Drug Experts ................................................................................... 34
Congressional Research ServiceFrequently Asked Questions About Prescription Drug Pricing and Policy Appendixes Appendix A. Relevant Congressional Drug Pricing Hearings in the 114th and 115th Congresses .................................................................................................................................. 31 Appendix B. CRS Prescription Drug Experts ............................................................................... 34 Contacts Author Contact Information .......................................................................................................... 34 Congressional Research Service
Frequently Asked Questions About Prescription Drug Pricing and Policy

Introduction
Prescription drug affordability has gained renewed attention in the past few years, as retail drug
spending has risen at the fastest pace in more than a decade. There are several reasons for the
increase in drug spending. Manufacturers have been introducing new drugs at a record rate and
raising prices for existing brand-name products. (See “What Is Behind the Recent Volatility in
Retail Drug Spending?,” below.) At the same time, fewer brand-name drugs have lost patent
protection than in previous years, which has meant lower savings from new generic substitutes.
The Centers for Medicare & Medicaid Services (CMS) forecasts that retail drug spending could
average 6.3% annual growth from 2017 to 2026.1 Although that growth rate would be a reduction
from recent, more rapid levels, CMS expects retail drug spending to increase faster than other
areas of medical spending in this 10-year period.
This report will address frequently asked questions about government and private-sector policies
that affect drug prices and availability. Among the prescription drug topics covered are federally
funded research and development, regulation of direct-to-consumer advertising, legal restrictions
on reimportation, and federal price negotiation. The report provides a broad overview of the
issues and references to more in-depth CRS products. The appendixes provide references to
relevant congressional hearings (see Appendix A) and a directory of CRS prescription drug
experts (see Appendix B).

                      Table 1. Commonly Used Prescription Drug Terms
           Term                                                 Definition

Biologic                Pharmaceuticals derived from a living organism that can be many times the size of a
                        conventional (small-molecule) drug and have a more complex structure.a
Biosimiliar             A follow-on to a biologic that is “highly similar,” notwithstanding minor differences in
                        clinically inactive components. There are no clinically meaningful differences between a
                        biosimilar and the reference biologic product in terms of safety, purity, and potency of the
                        product. The Patient Protection and Affordable Care Act (ACA; P.L. 111-148, as amended)
                        provided a period of exclusivity for manufacturers of certain biologic brand-name drugs and
                        biosimilar products.
Brand-Name Drug         A drug marketed under a proprietary, trademark-protected name.
Coinsurance             The percentage share that an enrollee in a health insurance plan pays for a product or
                        service covered by the plan. For example, an insurer may charge 10% coinsurance for a
                        $100 prescription drug, meaning the consumer’s out-of-pocket cost is $10.
Co-payment              A fixed dollar amount that an enrollee in a health insurance plan pays for a product or
                        service covered by the plan. For example, an insurer may charge a $20 co-payment for a
                        physician visit or a $5 co-payment for a prescription drug.
Deductible              The amount an enrollee is required to pay for health care services or products before his
                        or her insurance plan begins to provide coverage. An enrollee in an insurance plan with a
                        $500 deductible would be responsible for paying for the first $500 in health care services.
                        In some insurance plans, the deductible does not apply to certain services, such as
                        preventive care. Insurance plans vary regarding whether beneficiaries must meet a
                        deductible for prescription drug coverage.

1
 Centers for Medicare & Medicaid Services (CMS), “National Health Expenditure Projections 2017-2026,” at
https://www.cms.gov/Research-Statistics-Data-and-Systems/Statistics-Trends-and-Reports/NationalHealthExpendData/
NationalHealthAccountsProjected.html. Also see CMS, “CMS Office of the Actuary Releases 2017-2026 Projections
of National Health Expenditures,” February 14, 2018, at https://www.cms.gov/Newsroom/MediaReleaseDatabase/
Press-releases/2018-Press-releases-items/2018-02-14.html.

Congressional Research Service                                                                                        1
Frequently Asked Questions About Prescription Drug Pricing and Policy
Term Definition
Generic Drug A drug that is identical to a traditional (small molecule) brand-name drug in dosage, safety,
strength, route of administration, quality, performance characteristics, and intended use.
Generic drugs generally cost significantly less than their brand-name counterparts.b
Formulary A list of prescription drugs covered by an insurance plan. In an effort to control costs,
insurers are imposing partially closed formularies, which include a more limited number of
drugs than open formularies. Insurers use tiered cost sharing for formulary drugs, meaning
patients are charged lower co-payments or coinsurance for less expensive generic drugs
and certain brand-name drugs that are designated by the plan as preferred drugs, based on
the price the plan has negotiated with the manufacturer and the effectiveness of the
product. At the same time, patients are charged higher co-payments or coinsurance for
more expensive drugs or drugs that the plan deems to be less effective.
Orphan Drug A traditional drug or biologic for the treatment of rare diseases and disorders that affect
fewer than 200,000 people in the United States or that affect more than 200,000 people
but where manufacturers are not expected to recover the costs of developing and
marketing a treatment drug. Manufacturers of orphan drugs are eligible for federal tax,
marketing, and other incentives.c
Out-of-Pocket Costs The total amount an insured consumer pays each year for covered health care services that
are not reimbursed by an insurance plan. Out-of-pocket costs can include deductibles, co-
payments, and coinsurance.
Out-of-Pocket The maximum amount an enrollee must pay before his or her health insurance plan covers
Maximum 100% of health benefits. Certain costs, such as premiums, generally are not counted toward
an out-of-pocket maximum, or cap.
Pharmacy Benefit Intermediaries between health plans and pharmacies, drug wholesalers, and manufacturers.
Managers (PBMs) PBMs perform functions such as designing drug formularies, negotiating prices, and
administering prescription drug payment systems.
Pharmacy Network A group of retail, mail-order, and specialty pharmacies that contract with PBMs and health
insurers to dispense covered drugs at set prices. Network pharmacies also may provide
other services under contract, such as monitoring patient adherence to drugs.
Premium The amount an enrollee pays for health insurance coverage. Many plans charge monthly
premiums, but premiums also can be assessed on a quarterly or annual basis.
Specialty Drug There is no one set definition of specialty drugs, although insurers and other health care
payers often characterize them as prescription products requiring extra handling or
administration that are used to treat complex diseases, such as cancer. High cost can
trigger a specialty drug designation. Biologics are often deemed to be specialty drugs.d
Underinsured Refers to people who have insurance but still have financial difficulty paying for prescription
drugs or medical treatments.e
Source: CRS.
a. See CRS Report R44620, Biologics and Biosimilars: Background and Key Issues, by Judith A. Johnson.
b. U.S. Food and Drug Administration (FDA), “Generic Drugs,” at https://www.fda.gov/drugs/resourcesforyou/
consumers/buyingusingmedicinesafely/genericdrugs/default.htm. In 1984, Congress enacted the Hatch-
Waxman Act (P.L. 98-417), which provided manufacturers of innovative prescription drugs with patent
protection and a period of marketing exclusivity, created a generic drug approval process to help companies
bring products to market more quickly once the patent for an original brand-name drug expired, and
established procedures for resolving patent disputes arising from applications to market generic drugs.
Generic drugs make up about 89% of filled prescriptions and 26% of total drug spending. See Association for
Accessible Medications, 2017 Generic Drug Access & Savings in the United States Report, at
https://www.accessiblemeds.org/resources/blog/2017-generic-drug-access-and-savings-us-report.
c. FDA, “Developing Products for Rare Diseases & Conditions,” at http://www.fda.gov/ForIndustry/
DevelopingProductsforRareDiseasesConditions/ucm2005525.htm.
d. See CRS Report R44132, Specialty Drugs: Background and Policy Concerns.
Congressional Research Service 2Frequently Asked Questions About Prescription Drug Pricing and Policy
e. There are different definitions of underinsurance. For example, the Commonwealth Fund defines individuals
as underinsured if they had health insurance but still had total out-of-pocket costs or deductibles that were
high relative to their incomes. See Commonwealth Fund, “Underinsured Rate Increased Sharply in 2016;
More Than Two of Five Marketplace Enrollees and a Quarter of People with Employer Health Insurance
Plans Are Now Underinsured,” October 18, 2017, at http://www.commonwealthfund.org/publications/
press-releases/2017/oct/underinsured-press-release.
U.S. Prescription Drug Spending
How Much Does the United States Spend on Prescription Drugs?
The most commonly cited data on prescription drug spending come from the National Health
Expenditures (NHE) accounts compiled by CMS.2 The NHE accounts track annual spending by
all payers for prescription drugs purchased in retail settings, such as pharmacies, mail-order
outlets, grocery stores, warehouse clubs, and similar businesses. The NHE data do not include
drugs dispensed in institutions including hospitals, long-term care facilities, and clinics,3 nor do
they include over-the-counter products such as aspirin purchased without a prescription.4
According to the most recent NHE data, the United States spent $328.6 billion on prescription
drugs in 2016 and a forecast $338.1 billion in 2017, or 10% of predicted 2017 national health care
spending of $3.5 trillion.5 Prescription drug spending is forecast to rise to about 11% of national
health care spending by 2027 (see Figure 1). Retail drug spending has ranged from about 5% to
10% of total health care expenditures since 1960, when the NHE accounts began compiling
prescription spending data.6 (See “How Does 2016 Drug Spending Compare to Other Years?”)
Because the NHE data provide information about retail drug sales only, a number of analysts say
the data do not offer a complete picture of U.S. drug spending. The Department of Health and
2
CMS, “National Health Expenditure Projections 2017-2026,” at https://www.cms.gov/Research-Statistics-Data-and-
Systems/Statistics-Trends-and-Reports/NationalHealthExpendData/NationalHealthAccountsProjected.html. The
National Health Expenditures (NHE) data incorporate information from the U.S. Census Bureau and IQVIA (formerly
IMS Health), a private firm that provides consulting, technology, and other services for the health care industry. The
figures include retail sales of prescription drugs, subtract manufacturer rebates, and add in government spending for
drugs provided by government-owned mail-order facilities.
3
Although spending for drugs in institutional settings is not included in the NHE retail prescription drug category, it is
included in other categories of spending and in overall national health care spending. For example, drugs dispensed in
hospitals are included in the NHE hospital spending category.
4
Many over-the-counter products originally were prescription products, such as some antihistamines. See U.S. Food
and Drug Administration (FDA), “Now Available Without a Prescription,” at http://www.fda.gov/Drugs/
ResourcesForYou/Consumers/ucm143547.htm.
5
CMS, “National Health Expenditure Projections 2017-2026,” at https://www.cms.gov/Research-Statistics-Data-and-
Systems/Statistics-Trends-and-Reports/NationalHealthExpendData/NationalHealthAccountsProjected.html. The NHE
projects national health care spending of $5.7 trillion in 2026, including $605 billion in retail prescription drug
spending.
6
According to the NHE, retail prescription drug spending was 10% of national health expenditures in 1960. Retail drug
spending declined to less than 5% of national health expenditures from 1960 to 1982. During this period, other areas of
medical spending were increasing more quickly than drug spending due to the creation of government health programs
such as Medicare and Medicaid and the expansion of private health insurance. Retail drug spending began to increase
as a share of national health spending in the mid-1980s, due to price inflation and growing consumption. By the early
2000s, retail drug spending had once again reached about 10% of national health care expenditures. See Cynthia Smith,
“Retail Prescription Drug Spending in the National Health Accounts,” Health Affairs, vol. 233, no. 1 (January/February
2004), pp. 160-167, at https://www.healthaffairs.org/doi/full/10.1377/hlthaff.23.1.160.
Congressional Research Service 3Frequently Asked Questions About Prescription Drug Pricing and Policy
Human Services (HHS) in April 2016 issued a study that attempted to estimate total U.S.
prescription drug spending—retail plus institutional use in hospitals and other health facilities.7
Figure 1. National Retail Prescription Drug Spending
(annual spending for retail drugs and annual drug spending as a percentage of total health spending)
Source: Centers for Medicare & Medicaid Services (CMS), National Health Expenditure (NHE) data.
In addition to the NHE data, private consultants and academics publish their own forecasts of
U.S. prescription drug spending.8 National estimates vary for a number of reasons, including
7
Department of Health and Human Services (HHS), Office of the Assistant Secretary for Planning and Evaluation,
“Observations on Trends in Prescription Drug Spending,” March 8, 2016, at https://aspe.hhs.gov/sites/default/files/pdf/
187586/Drugspending.pdf. The HHS estimate is based on NHE retail prescription drug data and an outside analysis by
the Altarum Institute, a nonprofit health systems research and consulting organization. According to Altarum, non-
retail, or institutional, drug spending accounts for 28% of prescription drug spending and retail drugs account for 72%
The HHS study provided estimates of total prescription drug spending as a share of U.S. personal health expenditures.
Personal health expenditures are a subset of the NHE accounts that measure the amount spent each year to treat people
with specific medical conditions. Personal health expenditures do not include some areas of spending included in the
broader definition of national health expenditures, such as industry investment and public health activity. According to
HHS, total prescription drug spending was projected to account for nearly 17% of personal health expenditures in 2016.
The comparable measure for retail prescription drugs was 12%.
8
IQVIA (formerly IMS Health) estimates that drug spending, based on invoice prices, increased by 5.8% to $450
billion in 2016, which was less than half the rate of increase of the previous two years. After adjusting spending for
(continued...)
Congressional Research Service 4Frequently Asked Questions About Prescription Drug Pricing and Policy
assumptions about the dollar value of rebates that pharmaceutical manufacturers provide to health
payers, as well as the value of coupons offered to consumers, and whether the forecasts include
both retail and institutional use. However, the different studies show a trend toward higher
spending in recent years.
How Does 2016 Drug Spending Compare to Other Years?
The pace of U.S. retail prescription drug spending has varied through the decades. For much of
the 1980s through the early 2000s, retail drug spending grew at a double-digit annual pace. From
2003 through 2013, drug spending slowed to a historically low average annual growth rate of
5%.9 (See Figure 2.) Drug spending growth moderated for a number of reasons, including a deep
economic recession from 2007 to 2010, a reduction in the number of expensive new drugs
coming to the market compared to earlier years, and a continued expansion in the use of lower-
cost generic drugs.10 (See Table 1.)
Figure 2. Annual Percentage Change in Retail Prescription Drug Spending
Source: CMS, NHE data, “Historical and Forecast 2017-2026.”
Notes: Figures through 2016 are annual, others are forecasts.
However, in 2014, spending for retail prescription drugs accelerated. U.S. retail drug spending
jumped by 12.4% in 2014—the largest annual increase in more than a decade. Drug spending
rose by 8.9% in 2015 before slowing to a 1.3% increase in 2016 and a forecasted 2.9% increase in
(...continued)
estimated rebates and other price concessions by manufacturers, IQVIA found that net spending was $323 billion, up
4.8% from comparable 2015 levels. See IQVIA Institute, “Medicines Use and Spending in the U.S., a Review of 2016
and Outlook to 2021,” May 2017. Available for download at https://www.iqvia.com/institute/reports/medicines-use-
and-spending-in-the-us-a-review-of-2016. Also see Glen Schumock et al, “National Trends in Prescription Drug
Expenditures and Projections for 2017,” American Journal of Health System Pharmacies, vol. 74 (August 1, 2017), at
http://www.ajhp.org/content/73/14/1058.full.pdf+html http://www.ajhp.org/content/early/2017/05/17/ajhp170164/tab-
article-info.
9
Aaron Catlin and Cathy Cowan, History of Health Spending in the United States, 1960-2013, CMS, p. 23, at
https://www.cms.gov/Research-Statistics-Data-and-Systems/Statistics-Trends-and-Reports/NationalHealthExpendData/
Downloads/HistoricalNHEPaper.pdf. The implementation of Medicare Part D in 2006 caused a spike in prescription
drug spending that year.
10
Ibid., p. 23.
Congressional Research Service 5Frequently Asked Questions About Prescription Drug Pricing and Policy 2017.11 (See “What Is Behind the Recent Volatility in Retail Drug Spending?,” below.)12 Retail drug spending is projected to grow by about 6.3% a year on average through 2027, according to the NHE, due partly to faster projected drug price growth, particularly for costlier specialty drugs. Although that growth rate would be a reduction from the recent pace, drugs would be expected to grow faster than other areas of health care spending. For example, the NHE accounts project that physician services and hospital care will grow 5% and 5.5% on average, respectively, over the same time period.13 During the 114th and 115th Congresses, a series of hearings have been held on prescription drugs in response to the acceleration in spending and sharp increases in prices for specific drugs. (See partial list of hearings in Appendix A. The list focuses on hearings most relevant to drug pricing issues.) What Is Behind the Recent Volatility in Retail Drug Spending? Retail prescription drug spending can be affected by (1) changes in the mix of available drugs, (2) changes in the price of drugs, and (3) changes in the volume of drugs used. The rapid increase in retail drug spending in 2014 and 2015 was driven largely by the introduction of new high-cost drugs, price increases for existing drugs, and the diminishing impact of generic substitution, as fewer brand-name drugs lost patent protection than in previous years. Implementation of the Patient Protection and Affordable Care Act (ACA; P.L. 111-148, as amended) also helped to propel drug demand.14 The rate of prescription drug spending slowed in 2016, even though overall utilization rose during that year, due to factors that included fewer new drug approvals than in previous years, less use of high-cost hepatitis C drugs, and a deceleration in spending for drugs to treat diabetes.15 Changes in Drug Mix Drug mix refers to the cost of new drugs versus the cost of older drugs being used. New, innovator brand-name drugs often are more expensive than older drugs and do not have lower- cost equivalents. Likewise, newly introduced generic drugs, which are less expensive than brand- name products, can reduce the cost of certain therapies. 11 CMS, “National Health Expenditure Projections 2017-2026,” at https://www.cms.gov/Research-Statistics-Data-and- Systems/Statistics-Trends-and-Reports/NationalHealthExpendData/NationalHealthAccountsProjected.html. 12 Ibid and CMS, “National Health Expenditure Data: Historical,” Table 2, at https://www.cms.gov/Research-Statistics- Data-and-Systems/Statistics-Trends-and-Reports/NationalHealthExpendData/NationalHealthAccountsHistorical.html. 13 Ibid, and Gigi Cuckler et al., “National Health Expenditure Projections, 2017–26: Despite Uncertainty, Fundamentals Primarily Drive Spending Growth,” Health Affairs, vol. 37, no. 3 (March 2018), pp. 1-11, at https://www.cms.gov/ Research-Statistics-Data-and-Systems/Statistics-Trends-and-Reports/NationalHealthExpendData/ NationalHealthAccountsProjected.html. 14 Anne B. Martin et al., “National Health Spending In 2014: Faster Growth Driven by Coverage Expansion and Prescription Drug Spending,” Health Affairs, vol. 35, no.1 (December 2, 2015), pp. 150-160, at http://content.healthaffairs.org/content/early/2015/11/25/hlthaff.2015.1194; and Anne Martin et al., “National Health Spending: Faster Growth In 2015 As Coverage Expands and Utilization Increases,” Health Affairs, vol. 26, no. 1 (January 2017). 15 Micah Hartman et al., “National Health Care Spending In 2016: Spending and Enrollment Growth Slow after Initial Coverage Expansions,” Health Affairs, vol. 37, no.1 (January 2018), at https://www.healthaffairs.org/doi/abs/10.1377/ hlthaff.2017.1299. Congressional Research Service 6
Frequently Asked Questions About Prescription Drug Pricing and Policy

During the past several years, the U.S. Food and Drug Administration (FDA) has approved a
large number of novel new drugs,16 including expensive specialty drugs for treating hepatitis C,
cancer, diabetes, and heart disease.17 In 2016 alone, more than half of the growth in U.S.
prescription drug spending was from drugs that had been available for less than two years.18 The
introduction of new hepatitis C drugs, which can cure the disease, played a large role in increased
drug spending in 2014 and 2015, accounting for nearly 40% of the net growth in total U.S. drug
spending in 2014 and two-thirds of increased brand-name prescription drug spending by
employer-sponsored health plans that year.19 The impact of the hepatitis C drugs, while still large,
is diminishing as fewer new patients are treated with the products and net prices drop for the
drugs.20
At the same time that these expensive new drugs were coming to the market, new generic
substitution was playing a smaller role in reducing total drug spending. Since 2009, patents for a
number of best-selling brand-name drugs have expired, paving the way for manufacturers to
produce new generic versions.21 In 2012, at the peak of the so-called patent cliff, spending for
brand-name drugs subject to generic competition fell by $32.6 billion. However, annual savings
from brands that have lost patent protection has been lower since then.22
Changes in drug mix will continue to play an important role in spending going forward. Many
drugs now in the development pipeline are biologics,23 which often have a high introductory price

16
   FDA approved 46 novel drugs in 2017, 22 in 2016, and 45 in 2015. See FDA, “Novel Drug Approvals for 2017,”
January 2017, at
https://www.fda.gov/Drugs/DevelopmentApprovalProcess/DrugInnovation/ucm537040.htm.
17
   CRS Report R44132, Specialty Drugs: Background and Policy Concerns.
18
   IQVIA Institute, “Medicines Use and Spending in the U.S., a Review of 2016 and Outlook to 2021,” May 2017.
Available for download at https://www.iqvia.com/institute/reports/medicines-use-and-spending-in-the-us-a-review-of-
2016.
19
   Murray Aitken et al., “Has the Era of Slow Growth for Prescription Drug Spending Ended?” Health Affairs, vol. 35,
no. 9 (September 2016), p. 1601. The study looked at retail and institutional drug spending. Health Care Cost Institute,
2014 Health Care Cost and Utilization Report, October 2015, p. ii, at http://www.healthcostinstitute.org/files/
2014%20HCCUR%2010.29.15.pdf. The report, based on claims data from three major commercial insurers, found that
per capita brand-name drug spending in employer-sponsored plans rose by $45 from 2013 to 2014. About two-thirds of
the increase, $29.60, was for newly introduced drugs for hepatitis C. Analysts expect new innovator drugs to account
for an increasing share of spending going forward. Pharmacy benefits manager Express Scripts estimates that specialty
drugs made up more than one third of drug spending in 2016. Specialty drug spending grew 13.3% during the year,
whereas traditional drug spending declined by 1%. Express Scripts, Express Scripts 2016 Drug Trend Report, p. 9, at
http://lab.express-scripts.com/lab/drug-trend-report.
20
   IQVIA Institute, “Medicines Use and Spending in the U.S. A Review of 2016 and Outlook to 2021,” May 2017. See
Charts 4 and 13. Available for download at https://www.iqvia.com/institute/reports/medicines-use-and-spending-in-the-
us-a-review-of-2016.
21
   Among the drugs losing patent protection was Pfizer’s blockbuster Lipitor.
22
    IQVIA Institute, “Medicines Use and Spending in the U.S. A Review of 2016 and Outlook to 2021,” May 2017. See
Chart 6. Available for download at https://www.iqvia.com/institute/reports/medicines-use-and-spending-in-the-us-a-
review-of-2016. See also Catamaran, 2015 Informed Trends: Moments of Opportunity, April, 2014, at
https://trendreport.catamaranrx.com/pdf/2014_Trend_Analysis_Report.pdf.
23
   CRS Report RL34045, FDA Regulation of Follow-On Biologics, and CRS Report R42890, The Role of Patents and
Regulatory Exclusivities in Pharmaceutical Innovation. Federal law has provided 12 years of marketing exclusivity for
certain biologic drugs, which limits manufacturers’ initial market competition and increases their pricing power.
Lawmakers also have attempted to spur development of lower-cost biosimilar products, similar to earlier efforts to
stimulate development of generic products. Congress and the President enacted the Biologics Price Competition and
Innovation Act of 2009 (BPCIA) as Title VII of the Patient Protection and Affordable Care Act (ACA; P.L. 111-148, as
amended). The ACA/BPCIA gives the FDA authority to license products shown to be biosimilar to or interchangeable
with an FDA-licensed biological product.

Congressional Research Service                                                                                        7
Frequently Asked Questions About Prescription Drug Pricing and Policy
and initially may not have many lower-cost alternatives. Although FDA has begun to approve
biosimilar substitutes for biologics that have lost patent and marketing protection, so far these
biosimilars are not significantly lower-priced than the original biologics.24
Changes in Drug Prices
Prescription drug prices have risen faster than prices for overall U.S. goods and services since
2014 according to the Department of Labor’s Consumer Price Index (CPI), which measures retail
inflation.25 The gap between prescription drug and overall inflation narrowed significantly in
2017. (See Figure 3.)
Figure 3. U.S. Retail Prescription Drug Price Inflation
(annual percentage CPI-U change in retail prescription drug prices compared to all retail inflation)
Source: U.S. Department of Labor, Bureau of Labor Statistics, Consumer Price Index, All Urban Consumers
(CPI-U).
Notes: Non-seasonally adjusted data are for 12 months ending in December. The data do not include drugs
dispensed through Medicaid or workers’ compensation programs. The CPI-U prescription drug index is based on
a survey of filled prescriptions in U.S. drug stores. It captures price reductions associated with use of generic
drugs, with a lag, as well as prices of new drugs.
U.S. retail drug inflation, as measured by the CPI-U,26 was 6.4% in 2014, compared to general
consumer inflation of 0.8%. Drug prices rose 6.2% in 2016, compared to a 2.1% consumer
inflation rate, and 2.8% in 2017, compared to consumer inflation of 2.1%. Drug inflation has been
24
Jonathan Rockoff, “Knockoffs of BioTech Drugs Bring Paltry Savings,” The Wall Street Journal, May 5, 2016, at
http://www.wsj.com/articles/knockoffs-of-biotech-drugs-bring-paltry-savings-1462458209.
25
Retail inflation is a measure of the average change over time in prices for a set list of consumer goods and services
The Consumer Price Index (CPI) is based on a market basket of goods and services. For prescription drugs, Department
of Labor analysts survey a sample of drug stores and a list of the last 20 drugs dispensed. See http://www.bls.gov/cpi/
cpifact4.htm.
26
The CPI-U is the CPI value for urban consumers. It excludes rural populations and represents approximately 80% of
the population.
Congressional Research Service 8Frequently Asked Questions About Prescription Drug Pricing and Policy
driven mainly by price increases for existing brand-name drugs and adoption of expensive new
innovator brand-name drugs.27 (See “Changes in Drug Mix,” above.)
Manufacturers also have raised prices for a number of existing generic drugs in the past several
years. However, a 2016 HHS study found that generic price increases were not a major
contributor to inflation.28 Likewise, pharmacy benefits manager (PBM) Express Scripts, in an
analysis of prescription drug claims data, has found that the average price for commonly used
brand-name drugs rose 10.7% from 2015 to 2016, and average prices for generic drugs declined
by 8.7% over the same time period.29 Within the brand-name drug category, biologics and
specialty drugs have driven much of the price inflation.30
Drug Price Transparency
It can be difficult to determine the final price of a prescription drug due to a lack of transparency in the
marketplace. Drug companies price discriminate, meaning they sell the same drug to different buyers
(wholesalers, health plans, pharmacies, hospitals, government purchasers, and other providers) at different
prices. The final price of a drug may include rebates and discounts to health plans and pharmacy benefit
managers that are not publicly disclosed. Market participants, such as wholesalers, add their own markups and
fees. Complicating the picture even more, pharmaceutical manufacturers offer direct consumer discounts,
such as prescription drug coupons that can be redeemed when filling a prescription at a pharmacy. Drug
companies also offer charitable aid through patient assistance programs for individuals who cannot afford their
prescriptions.
The most commonly published drug prices do not include these discounts and rebates, which appear to be
growing in size and importance. According to IQVIA, the gap between the wholesale invoice prices and the
final discounted price for brand-name drugs has increased significantly in the past several years. Prescription
drug spending from 2006 to 2016 rose 67% on an invoice basis but 42% on a net basis. More than two-thirds
of the spending growth occurred from 2013 to 2016.
An analysis of the most recent National Health Expenditures prescription drug forecast for 2017-2026
included a special section on rebates. According to the analysis, increased rebates “contributed to lower net
prices for many prescription drugs in recent years and are expected to have dampened prescription drug
spending growth in 2017. In 2018 and beyond, the share of total prescription drug spending affected by
rebates is not expected to increase as rapidly as in the recent past. As a result, the outlook for such spending
reflects somewhat stronger growth in drug prices.”
Source: CRS Report R44264, Prescription Drug Discount Coupons and Patient Assistance Programs (PAPs); IQVIA
Institute, “Medicines Use and Spending in the U.S. A Review of 2016 and Outlook to 2021,” Chart 1, May
2017; and “National Health Expenditure Projections, 2017–26: Despite Uncertainty, Fundamentals Primarily
Drive Spending Growth,” Health Affairs, vol. 37, no. 3 (March 2018).
27
Murray Aitken et al., “Has the Era of Slow Growth for Prescription Drug Spending Ended?,” Health Affairs, vol. 35,
no. 9 (September 2016), pp. 1595-1603. The study looked at retail and institutional drug spending.
28
HHS, “Understanding Recent Trends in Generic Drug Prices,” January 27, 2016, at https://aspe.hhs.gov/pdf-report/
understanding-recent-trends-generic-drug-prices. The study found that although some parts of the market had recently
experienced large price increases, about two-thirds of generic products had price declines in 2014.
29
Express Scripts, 2016 Drug Trend Report, Executive Summary, February 2017, p. 6. The Express Scripts drug price
index is based on fixed baskets of commonly used brand-name and generic drugs, which are based on the top 80% of
utilized drugs.
30
Ibid. There is wide variation in estimates of specialty drug spending depending on how the specialty drug category is
defined. For example, see HHS, Office of the Assistant Secretary for Planning and Evaluation, “Observations on
Trends in Prescription Drug Spending,” March 8, 2016, at https://aspe.hhs.gov/sites/default/files/pdf/187586/
Drugspending.pdf.
Congressional Research Service 9Frequently Asked Questions About Prescription Drug Pricing and Policy Drug Utilization During the past several years, the ACA expansion of prescription drug coverage has helped to boost demand for prescription drugs. Beginning in 2014, the ACA provided tax credits for the purchase of ACA exchange-based health plans and required many private insurance plans to cover prescription drugs as part of a package of essential health benefits.31 Studies of health insurance plans sold through ACA exchanges show a nearly 15% annual increase in drug spending for those insured consumers from 2014 to 2015, driven mainly by higher utilization.32 Medicaid coverage also expanded under the ACA, including drug coverage for non-elderly, low- income individuals.33 In 2014, the ACA changes to Medicaid contributed to an 8% jump in Medicaid prescription drug claims and a 20% rise in gross Medicaid prescription drug spending.34 The aging of the baby boomers also has contributed to increased demand. According to IQVIA, patients aged 50 and older accounted for 70% of dispensed prescriptions in 2016 and 77% of the increase in drug dispensing since 2011.35 Are U.S. Consumer Out-of-Pocket Drug Costs Rising? As recently as 1990, consumer out-of-pocket spending—cash payments, health plan deductibles, coinsurance, and co-payments—for filled prescriptions made up 57% of U.S. retail drug spending, whereas commercial payers and taxpayer-financed health programs accounted for about 43%, according to NHE data. However, in the ensuing years, commercial payers and taxpayer-financed health programs have covered a growing share of the nation’s retail prescription drug bill. The latest NHE data forecast that out-of-pocket spending declined to 13.2% of drug spending in 2017, versus 86.2% for these other payers.36 In 2026, out-of-pocket spending is forecast to account for 12.1% of retail drug costs. (See Figure 4.) 31 The essential health benefits are 10 categories of services required by private plans offered in the non-group and small-group markets. The requirement to offer the essential health benefits does not apply to large-group plans, self- insured plans, or grandfathered plans. CRS Report R44163, The Patient Protection and Affordable Care Act’s Essential Health Benefits (EHB). 32 Express Scripts, “Exchange Pulse,” June 2016, at http://lab.express-scripts.com/lab/publications/exchange-pulse- public-exchanges-report-june-2016. 33 The ACA raised the income threshold used to qualify individuals for the Medicaid program, thereby expanding coverage to more people. The ACA originally made the state Medicaid expansion mandatory, but the Supreme Court found that the enforcement mechanism for the expansion was unconstitutional, basically rendering it voluntary. Although prescription drug coverage is an optional Medicaid benefit, all states include drug coverage. See CRS In Focus IF10399, Overview of the ACA Medicaid Expansion. 34 Medicaid and CHIP Payment and Access Commission (MACPAC), “Medicaid Spending for Prescription Drugs,” January 2016, p. 6, at https://www.macpac.gov/wp-content/uploads/2016/01/Medicaid-Spending-for-Prescription- Drugs.pdf. Drug spending rose 24.6% in expansion states compared to 14.1% in non-expansion states in 2014. Also see “National Health Spending: Faster Growth In 2015 As Coverage Expands and Utilization Increases,” Health Affairs, vol. 26, no. 1 (January 2017). 35 IQVIA Institute, “Medicines Use and Spending in the U.S., a Review of 2016 and Outlook to 2021,” May 2017. Available for download at https://www.iqvia.com/institute/reports/medicines-use-and-spending-in-the-us-a-review-of- 2016. 36 CMS, “National Health Expenditure Projections 2017-2026,” Table 11, at https://www.cms.gov/Research-Statistics- Data-and-Systems/Statistics-Trends-and-Reports/NationalHealthExpendData/NationalHealthAccountsProjected.html. The NHE accounts spell out how much consumers pay each year to fill retail prescriptions including cash purchases and insurance deductibles, co-payments, and coinsurance. Annual insurance premiums are not included in out-of- pocket spending. Congressional Research Service 10
Frequently Asked Questions About Prescription Drug Pricing and Policy

     Figure 4. Consumer Out-of-Pocket Spending as a Share of Retail Drug Spending

      Source: CMS, National Health Expenditures projection data.
      Notes: Out-of-pocket spending includes cash payments, deductibles, co-payments, and coinsurance but does not
      include insurance premiums. Consumer out-of-pocket spending rose from $22.9 billion in 1990 to $44.6 billion
      in 2015 and is projected to reach $73.1 billion in 2026.

Although consumer cost sharing represents a smaller share of overall prescription drug spending
than in the past, consumers can still face high out-of-pocket expenses depending on the specific
drugs they are prescribed (generic versus brand name), whether they have insurance, the policies
of their health plans, and their eligibility for manufacturer drug discount coupons or charitable
assistance programs.
During the past several years, health plans have been imposing higher cost sharing for
prescription drugs in an effort to control spending and costs. From 2012 to 2015, the share of
commercial health plans with a prescription drug deductible rose to 46% from 23%, according to
an IQVIA analysis.37 Drug deductibles are especially prevalent in health plans sold on ACA state
exchanges.38 There has been a continued increase in the use of formulary tiered pricing and in the
practice of imposing coinsurance, as opposed to flat co-payments, for more expensive drugs. In
tiered pricing, a consumer may pay a $10 co-payment for a generic drug on a formulary low-cost
price tier; the same consumer may be charged 30% coinsurance for an expensive specialty drug
on a high-priced tier. The differential between health plan price tiers has been widening, imposing
a greater financial burden on consumers who use higher-priced drugs.39 For example, in 2017,

37
   IMS, “Emergence and Impact of Pharmacy Deductibles: Implications for Patients in Commercial Health Plans,”
November 2015, at https://www.iqvia.com/-/media/iqvia/pdfs/institute-reports/emergence-and-impact-of-pharmacy-
deductibles.pdf?la=uk-ua&hash=4F79107A4E0D959A57B8A3383691F7B4C6F6EE98.
38
   Jon Gabel et al., Commonwealth Fund, “Changes in Consumer Cost-Sharing for Health Plans Sold in the ACA’s
Insurance Marketplaces, 2015 to 2016,” Exhibit 6, May 20, 2016, at http://www.commonwealthfund.org/~/media/files/
publications/issue-brief/2016/may/1875_gabel_changes_cost_sharing_marketplaces_rb_v2.pdf. In 2016, 26% of
exchange-based platinum plans, 44% of gold plans, 54% of silver plans, and 82% of bronze plans required enrollees to
meet a deductible before prescription drug coverage began. Plans are listed in order from most comprehensive
(platinum) to least comprehensive (bronze).
39
   Kaiser Family Foundation, Employer Health Benefits: 2017 Annual Survey, Chapter 9, at https://www.kff.org/report-
section/ehbs-2017-section-9-prescription-drug-benefits/. The Kaiser data indicate that the differential has increased, but
2017 is not directly comparable to some previous years due to a change in methodology.

Congressional Research Service                                                                                         11
Frequently Asked Questions About Prescription Drug Pricing and Policy
enrollees in employer-sponsored health plans with three or more drug tiers had an average co-
payment of $110 for a high-priced tier-four drug, compared to an $11 co-payment for a tier-one
generic drug.
The cost-sharing increases appear to have been partially moderated by other developments. The
ACA capped total annual out-of-pocket spending in many commercial health plans, eliminated
cost sharing for contraceptives, and reduced cost sharing for Part D enrollees.40 Pharmaceutical
manufacturers have expanded patient assistance via discount coupons (which cover a portion of
required health plan cost sharing) and patient assistance programs (which provide aid based on
health condition and annual income).41 Generic drug-use rates, for which cost sharing is low, have
continued to increase.
According to some recent studies of insured consumers, average out-of-pocket spending for retail
drugs has declined in the past several years. However, the number of consumers with high out-of-
pocket costs—such as those with serious conditions or those prescribed specialty drugs—has
increased.
Caps on Annual Out-of-Pocket Spending
Many private health insurance plans place an annual cap, or maximum, on enrollee out-of-pocket spending for covered
health care services, after which the payer covers the cost. For 2018, the Patient Protection and Affordable Care Act
(ACA; P.L. 111-148, as amended) caps out-of-pocket spending at $7,350 for self-only coverage and $14,700 for family
coverage. The spending limit includes out-of-pocket payments for prescription drugs. Medicare Part D does not have
an absolute out-of-pocket cap. For 2018, Medicare Part D enrollees who incur $5,000 in annual out-of-pocket
spending enter the catastrophic portion of the benefit, in which they pay the greater of 5% coinsurance or a nominal,
set co-payment.
Source: Out-of-print CRS Report R42069, Private Health Insurance Market Reforms in the Patient Protection and
Affordable Care Act (ACA), available upon request.
Notes: Only certain grandfathered private plans do not have to comply with the out-of-pocket cap.
A 2016 study of enrollees in large employer-sponsored health plans found that average out-of-
pocket spending declined to $144 in 2014 from a recent high of $167 in 2009.42 But nearly 3% of
enrollees had out-of-pocket costs of more than $1,000 in 2014, accounting for about one-third of
drug spending and also one-third of all out-of-pocket spending. The share of people with high
drug costs has tripled since 2004.
A separate study of drug claims in commercial health plans found that median out-of-pocket
spending for outpatient specialty drugs (those costing $600 or more per month) rose from $24 per
month in 2003 to $35 per month in 2014, a 46% increase. During the same period, median out-of-
pocket spending for non-specialty drugs declined 57%, from $14 to $6 per month.43
40
Departments of Labor, HHS, and the Treasury, “FAQS About Affordable Care Act Implementation Part 36,” January
9, 2017, at https://www.cms.gov/CCIIO/Resources/Fact-Sheets-and-FAQs/Downloads/ACA-FAQs-Part36_1-9-17-
Final.pdf.
41
See IMS, Medicines Use and Spending in the U.S.: A Review of 2015 and Outlook to 2020, p. 28, April 2016, at
http://www.imshealth.com/en/thought-leadership/ims-institute/reports/medicines-use-and-spending-in-the-us-a-review-
of-2015-and-outlook-to-2020.
42
Peterson-Kaiser Health System Tracker, “Examining High Prescription Drug Spending for People with Employer
Sponsored Health Insurance,” October 27, 2016, at http://www.healthsystemtracker.org/insight/examining-high-
prescription-drug-spending-for-people-with-employer-sponsored-health-insurance/. The 2009 figure of $167 is about
$185 in 2014 dollars.
43
Stacie B. Dusetzina1, “Share Of Specialty Drugs In Commercial Plans Nearly Quadrupled, 2003–14,” Health Affairs,
vol. 35 no. 7, July 2016 , pp. 1241-1246. Dollar figures were inflation-adjusted to 2014 levels. Mean spending for
(continued...)
Congressional Research Service 12Frequently Asked Questions About Prescription Drug Pricing and Policy
According to the NHE, per person out-of-pocket spending for retail prescription drugs declined
from $146 in 2010 to $140 in 2016. It is forecast to dip to $137 in 2017 and then gradually
increase to $207 by 2026.44 (See Figure 5.) Because out-of-pocket spending is expected to rise
more slowly than overall U.S. retail drug spending in the next decade, out-of-pocket spending is
forecast to continue to decline as a share of retail drug expenditures.
Figure 5. Per Capita Out-of-Pocket Spending for Retail Prescription Drugs
(projected increases in out-of-pocket spending)
Source: CMS, National Health Expenditure forecast data.
Government Role in Prescription Drug Spending
How Much U.S. Drug Spending Is Paid by Government Programs?
Congress and presidential administrations have expanded subsidized drug coverage to tens of
millions of consumers during the past decade by implementing Medicare Part D and expanding
eligibility for Medicaid as part of the ACA.45 As a result, the government share of U.S. retail
prescription drug spending (federal, state and local) rose from about 25% in 2005—the year
before Part D took full effect—to an estimated 44.1% in 2017. The government share of drug
spending is forecast to rise to 47% by 2026.46 (See Figure 6.)
(...continued)
specialty drugs rose from $41 in 2003 to $77 in 2014, while mean spending on non-specialty medications decreased
from $19 to $11.
44
CMS, “National Health Expenditure Projections 2017-2026,” Table 11, at https://www.cms.gov/Research-Statistics-
Data-and-Systems/Statistics-Trends-and-Reports/NationalHealthExpendData/NationalHealthAccountsProjected.html.
45
For example, the federal government subsidizes about 75% of the basic Medicare Part D benefit. See CRS Report
R40611, Medicare Part D Prescription Drug Benefit.
46
CMS, “National Health Expenditure Projections 2017-2026,” Table 11, at https://www.cms.gov/Research-Statistics-
Data-and-Systems/Statistics-Trends-and-Reports/NationalHealthExpendData/NationalHealthAccountsProjected.html.
Congressional Research Service 13Frequently Asked Questions About Prescription Drug Pricing and Policy
Figure 6. Share of Spending for Retail Prescription Drugs by Source
(total retail prescription drug spending broken down by payer share)
Source: CMS, National Health Expenditure historical and forecast data.
Notes: The “other payers insurance” category includes the State Children’s Health Insurance Program, the
Department of Defense, and the Department of Veterans Affairs. The other payers category includes worksite
health care, other private revenues, Indian Health Service, workers’ compensation, general assistance, maternal
and child health, vocational rehabilitation, Substance Abuse and Mental Health Services Administration, other
federal programs, other state and local programs, and school health.
How Does the Federal Government Pay For Prescription Drugs?
Unlike many other industrialized nations,47 the United States does not operate a single,
centralized system for administering government-sponsored drug benefits, procuring
pharmaceuticals, or setting drug prices. Instead, the various departments and agencies that
oversee federal health programs operate a range of congressionally mandated drug discount and
contracting systems, including market-based negotiations in Medicare Part D, direct procurement
in the Veterans Health Administration, and a combination of mandatory rebates and negotiations
in Medicaid. Separately, FDA regulates the safety and effectiveness of prescription drugs.48
Congress has not given FDA authority to set drug prices or to consider prices as part of its drug
approval process.
Federal agencies can secure substantial discounts for prescription drugs under this decentralized
system. However, price discounts vary widely among federal programs. For example, according
to a 2015 HHS Office of Inspector General report, Medicaid rebates were equal to 47% of
Medicaid spending in 2012, while rebates made up a smaller 15% of Part D spending that same
year.49 Medicaid rebates for some drugs were more than 10 times larger than Part D rebates for
47
See “Is U.S. Prescription Drug Spending Higher Than in Other Nations?”
48
Beginning with the Food and Drugs Act of 1906, Congress has incrementally refined and expanded FDA’s
responsibilities regarding drug approval and regulation. CRS Report R41983, How FDA Approves Drugs and
Regulates Their Safety and Effectiveness. See, in particular, Federal Food, Drug, and Cosmetic Act (FFDCA) §§505
(new drugs), 501 (adulteration), and 502 (misbranding). For an easier-to-read description, see CRS Report R41983,
How FDA Approves Drugs and Regulates Their Safety and Effectiveness.
49
HHS, Office of Inspector General (OIG), “Medicaid Rebates for Brand-Name Drugs Exceeded Part D Rebates by a
(continued...)
Congressional Research Service 14You can also read