FRESHWATER ECOSYSTEM APPLICATION OF ASSESSMENT METHODOLOGY - UNSCEAR
←
→
Page content transcription
If your browser does not render page correctly, please read the page content below
ATTACHMENT F-3: FRESHWATER ECOSYSTEM APPLICATION OF ASSESSMENT METHODOLOGY    1

United Nations Scientific Committee on the Effects of Atomic Radiation

                                                                             ATTACHMENT F-3

          FRESHWATER ECOSYSTEM APPLICATION OF
               ASSESSMENT METHODOLOGY
         UNSCEAR 2013 Report, Annex A, Levels and effects of radiation exposure due
          to the nuclear accident after the 2011 great east-Japan earthquake and tsunami,
                Appendix F (Assessment of doses and effects for non-human biota)

Notes

The designations employed and the presentation of material in this publication do not imply the
expression of any opinion whatsoever on the part of the Secretariat of the United Nations
concerning the legal status of any country, territory, city or area, or of its authorities, or
concerning the delimitation of its frontiers or boundaries.
©
    United Nations, August 2014. All rights reserved, worldwide.

This publication has not been formally edited.
2 ATTACHMENT F-3: FRESHWATER ECOSYSTEM APPLICATION OF ASSESSMENT METHODOLOGY
Contents
NOTES ......................................................................................................................................... 1
I. METHODOLOGY APPLIED TO THE ASSESSMENT ON FRESHWATER
ECOSYSTEM ........................................................................................................................ 2
II. DOSE RATES TO FRESHWATER FISH FROM FUKUSHIMA REGION ....................... 4
REFERENCES ............................................................................................................................. 5
I. METHODOLOGY APPLIED TO THE ASSESSMENT ON
FRESHWATER ECOSYSTEM
1. As a result of atmospheric deposition from the Fukushima-Daiichi nuclear power
station (FDNPS) in March 2011, freshwater ecosystems had elevated levels of 131I, 134Cs, and
137
Cs in Fukushima Prefecture and also in Iwate, Miyagi, and Ibaraki prefectures.
2. Monitoring of concentrations of radionuclides in inland waters was organized by the
Japanese Ministry of Environment and a database providing information on activity
concentrations in freshwater biota was provided to the Committee. This database contained
measured radionuclide activity concentrations in biota samples (mainly radiocaesium in fish)
from Japanese freshwater ecosystems (2011–2012) and some data on radionuclide activity
concentrations in water and sediments. The typical fish species for which data were reported
were the common carp (Cyprinus carpio), ayu (Plecoglossus altivelis), Seema (Oncorhynchus
masou masou), Japanese smelt (Hypomesus nipponensis), Japanese dace (Tribolodon
hakonensis), char (Salvelinus), kokanee (Oncorhynchus nerka) and others. These species were
expected to represent critical groups of fish, i.e. those which would have higher radionuclide
concentrations among more than 20 species of fish inhabiting Japanese lakes and rivers.
Locations of freshwater sampling stations were indicated by their geographical coordinates,
without local names of lakes/rivers.
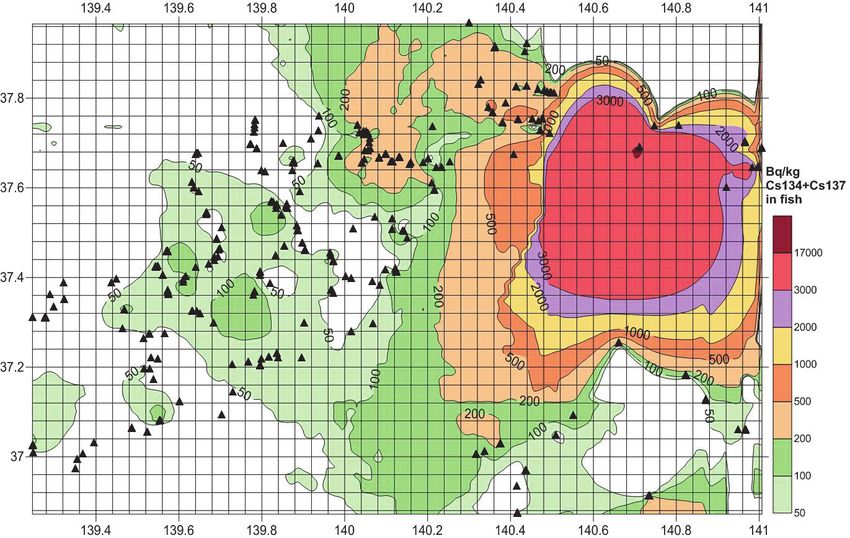
3. The locations of sampling stations on lakes and rivers of Japan affected by radioactive
deposition from FDNPS are shown in figure I. The concentration levels of radiocaesium
(134Cs+137Cs) in fish are also shown in figure I together with their geographical location within
the Fukushima region. The sampling points presented in the database did not cover the area of
maximum deposition density (above 1,000 kBq/m2). Therefore, the activity concentration in
fish in this area was reconstructed using the correlation between deposition density and
concentrations in fish in Japanese lakes that had been studied.ATTACHMENT F-3: FRESHWATER ECOSYSTEM APPLICATION OF ASSESSMENT METHODOLOGY 3 Figure I. Concentration of radiocaesium (134Cs+137Cs) in freshwater fish in the Fukushima region according to the monitoring data from Japan (2011–2012) [Fukushima Prefecture, 2012] 4. From the database, the highest levels of radiocaesium in fish were measured in a local area situated to the north and north-west of FDNPS (within coordinates 37.6–37.7N; 140.5– 140.9E); characterized by 137Cs deposition density from the atmosphere in the range 100,000– 200,000 Bq/m2. A representative lake in this area is Dam Lake Hayama (38 km to the north- north-west of FDNPS covering an area of 80.8 km2). Radiocaesium activity concentrations in fish from Lake Hayama are presented in table 1. A representative river was provided by Abukuma River, entering the sea 70 km to the north of FDNPS; Mano River and others were also considered. Typical activity of radiocaesium in fish in this contaminated local area was approximately 2,000–3,000 Bq/kg; a maximum level of 18,700 Bq/kg was measured in a single fish sample in March 2012. Very limited data on concentrations in sediment indicated levels of 4,400 Bq/kg d.w. of 134Cs, and 5,500 Bq/kg d.w. of 137Cs in water bodies from this area. 5. Some rivers within the local area with highest deposition densities flow into the marine coastal zone near FDNPS. Many fish species in these rivers are migratory types that spend part of the year in the marine environment and enter rivers to spawn. Therefore, the sources of activity levels in fish were both inland waters and seawater. 6. Fishing had not been stopped in lakes and rivers, but the Japanese Nuclear Emergency Response Headquarters had imposed capture self-control and shipping restriction of fish as foodstuffs — as exemplified by ayu (Plecoglossus altivelis), char, Japanese dace, Japanese eel, common carp, gin-buna (Carassius auratus langsdorfi), seema and eperla (Japanese smelt) — pursuant to the Act on Special Measures Concerning Nuclear Emergency Preparedness. 7. Outside the local area with highest deposition densities, activity concentrations in fish from inland waters were lower by a considerable margin, reflecting the reduced levels of radiocaesium deposition at these locations (see figure I).
4 ATTACHMENT F-3: FRESHWATER ECOSYSTEM APPLICATION OF ASSESSMENT METHODOLOGY
8. In the area with 137Cs deposition density characterized by the range 50,000–
100,000 Bq/m2, a representative lake is Lake Akimoto (83 km to the west-north-west from
FDNPS). Lake Akimoto is mezotrophic, its area is 3.6 km2 and volume 0.04 km2.
Radiocaesium activities in fish from Lake Akimoto are presented in table 1. In sediments, the
137
Cs activity concentration was 180 Bq/kg d.w., and that of 134Cs was 130 Bq/kg d.w.
9. In the area with 137Cs deposition density in the range 10,000–50,000 Bq/m2, a
representative lake is Lake Inawashiro (83 km to the west from FDNPS; area 103.3 km2,
volume 5.4 km2). Radiocaesium activities in fish from Lake Inawashiro are presented in
table 1.
10. Using data from three representative lakes (Inawashiro, Akimoto and Hayama), linear
equations between the levels of 137Cs deposition density and the radiocaesium activity
concentrations in lake fish were constructed (see table 1). Using these equations, missing data
on concentrations in fish in areas of maximum deposition density (5,000 kBq/m2 ) were
reconstructed. The results are reported in table 1.
Table 1. Parameters of correlation between deposition density and concentration in fish for
representative Japanese lakes (2011–2012)
Name of lake Location Average deposition Average activity of Highest activity of
(lat, long) density of 137Cs radiocaesium in fish radiocaesium in fish
(Bq/m2) (Bq/kg) (Bq/kg)
Hayama 37.716N, 140.81E 187,190 560 ± 186 1,100
Akimoto 37.65N, 140.135E 51,350 305 ± 120 670
Inawashiro 37.48N, 140.1E 13,990 116 ± 78 250
Hypothetical lake in 500,000 12,000* 22,000*
the zone of highest
deposition density
*
Predicted values. Relations between the deposition density and concentrations in fish follow linear equations:
y=2.379x+127.1 (for average); and y=4.439x+300.4 (for maximal values); y [Bq/kg]; x [kBq/m2].
II. DOSE RATES TO FRESHWATER FISH FROM FUKUSHIMA
REGION
11. Dose rates to fish from radiocaesium in Japanese lakes and rivers were calculated using
the ERICA Tool on the basis of monitoring data.
12. Dose rates to fish from Lake Akimoto (summer 2011–2012) were in the range 0.05–
0.1 µGy/h for fish with average activity concentration levels. For fish with maximum activity
concentration levels, dose rates were in the range 0.17–0.2 µGy/h (depending on the period fish
were assumed to stay near the lake-bottom sediments).
13. Estimated dose rates for fish from local areas with 137Cs deposition density in the range
100,000–200,000 Bq/m2 fell between 0.4 and 3 µGy/h; dose rates to the fish sample with the
maximum measured activity concentration were within the range 3.7–6.2 µGy/h (depending on
the period the fish were assumed to stay near the lake-bottom sediments).
14. Dose rates were calculated for hypothetical fish inhabiting a lake within local areas
with maximum deposition density. For pelagic fish, an average dose rate of 2.3 µGy/h, and a
maximum of 4.3 µGy/h were calculated. For benthic fish, the average dose rate was 34 µGy/h,
and the maximum was 36 µGy/h. These levels exceeded the threshold believed to be protectiveATTACHMENT F-3: FRESHWATER ECOSYSTEM APPLICATION OF ASSESSMENT METHODOLOGY 5
of vertebrate organisms [ICRP, 2008; Hosseini et al., 2010]. At chronic exposures at these dose
rates some negative effects on fitness, reproduction and life shortening could be expected in
individual fish, although population effects should not be observed.
The dose rates to fish in freshwater ecosystems in the majority of other areas receiving
deposition from the FDNPS accident did not reach the threshold levels for chronic exposure
above which deterministic effects of radiation are expected in freshwater biota [ICRP, 2008;
Hosseini et al., 2010]. Only in the local zone of maximum deposition density was there a
substantial hypothetical risk that some negative effects of radiation might appear in individual
organisms under conditions of chronic exposure.
References
Fukushima Prefecture. Emergency monitoring test result of marine products of Fukushima prefecture, 1. The
results of inspection. [Internet] Available from (http://www.pref.fukushima.lg.jp/sec/36035e/suisanka-
monita-top.html) on 12 November 2012. (Japanese)
Hosseini, A., N.A. Beresford, J.E. Brown et al. Background dose-rates to reference animals and plants arising
from exposure to naturally occurring radionuclides in aquatic environments. J Radiol Prot 30(2): 235-264
(2010).
ICRP. Environmental protection: The concept and use of reference animals and plants. ICRP Publication 108.
Annals of the ICRP 38. International Commission on Radiological Protection, Elsevier Ltd., 2008.You can also read