Fuelling walking and cycling: human powered locomotion is associated with non-negligible greenhouse gas emissions
←
→
Page content transcription
If your browser does not render page correctly, please read the page content below
www.nature.com/scientificreports

            OPEN           Fuelling walking and cycling:
                           human powered locomotion is
                           associated with non-negligible
                           greenhouse gas emissions
                           Anja Mizdrak1 ✉, Linda J Cobiac2, Christine L Cleghorn1, Alistair Woodward3 & Tony Blakely1,4

                           Reducing motorized transport and increasing active transport (i.e. transport by walking, cycling and
                           other active modes) may reduce greenhouse gas (GHG) emissions and improve health. But, active
                           modes of transport are not zero emitters. We aimed to quantify GHG emissions from food production
                           required to fuel extra physical activity for walking and cycling. We estimate the emissions (in kgCO2e)
                           per kilometre travelled for walking and cycling from energy intake required to compensate for increased
                           energy expenditure, and data on food-related GHG emissions. We assume that persons who shift from
                           passive modes of transport (e.g. driving) have increased energy expenditure that may be compensated
                           with increased food consumption. The GHG emissions associated with food intake required to fuel a
                           kilometre of walking range between 0.05 kgCO2e/km in the least economically developed countries to
                           0.26 kgCO2e/km in the most economically developed countries. Emissions for cycling are approximately
                           half those of walking. Emissions from food required for walking and cycling are not negligible in
                           economically developed countries which have high dietary-related emissions. There is high uncertainty
                           about the actual emissions associated with walking and cycling, and high variability based on country
                           economic development. Our study highlights the need to consider emissions from other sectors when
                           estimating net-emissions impacts from transport interventions.

                           Globally, transport is responsible for about a quarter of total energy related greenhouse gas (GHG) emissions, and
                           transport emissions have increased at a faster rate than any other energy end-use sector1. Light vehicles account
                           for the use of half of all transport energy and around 40% is used in urban transport1.
                               The transport sector also influence population health – directly through road injury and indirectly through
                           conditions caused by air pollution and exposure to noise2. There are also substantial indirect effects, through the
                           influence of transport systems on patterns of physical activity2. Reducing motorized transport and increasing
                           active transport (i.e. active modes of transport such as walking and cycling) may both reduce GHG emissions and
                           improve population health. Recent research has quantified the co-benefits of increasing active transport in a range
                           of settings – from city-level3 to international assessments4.
                               Increasing active transport appears to increase total physical activity5, leading, by a variety of mechanisms
                           to a reduction in risk of non-communicable diseases and improvements in mental health6,7. Small increases in
                           walking and cycling would be expected to result in weight loss due to the increased energy expenditure required
                           (relative to sedentary time), unless energy intake is increased to compensate for the additional expenditure.
                           However, reviews of the effect of active transport interventions on body weight are inconclusive8,9. Those who
                           walk and cycle are reported to be lighter than people who travel by car, but most studies have been cross-sectional,
                           leaving doubts about whether people shifting to active transport lose weight as a result or are lower weight for
                           other reasons (i.e. confounding). Few longitudinal studies have tackled this question. Mode shift from passive
                           to active forms of transport has been associated with reductions in body mass index (BMI)5,10,11. However, these

                           1
                            Burden of Disease Epidemiology, Equity and Cost-Effectiveness Programme (BODE 3), Department of Public
                           Health, University of Otago (Wellington), 23 Mein Street, Newtown, Wellington, New Zealand. 2Centre for
                           Population Approaches to Non-Communicable Disease Prevention, Nuffield Department of Population Health,
                           University of Oxford, Old Road Campus, Oxford, United Kingdom. 3Epidemiology and Biostatistics, Department of
                           Population Health, University of Auckland, Auckland, New Zealand. 4Melbourne School of Population and Global
                           Health, University of Melbourne, Melbourne, Australia. ✉e-mail: anja.mizdrak@otago.ac.nz

Scientific Reports |   (2020) 10:9196 | https://doi.org/10.1038/s41598-020-66170-y                                                           1
www.nature.com/scientificreports/ www.nature.com/scientificreports
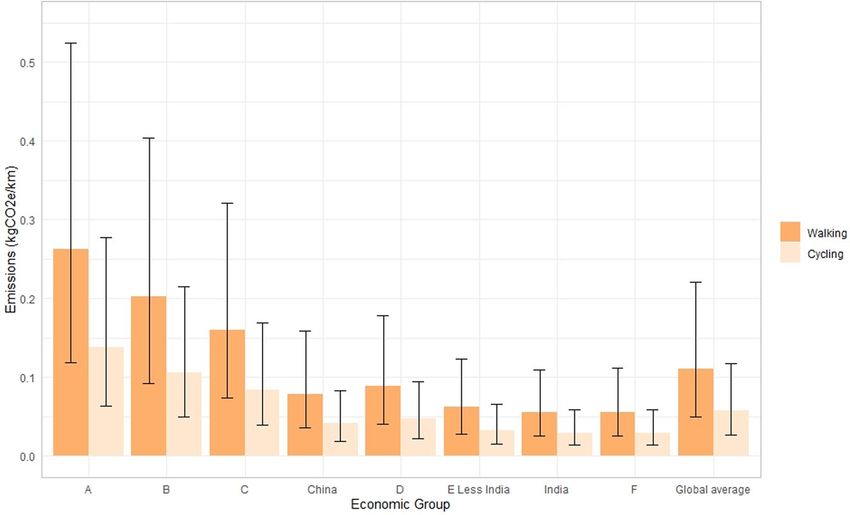
Figure 1. Emissions associated with travelling a kilometre, by walking, and cycling, assuming full energy
compensation for countries grouped by level of economic development (from most economically developed (A)
to least economically developed (F)).
longitudinal studies do not include comprehensive assessments of all changes in individual circumstances that
may confound the observed relationship. Whilst some capture major life events (e.g. moving house, new job),
none capture changes in dietary patterns or changes in neighbourhoods – factors that could influence both active
transport and dietary patterns. Therefore, studies of active transport do not currently provide us with definitive
information on the extent or nature of compensatory food intake in response to increased walking and cycling.
More broadly, the evidence on the nature and extent of compensatory food intake in response to physical
activity more generally (and not just through active transport) is limited by the lack of adequately powered trials
of sufficient duration that have adequately measured both energy expenditure and energy intake12. Although
meta-analysis of laboratory studies show that individuals tend not to compensate for increased energy expend-
iture from exercise in the immediate hours after exercise13, the extent and nature of compensation for increased
energy expenditure from physical activity in the longer term is not well established12.
For the purpose of this analysis, we assume that individuals who take up walking and cycling, or increase
the amount by which they walk and cycle, would need to consume more food if they were to compensate for the
increase in energy expenditure. The emissions impacts of this potential increase in food intake have not been
considered in studies estimating the impact of increased active travel on GHG emissions. If we are to accurately
estimate the net GHG emissions impacts of changing travel patterns, then we should include the environmental
consequences of food needed to drive human-powered locomotion.
Berners-Lee (2010) estimated that a mile cycled (in the United Kingdom (UK)) generates between 65 gCO2e
and 2,800 gCO2e depending on what the journey was powered by (bananas or air-freighted asparagus) 14.
The notion that energy expended from a cycle ride may be substituted directly by air-freighted asparagus is
far-fetched, but underlines the point that there is a high carbon cost of modern food systems.
We now have data on the dietary GHG emissions associated with entire diets and not just individual food
commodities. Estimates of dietary GHG emissions for adults range widely from around 100 gCO2e/100 kcal in
China15 to 800 gCO2e/100 kcal in Australia16,17. These estimates of average GHG emissions associated with food
intake allow us to build a more complete picture of the potential emissions associated with different active trans-
port modes.
In this paper, we estimate the magnitude of emissions associated with fuel (in terms of food) required for
walking and cycling. By combining information on energy expenditure from active transport and dietary pat-
terns, we are able to estimate emissions required to travel a kilometre by walking and cycling. The emissions
associated with energy required to fuel walking and cycling may not represent the actual emissions associated
with active transport in real world settings where additional energy expenditure is only partially compensated
with increased energy intake. Therefore, we explore the likely magnitude of emissions in a real-world setting with
partial compensation of energy intake, using estimates from a UK cohort study.
Results
Using estimates of energy availability18 (i.e. the energy available to be consumed, see Supplementary Table 1),
we estimate that the additional energy expenditure required to travel 1 km ranged from 48 to 76 kcal for walking
and 25 to 40 kcal for cycling (Supplementary Table 2). Based on the average global diet18, emissions required for
walking are up to 0.11 kgCO2e/km (95% uncertainty interval (UI) 0.05 to 0.22)) and up to 0.14 kgCO2e/km (95%
UI 0.06 to 0.28)) for cycling when energy expenditure is fully compensated with increased energy intake (Fig. 1).
There is large variation between countries, in the most economically developed, emissions associated with energy
required for walking are 2.4 times the global average.
Scientific Reports | (2020) 10:9196 | https://doi.org/10.1038/s41598-020-66170-y 2www.nature.com/scientificreports/ www.nature.com/scientificreports
Estimated compensation of energy intake. We estimate that 57% of additional energy expenditure was
compensated with additional food intake in the cohort study reported by Martin et al. (2015), with a range of 19%
to 96% based on the confidence interval around the reported change in BMI. In the most economically developed
countries (i.e. the group that includes the UK), 57% compensation would equate to net emissions of 0.15 kgCO2e/
km for walking and 0.08 kgCO2e/km for cycling; 19% compensation equates to 0.05 kgCO2e/km for walking and
0.03 kgCO2e/km for cycling; 96% compensation equates to 0.25 kgCO2e/km for walking and 0.13 kgCO2e/km
for cycling. This provides a potential range for the actual emissions impacts of walking and cycling in the most
economically developed countries.
Discussion
We estimate that walking and cycling an additional kilometre may result in GHG emissions up to 0.26 (95%
UI 0.12 to 0.53) and 0.14 kgCO2e/km (95% UI 0.06 to 0.28)), respectively, when additional energy expenditure
is fully compensated with increased food intake in the most economically developed countries. Our current
best estimate for the most economically developed countries suggests that the actual emissions associated with
walking and cycling will reflect partial compensation of energy intake - from 19% to 96% of the required energy
intake. There is wide variability in emissions required to compensate for walking and cycling between countries,
representing nearly a 5-fold difference between the most and least economically developed countries.
IPCC estimates that direct emissions from cars range from 0.08–0.21 kgCO2/km1, with a similar range of
estimates in a more recent ‘well-to-wheel’ life cycle assessment (in the range of 0.15 kg/km to 0.26 kg/km19–21).
Factors such as the composition of the vehicle fleet (age, manufacturer, size, etc), fuel type and where it is obtained
from, driving behaviour, and road patterns are relevant. When comparing vehicle emissions with our estimates
for walking and cycling, it is important to remember differences in the sources of emissions. Vehicular emissions
are primarily drawn from non-renewable stocks, whereas estimates of dietary emissions include both renewable
and non-renewable sources. Nevertheless, our estimates suggest that the net emissions associated with the ‘fuel’
required for driving, walking, and cycling may be comparable in some settings. Our intention was to provide an
estimate of emissions required for walking and cycling, and explore the likely extent of compensatory intake. Our
study demonstrates that overall assessments of the emissions impact of transport interventions should consider
emissions impacts associated with diets. Taking account of walking and cycling emissions may suggest that car
share schemes could have a bigger positive emissions impact than increasing walking, and (all else being equal)
interventions that decrease vehicle use through increased cycling will have greater emissions benefits than those
that increase walking.
Active transport has many advantages: more pleasant urban living, reduced air pollution, reduced
non-communicable disease. But, to maximise the effect on GHG emissions achieved by increasing active trans-
port, we need to address dietary patterns. Emissions associated with active transport will be lower if walking
and cycling are powered by with low carbon dietary options, and/or associated with less than full compensation
thereby resulting in lower obesity rates.
The GHG emissions associated with many modern diets can be reduced without health penalties. First, the
way we as a society use energy to produce food can be altered. Like transport, agriculture is responsible for a
substantial proportion of emissions, up to one-third of all anthropogenic GHG emissions by some estimates22.
Second, given emissions associated with different food groups (given current food systems) range widely - from
0.02 (sugar, legumes) to 5.6 gCO2e/kcal (ruminant meats) in one global study18, consumer switching to less energy
intense foods could reduce dietary emissions by up to 70–80%22. Third, food waste matters: the emissions foot-
print of the edible food that is lost or wasted each year is 3.5 GtCO2e/year23, equivalent to 50% of all transport
emissions1. In high-income countries reductions in emissions are largely proportional to the magnitude of meat
and dairy reduction22. That is, in order to reduce GHG emissions we need to encourage changes in what we eat as
well as reducing motorized vehicle use.
At present, the magnitude of the impact of increased active transport on obesity is unclear and is likely to
vary by setting and intervention. Quantifying the extent and nature of compensatory energy intake is needed to
establish the health impact and GHG emissions impacts associated with active travel. Our results demonstrate
that even in the countries with high dietary emissions, the emissions associated with walking and cycling may
be considerably lower than the emissions associated with driving if individuals only partially compensate for the
increased energy expenditure.
We estimate the compensation of additional energy expenditure with increased food intake ranged from 19%
to 96% in one UK study that reported a BMI reduction with increased active transport10. For walking, this would
translate to a range in diet-related emissions between 0.03 to 0.13 kgCO2e/km, equivalent to 12% to 63% of the
emissions associated with the fuel for an average size car in the UK (0.21 kgCO2e/km24).Future research is needed
to establish how compensatory behaviours vary between settings and across different interventions. For example,
we would hypothesise that a media campaign that encourages active transport as a way to lose weight may be
associated with lower levels of compensatory food intake and thereby may achieve greater population level reduc-
tions in obesity than an equivalent campaign encouraging active transport to reduce congestion.
To our knowledge, this is the first international estimate of GHG emissions associated with food intake
required per kilometre travelled by active transport. Our results demonstrate the importance of including emis-
sions associated with food intake when estimating the net GHG emissions impacts of interventions to increase
active transport.
Our estimates are indicative of general patterns (i.e. that emissions required to fuel walking may be similar to
emissions associated with fuelling a car when diets are highly carbon-intensive) but merit further consideration
in more specific contexts. For example, how the emissions of walking or cycling compare to those of driving for
specific trips in specific cities.
Scientific Reports | (2020) 10:9196 | https://doi.org/10.1038/s41598-020-66170-y 3www.nature.com/scientificreports/ www.nature.com/scientificreports
We limited our scope to emissions associated with the fuel required to walk and cycle a kilometre and do
not include embodied emissions (e.g. emissions associated with the manufacture of cars or the construction
and maintenance of transport systems). For interventions that switch selected (car) trips to walking or cycling,
fuel-vs-fuel comparison may be appropriate, noting that the energy required to obtain and transport the fuel
should be included (i.e. a well-to-wheels approach). Ideally, assessments of specific interventions should incorpo-
rate a wider view that considers the fuel-vs-fuel trade-offs, embodied emissions, and broader impacts (e.g. health
and social costs of emissions), but adopting a wider view is a demanding and complex undertaking.
We use a single, global study as the source of both dietary emissions and energy availability18. As the data
reflect energy availability, it is not subject to individual-level under-reporting present in survey data that would
(falsely) deflate estimates of excess energy required for walking and cycling. Whilst estimates of energy availability
will result in an overestimate of the energy intake required, they more accurately reflect the emissions associated
with additional energy intake as they account for the amount of food lost and wasted prior to consumption. This
means that our estimates implicitly account for food waste, assuming that food waste patterns do not change
under increased active travel.
The estimates of dietary GHG emissions used are based on grouping countries at similar levels of economic
development, using a consistent methodology. However, these results may mask variation in the dietary green-
house gas emissions between countries with similar levels of economic development. This means that the true
variation in emissions associated with walking and cycling is likely to be wider than represented here.
We explore the sensitivity of our results to assumptions around compensation of energy intake by modelling
BMI changes and estimated emissions per km for a population based on a UK cohort study. The UK study was
selected as it was the only longitudinal study we identified that presented sufficient data to estimate the extent
of compensatory energy behaviour. However, our estimates of compensatory behaviour are based on aggregate
results and not an analysis conducted at the individual level. As neither diet nor energy intake were assessed in the
study, the observed change in weight may easily be confounded by other lifestyle changes accompanying trans-
port mode shift (e.g. change in diet, income, or family circumstance). The reported change in BMI corresponds
to a wide range in compensatory energy intake that is likely to be highly heterogeneous across individuals. The
sensitivity of emissions estimates to compensatory behaviours in our example clearly demonstrates the need for
better quantification of BMI changes and compensatory behaviour in the context of active transport.
If increased energy expenditure from active transport was not fully compensated, then both the food-related
emissions associated with active transport will be lower and a (modest) contribution will be made to lowering
obesity rates. Given the high impact of obesity on healthcare systems, and the high emissions associated with
healthcare (e.g. 10% of total emissions in the USA25), the indirect benefits of active transport (such as through
reduced health system burdens) onto emissions may be substantial, and warrant further research.
Conclusions
Emissions of food required per kilometre of walking are not negligible in economically developed countries
which have high dietary-related emissions. There is high uncertainty about the emissions associated with walking
and cycling, and variability correlated with economic development. Our study highlights the need to consider
emissions from other sectors when estimating net-emissions impacts from transport interventions.
Methods
We calculated GHG emissions required to power a kilometre of walking and cycling for countries at different
levels of economic development, as well as a global average using estimates of energy availability and dietary
greenhouse gas emissions from a single global study18. First, we estimated the additional energy intake that would
be required for travelling by walking and cycling relative to average daily activity. We then calculate the GHG
emissions associated with compensating for the additional energy expenditure using estimates of the emissions
per calorie associated with current dietary patterns. Finally, we explore the GHG emissions and BMI impacts
associated with partial compensation of energy expenditure.
Estimating excess energy expenditure. First, we calculated average energy expenditure in calories per
minute by dividing estimates of daily calorie availability by 1,440 (the total number of minutes in a day). We
assume that daily calorie availability data reflects energy intakes under current levels of energy expenditure (i.e.
resting energy expenditure plus activity associated with daily life – hereafter referred to as average daily life), and
the fact that some food is wasted prior to consumption23.
Next, we estimated the additional energy that would be required for a minute of travel by different modes of
transport using MET (metabolic equivalent of task) values from the Compendium of Physical Activities26. A MET
is the ratio of work metabolic rate to a standard resting metabolic rate, where one MET is equivalent to sitting
quietly26. We estimated a MET value for average daily life of 1.5 to reflect average daily energy expenditure across
a range of activities associated with daily living (e.g. sleep, occupation, personal care, housework). This is to reflect
that current energy intakes represent intakes associated with average daily energy expenditure and not resting or
basal rates of energy expenditure.
Walking was assigned a MET value of 3 (“walking, 2.5 mph, level, firm surface”), cycling a MET value of 4
(“bicycling, leisure, 5.5 mph”). Excess energy expenditure (i.e. excess relative to average daily life) was calculated
by multiplying current energy intake (per min) by the ratio of the MET value of the walking and cycling relative
to average daily life. We multiplied estimated excess energy expenditure by the time taken to walk and cycle
a kilometre to give an estimate of per kilometre travelled. Estimates of the speed of walking and cycling were
chosen to match with the selected MET values (i.e. 2.5 mph and 5.5 mph for walking and cycling respectively).
Supplementary Table S2 presents the estimated excess energy expenditure in each economic group.
Scientific Reports | (2020) 10:9196 | https://doi.org/10.1038/s41598-020-66170-y 4www.nature.com/scientificreports/ www.nature.com/scientificreports
Parameter Distribution Value
Mean: Reported value, SD:
Country-level energy availability Normal
5% of the reported value
MET value for walking* Normal Mean: 3, SD: 0.6
MET value for cycling* Normal Mean: 3.5, SD: 0.7
MET value for inactive time* Normal Mean: 1.5, SD: 0.3
Walking speed Normal Mean: 4 kph, SD: 0.8
Cycling speed Normal Mean: 8.9 kph, SD: 1.78
Mean: Reported value, SD:
Dietary greenhouse gas emissions** Normal
5% of the reported value
Table 1. Distributions around key parameters used in the analysis. MET: Metabolic equivalent of task. SD:
Standard deviation. *We assumed the SD was 20% of the mean value and then checked that the resulting
distributions corresponded with the range expected from the MET values associated with these activities. **We
assumed correlated uncertainty at the study level between greenhouse gas emissions and energy intake.
Emissions per calorie. We used data on dietary GHG emissions for current dietary patterns to estimate
emissions per 100 kcal. Dietary GHG estimates were taken from a study that use life-cycle assessment emissions
data to calculate annual per capita GHG emissions from food production for the 2009 global average diet, and
for groups of countries with similar levels of economic development18. The original analysis captured per capita
dietary demand across different food groups including cereals, sugar, oil, fruits, vegetables, dairy and eggs, fish,
and livestock18. Countries included in each economic development group, energy availability, and estimates of
dietary greenhouse gas emissions are reproduced (with permission) in Supplementary Table 1.
Emissions per kilometre. We multiplied estimates of the additional energy expenditure required for a kilometre
of travel by walking and cycling, with emissions per calorie to give the associated dietary-related GHG emissions.
Uncertainty around emissions. We incorporate uncertainty around estimates of calorie availability, MET
values, and dietary GHG emissions. Table 1 displays the distributions selected around each of the input parame-
ters. Uncertainty intervals were calculated from 10,000 iterations of a Monte Carlo analysis that allowed the key
parameters to vary randomly according to their pre-specified probability distributions. All calculations were done
in Microsoft Excel; the uncertainty analysis was conducted using Ersatz, a specialised plug-in27.
BMI and emissions under partial compensation. We explored the likely extent of compensation of
energy intake Data to estimate the extent of energy compensation was drawn from a UK cohort study examining
the longitudinal impact of active transport10. This study was selected as it provided the starting BMI and average
‘dose’ of active transport that enabled us to estimate the levels of compensation associated with observed BMI
changes. Martin et al. observed a −0.59 (95% CI −1.11 to −0.06) change in BMI for individuals who switched
from commuting by motor vehicle to commuting by active transport. The population studied had a starting BMI
of 26.1, and reported a 13.9 min/day commute time after switching to active transport10.
We estimated the extent of compensation of energy expenditure associated with observed BMI changes using
Hall et al.’s estimate that an energy deficit of 100 kJ (24 kcal) per day results in 1 kg of weight loss, with 50% of the
weight change achieved in the first year and 95% achieved in 3 years28. We assumed an average height of 1.69 m
(the average height in England29).
Data availability
The dataset(s) supporting the conclusions of this article are included within the article and its Supplementary
Materials files.
Received: 20 September 2019; Accepted: 15 May 2020;
Published: xx xx xxxx
References
1. Sims, R. In Climate Change 2014: Mitigation of Climate Change. Contribution of Working Group III to the Fifth Assessment Report of
the Intergovernmental Panel on Climate Change (ed IPCC) (2014).
2. Woodcock, J., Banister, D., Edwards, P., Prentice, A. M. & Roberts, I. Energy and transport. The Lancet 370, 1078–1088, https://doi.
org/10.1016/s0140-6736(07)61254-9 (2007).
3. Woodcock, J. et al. Public health benefits of strategies to reduce greenhouse-gas emissions: urban land transport. The Lancet 374,
1930–1943, https://doi.org/10.1016/s0140-6736(09)61714-1 (2009).
4. Rojas-Rueda, D. et al. Health Impacts of Active Transportation in Europe. PLoS One 11, e0149990, https://doi.org/10.1371/journal.
pone.0149990 (2016).
5. Foley, L., Panter, J., Heinen, E., Prins, R. & Ogilvie, D. Changes in active commuting and changes in physical activity in adults: a
cohort study. Int J Behav Nutr Phys Act 12, 161, https://doi.org/10.1186/s12966-015-0323-0 (2015).
6. Lee, I. M. et al. Effect of physical inactivity on major non-communicable diseases worldwide: an analysis of burden of disease and
life expectancy. The Lancet 380, 219–229, https://doi.org/10.1016/s0140-6736(12)61031-9 (2012).
7. Cooney, G. M. et al. Exercise for depression. Cochrane Database Syst Rev, CD004366, https://doi.org/10.1002/14651858.CD004366.
pub6 (2013).
8. Brown, V., Moodie, M., Mantilla Herrera, A. M., Veerman, J. L. & Carter, R. Active transport and obesity prevention - A
transportation sector obesity impact scoping review and assessment for Melbourne, Australia. Prev Med 96, 49–66, https://doi.
org/10.1016/j.ypmed.2016.12.020 (2017).
Scientific Reports | (2020) 10:9196 | https://doi.org/10.1038/s41598-020-66170-y 5www.nature.com/scientificreports/ www.nature.com/scientificreports
9. Saunders, L. E., Green, J. M., Petticrew, M. P., Steinbach, R. & Roberts, H. What are the health benefits of active travel? A systematic
review of trials and cohort studies. PLoS One 8, e69912, https://doi.org/10.1371/journal.pone.0069912 (2013).
10. Martin, A., Panter, J., Suhrcke, M. & Ogilvie, D. Impact of changes in mode of travel to work on changes in body mass index:
evidence from the British Household Panel Survey. J Epidemiol Community Health 69, 753–761, https://doi.org/10.1136/jech-2014-
205211 (2015).
11. Mytton, O. T., Panter, J. & Ogilvie, D. Longitudinal associations of active commuting with body mass index. Prev Med 90, 1–7,
https://doi.org/10.1016/j.ypmed.2016.06.014 (2016).
12. Donnelly, J. E. et al. Does increased exercise or physical activity alter ad-libitum daily energy intake or macronutrient composition
in healthy adults? A systematic review. PLoS One 9, e83498, https://doi.org/10.1371/journal.pone.0083498 (2014).
13. Schubert, M. M., Desbrow, B., Sabapathy, S. & Leveritt, M. Acute exercise and subsequent energy intake. A meta-analysis. Appetite
63, 92–104, https://doi.org/10.1016/j.appet.2012.12.010 (2013).
14. Berners-Lee, M. How bad are bananas? The carbon footprint of everything (2010).
15. Song, G., Li, M., Fullana, I. P. P., Williamson, D. & Wang, Y. Dietary changes to mitigate climate change and benefit public health in
China. Sci Total Environ 577, 289–298, https://doi.org/10.1016/j.scitotenv.2016.10.184 (2017).
16. Hendrie, G. A., Baird, D., Ridoutt, B., Hadjikakou, M. & Noakes, M. Overconsumption of Energy and Excessive Discretionary Food
Intake Inflates Dietary Greenhouse Gas Emissions in Australia. Nutrients 8, https://doi.org/10.3390/nu8110690 (2016).
17. Hendrie, G. A., Ridoutt, B. G., Wiedmann, T. O. & Noakes, M. Greenhouse gas emissions and the Australian diet–comparing dietary
recommendations with average intakes. Nutrients 6, 289–303, https://doi.org/10.3390/nu6010289 (2014).
18. Tilman, D. & Clark, M. Global diets link environmental sustainability and human health. Nature 515, 518–522, https://doi.
org/10.1038/nature13959 (2014).
19. Athanasopouloua, L., Bikasa, H. & Stavropoulosa, P. Comparative Well-to-Wheel Emissions Assessment of Internal Combustion
Engine and Battery Electric Vehicles. Procedia CIRP 65, 32–37, https://doi.org/10.1016/j.procir.2017.04.009 (2018).
20. Orsi, F., Muratori, M., Rocco, M., Colombo, E. & Rizzoni, G. A multi-dimensional well-to-wheels analysis of passenger vehicles in
different regions: Primary energy consumption, CO2 emissions, and economic cost. Applied Energy 169, 197–209, https://doi.
org/10.1016/j.apenergy.2016.02.039 (2016).
21. Leduc, G., Mongelli, I., Uihlein, A. & Nemry, F. How can our cars become less polluting? An assessment of the environmental
improvement potential of cars. Transport Policy 17, 409–419, https://doi.org/10.1016/j.tranpol.2010.04.008 (2010).
22. Aleksandrowicz, L., Green, R., Joy, E. J., Smith, P. & Haines, A. The Impacts of Dietary Change on Greenhouse Gas Emissions, Land
Use, Water Use, and Health: A Systematic Review. PLoS One 11, e0165797, https://doi.org/10.1371/journal.pone.0165797 (2016).
23. FAO. Food wastage footprint: full cost accounting. (Food and Agriculture Organisation of the United Nations, 2014).
24. Ministry for the Environment. Summary of emissions factors for the Guidance for Voluntary Greenhouse Gas Reporting - 2016 (2016).
25. Eckelman, M. J. & Sherman, J. Environmental Impacts of the U.S. Health Care System and Effects on Public Health. PLoS One 11,
e0157014, https://doi.org/10.1371/journal.pone.0157014 (2016).
26. Ainsworth, B. E. et al. Compendium of Physical Activities: an update of activity codes and MET intensities. Medicine and Science in
Sports and Exercise 32 (2000).
27. Epigear International. Ersatz (version 1.34), www.epigear.com (2017).
28. Hall, K. D. et al. Quantification of the effect of energy imbalance on bodyweight. The Lancet 378, 826–837 (2011).
29. Moody, A. In Health Survey for England 2013 (Health and Social Care Information Centre, 2013).
Acknowledgements
The authors thank Prof Nick Wilson for providing comments on an earlier draft of the manuscript. We also thank
Dr Michael Clark for data provided by personal communication.
Author contributions
A.M. and T.B. were responsible for conceptualization; A.M., L.C., C.C., A.W. and T.B. devised the methodology,
A.M. conducted the analysis and wrote the first draft of the manuscript; all authors made revisions to the
manuscript and have read and approved the final version.
Competing interests
A.M., C.C., L.C., and T.B. were funded by the Health Research Council of New Zealand (HRC16/443) for this
work. AW is funded by the New Zealand Ministry of Business Innovation and Employment (MRACO 2015-19).
This research did not receive any specific grant from funding agencies in the public, commercial, or not-for-
profit sectors. The funders had no role in the design of the study, collection, analysis, and interpretation of data,
nor in the writing of the manuscript. The authors declare that they have no other competing interests.
Additional information
Supplementary information is available for this paper at https://doi.org/10.1038/s41598-020-66170-y.
Correspondence and requests for materials should be addressed to A.M.
Reprints and permissions information is available at www.nature.com/reprints.
Publisher’s note Springer Nature remains neutral with regard to jurisdictional claims in published maps and
institutional affiliations.
Open Access This article is licensed under a Creative Commons Attribution 4.0 International
License, which permits use, sharing, adaptation, distribution and reproduction in any medium or
format, as long as you give appropriate credit to the original author(s) and the source, provide a link to the Cre-
ative Commons license, and indicate if changes were made. The images or other third party material in this
article are included in the article’s Creative Commons license, unless indicated otherwise in a credit line to the
material. If material is not included in the article’s Creative Commons license and your intended use is not per-
mitted by statutory regulation or exceeds the permitted use, you will need to obtain permission directly from the
copyright holder. To view a copy of this license, visit http://creativecommons.org/licenses/by/4.0/.
© The Author(s) 2020
Scientific Reports | (2020) 10:9196 | https://doi.org/10.1038/s41598-020-66170-y 6You can also read