Full Year 2018 Results February 7, 2019 - Fiat Chrysler Automobiles
←
→
Page content transcription
If your browser does not render page correctly, please read the page content below

• Full Year 2018 Results
• February 7, 2019

•    This document, and in particular the section entitled “2019 guidance”, contains forward-looking statements. In particular, these forward-looking
    statements include statements regarding future financial performance and the Company’s expectations as to the achievement of certain targeted
    metrics, including net cash/(debt) and net industrial cash/(debt), revenues, industrial free cash flows, vehicle shipments, capital investments,
    research and development costs and other expenses at any future date or for any future period are forward-looking statements. These statements
    may include terms such as “may”, “will”, “expect”, “could”, “should”, “intend”, “estimate”, “anticipate”, “believe”, “remain”, “on track”, “design”,
    “target”, “objective”, “goal”, “forecast”, “projection”, “outlook”, “prospects”, “plan”, or similar terms. Forward-looking statements are not
    guarantees of future performance. Rather, they are based on the Group’s current state of knowledge, future expectations and projections about
    future events and are by their nature, subject to inherent risks and uncertainties. They relate to events and depend on circumstances that may or
    may not occur or exist in the future and, as such, undue reliance should not be placed on them.
•   Actual results may differ materially from those expressed in forward-looking statements as a result of a variety of factors, including: the Group’s
    ability to launch new products successfully and to maintain vehicle shipment volumes; changes in the global financial markets, general economic
    environment and changes in demand for automotive products, which is subject to cyclicality; changes in local economic and political conditions,
    changes in trade policy and the imposition of global and regional tariffs or tariffs targeted to the automotive industry, the enactment of tax reforms
    or other changes in tax laws and regulations; the Group’s ability to expand certain of the Group’s brands globally; the Group’s ability to offer
    innovative, attractive products; the Group’s ability to develop, manufacture and sell vehicles with advanced features including enhanced
    electrification, connectivity and autonomous driving characteristics; various types of claims, lawsuits, governmental investigations and other
    contingencies affecting the Group, including product liability and warranty claims and environmental claims, investigations and lawsuits; material
    operating expenditures in relation to compliance with environmental, health and safety regulations; the intense level of competition in the
    automotive industry, which may increase due to consolidation; exposure to shortfalls in the funding of the Group’s defined benefit pension plans; the
    Group’s ability to provide or arrange for access to adequate financing for the Group’s dealers and retail customers and associated risks related to the
    establishment and operations of financial services companies, including capital required to be deployed to financial services; the Group’s ability to
    access funding to execute the Group’s business plan and improve the Group’s business, financial condition and results of operations; a significant
    malfunction, disruption or security breach compromising the Group’s information technology systems or the electronic control systems contained in
    the Group’s vehicles; the Group’s ability to realize anticipated benefits from joint venture arrangements; the Group’s ability to successfully
    implement and execute strategic initiatives and transactions, including the Group’s plans to separate certain businesses; disruptions arising from
    political, social and economic instability; risks associated with our relationships with employees, dealers and suppliers; increases in costs, disruptions
    of supply or shortages of raw materials; developments in labor and industrial relations and developments in applicable labor laws; exchange rate
    fluctuations, interest rate changes, credit risk and other market risks; political and civil unrest; earthquakes or other disasters and other risks and
    uncertainties.
•   Any forward-looking statements contained in this document speak only as of the date of this document and the Company disclaims any obligation to
    update or revise publicly forward-looking statements. Further information concerning the Group and its businesses, including factors that could
    materially affect the Company’s financial results, is included in the Company’s reports and filings with the U.S. Securities and Exchange Commission,
    the AFM and CONSOB. Safe Harbor Statement
• Highlights* Group results include Magneti Marelli for
  comparability with prior periods and previously
  provided guidance. In accordance with IFRS, Magneti
  Marelli is presented as a discontinued operation in the
  Group’s financial statements for current and prior
  periods. Guidance does not include the results of
  Magneti Marelli or impacts from the announced sale of
  Magneti Marelli.
• Both ordinary and extraordinary dividends subject to
  Board of Directors and shareholder approval A record
  year despite unexpected challenges
•    Leverage leadership changes
•   Optimizing sales channel mix
•   Focus on more profitable
    Jeep and Alfa Romeo brands
•   Right-size inventory Reduce G&A costs
•   Restructure hourly workforce, principally through attrition
•   Rationalize unprofitable markets
•   New industrial plan to increase capacity utilization
•   Explore opportunities with partners to share technologies/platforms Commercial
    Performance Cost
    Structure EMEA China Maserati Measures to improve operating results Launching more efficient powertrain
    combinations
•   Refocus marketing to recently launched products
•   Implementing product quality improvements Improvement in product cost competitiveness
•   Restructure JV to remove excess costs and improve efficiencies
•   Restructure regional office to simplify decision making and reduce cost structure Leverage leadership changes
•   Manage as a luxury brand
•   Right-size inventory
•   Bridge product gap with
    specialty models
•   Redirect marketing to focus
    on Levante Leverage investments in Giorgio architecture for
    future brand products
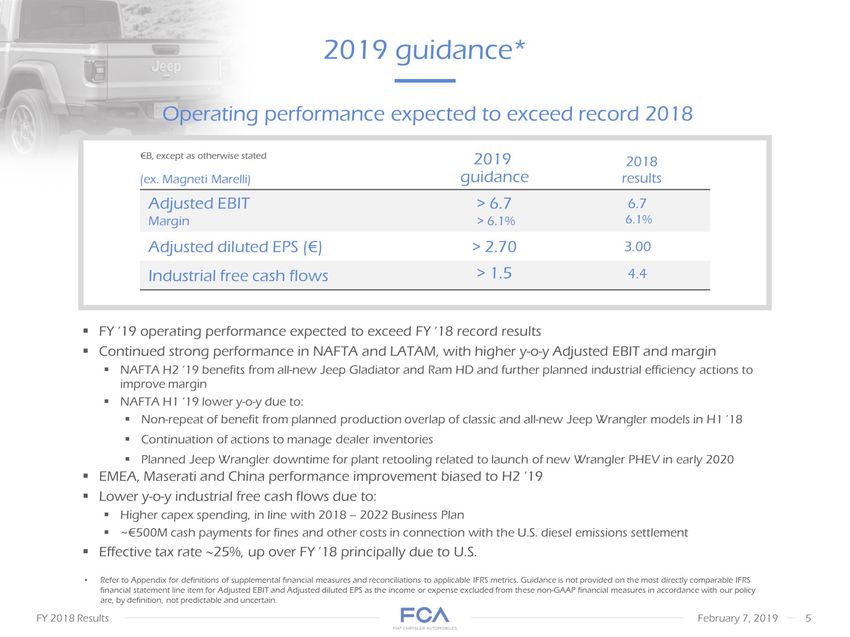
•    2019 guidance* Refer to Appendix for definitions of supplemental financial measures and
    reconciliations to applicable IFRS metrics. Guidance is not provided on the most directly
    comparable IFRS financial statement line item for Adjusted EBIT and Adjusted diluted EPS as the
    income or expense excluded from these non-GAAP financial measures in accordance with our
    policy are, by definition, not predictable and uncertain. Operating performance expected to exceed
    record 2018 FY ‘19 operating performance expected to exceed FY ‘18 record results
•   Continued strong performance in NAFTA and LATAM, with higher y-o-y Adjusted EBIT and margin
•   NAFTA H2 ‘19 benefits from all-new Jeep Gladiator and Ram HD and further planned industrial
    efficiency actions to improve margin
•   NAFTA H1 ‘19 lower y-o-y due to:
•   Non-repeat of benefit from planned production overlap of classic and all-new Jeep Wrangler
    models in H1 ’18
•   Continuation of actions to manage dealer inventories
•   Planned Jeep Wrangler downtime for plant retooling related to launch of new Wrangler PHEV in
    early 2020
•   EMEA, Maserati and China performance improvement biased to H2 ‘19
•   Lower y-o-y industrial free cash flows due to:
•   Higher capex spending, in line with 2018 – 2022 Business Plan
•   ~€500M cash payments for fines and other costs in connection with the U.S. diesel emissions
    settlement
•   Effective tax rate 25%, up over FY ’18 principally due to U.S. €B, except as otherwise stated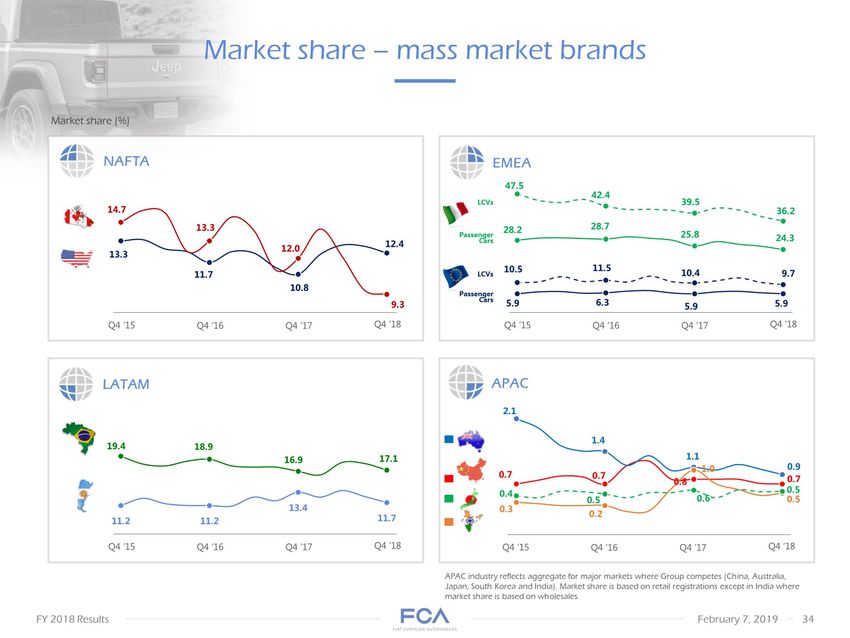
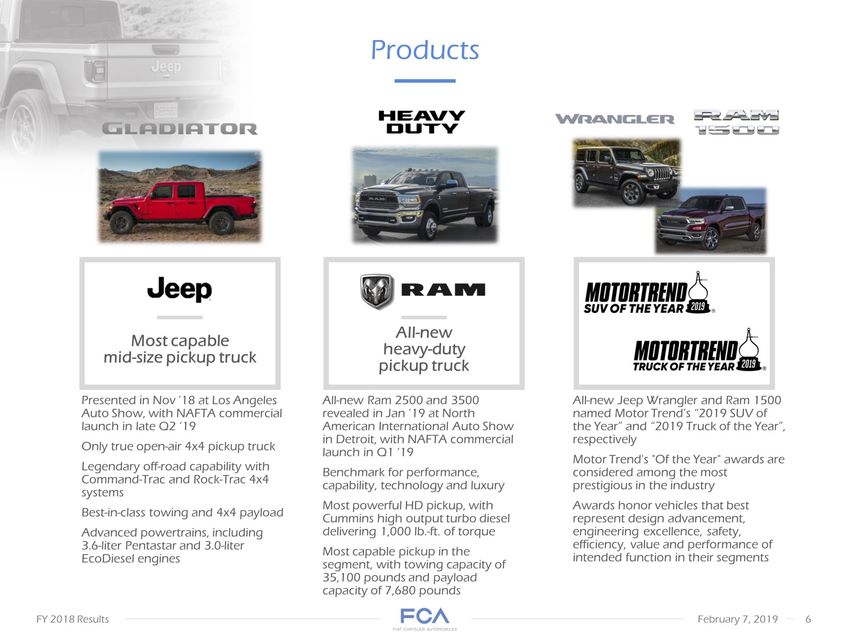
•     Products Most capable
    mid-size pickup truck All-new
    heavy-duty
    pickup truck Presented in Nov ’18 at Los Angeles Auto Show, with NAFTA commercial launch in late
    Q2 ‘19
•   Only true open-air 4x4 pickup truck
•   Legendary off-road capability with Command-Trac and Rock-Trac 4x4 systems
•   Best-in-class towing and 4x4 payload
•   Advanced powertrains, including 3.6-liter Pentastar and 3.0-liter EcoDiesel engines All-new Ram
    2500 and 3500 revealed in Jan ’19 at North American International Auto Show
    in Detroit, with NAFTA commercial launch in Q1 ‘19
•   Benchmark for performance, capability, technology and luxury
•   Most powerful HD pickup, with Cummins high output turbo diesel delivering 1,000 lb.-ft. of torque
•   Most capable pickup in the segment, with towing capacity of 35,100 pounds and payload capacity
    of 7,680 pounds All-new Jeep Wrangler and Ram 1500 named Motor Trend’s “2019 SUV of the
    Year” and “2019 Truck of the Year”, respectively
•   Motor Trend's "Of the Year" awards are considered among the most prestigious in the industry
•   Awards honor vehicles that best represent design advancement, engineering excellence, safety,
    efficiency, value and performance of intended function in their segments

•
•    FY ‘18 summary* Shipments (k units) Net revenues (€B) Adjusted EBIT (1) (€M) Consolidated shipments up
    5%, primarily due to growth in NAFTA and LATAM
•   Lower JV shipments Up 4%; up 9% at constant exchange rates (CER)
•   Higher shipments, positive pricing and favorable mix Record performance, up 3%, up 9% at CER
•   Margin down slightly JVs 4,842 4,740 Combined FY ‘18 FY ‘17 6.3%
    margin 6.4%
    margin Consolidated Net industrial
    cash/(debt) (1) (€M) Adjusted net profit (1) (€M) Available liquidity (€B) Record results, up 34%; up 41% at CER
•   Net profit up 3% to €3.6B, due
    to strong performance, reduced financial charges and taxes Industrial free cash flows more than doubled y-o-y to
    €4.3B, with lower capex due to program timing
•   Includes €0.5B accelerated discretionary U.S. pension plan contribution, net of tax benefit Available liquidity
    remained strong at €21.1B, up €0.7B from Dec ‘17
•   Gross debt reduced €3.3B y-o-y
•    (2,390) 1,872 Dec 31 ‘18 Dec 31 ‘17 Cash &
    marketable securities Undrawn committed
    credit lines 20.4 21.1 *             Group results include Magneti Marelli for comparability with prior periods and
    previously provided guidance. In accordance with IFRS, Magneti Marelli is presented as a
    discontinued operation in the Group’s financial statements for current and prior periods.
•   Refer to Appendix for definitions of supplemental financial measures and reconciliations to applicable IFRS metrics
•        Figures may not add due to rounding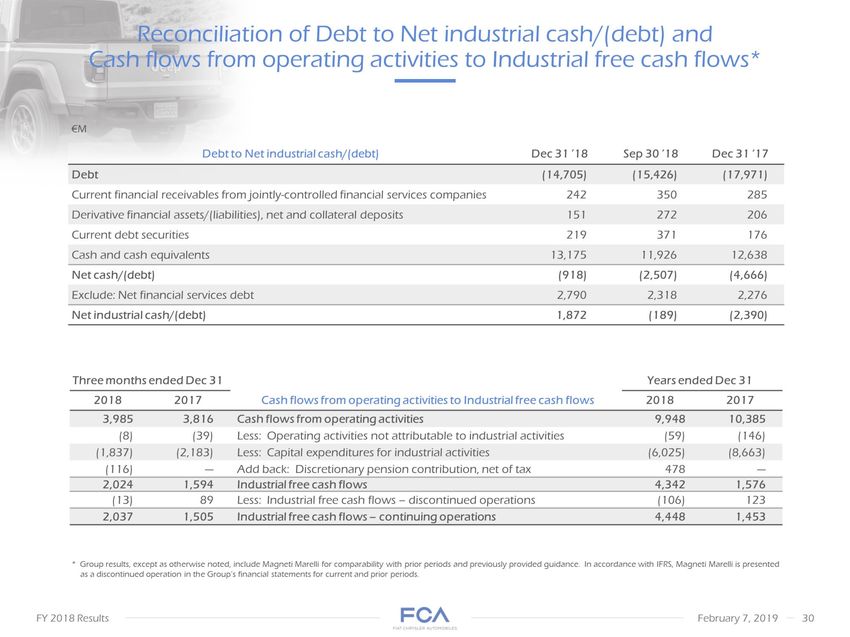
•    €M
    % = Adjusted EBIT margin FY ‘18 Adjusted EBIT walk* * Group results include Magneti Marelli
    for comparability with prior periods and previously provided guidance. In accordance with IFRS,
    Magneti Marelli is presented as a discontinued operation in
    the Group’s financial statements for current and prior periods. The remaining Components
    activities are no longer considered a separate reportable segment and are included within "Other
    activities“.
•   Refer to Appendix for definitions of supplemental financial measures and reconciliations to
    applicable IFRS metrics. Figures may not add due to rounding.
•   Reflects €116M of cost savings due to discontinuance of depreciation and amortization of Magneti
    Marelli assets from Sep 30 ’18, in accordance with IFRS 5 By segment NAFTA LATAM APAC
    EMEA Maserati Other
    activities & Eliminations FY ‘18 FY ’18
•   Continuing operations Plus: Discontinued operations By operational driver 7,054 FY ‘17 6.4%
    6.3% Less:
    Discontinued operations FY ’17
•   Continuing operations 6.1% Volume
    & Mix Net price Industrial
    costs SG&A Other FY ’17
•   Continuing operations (1)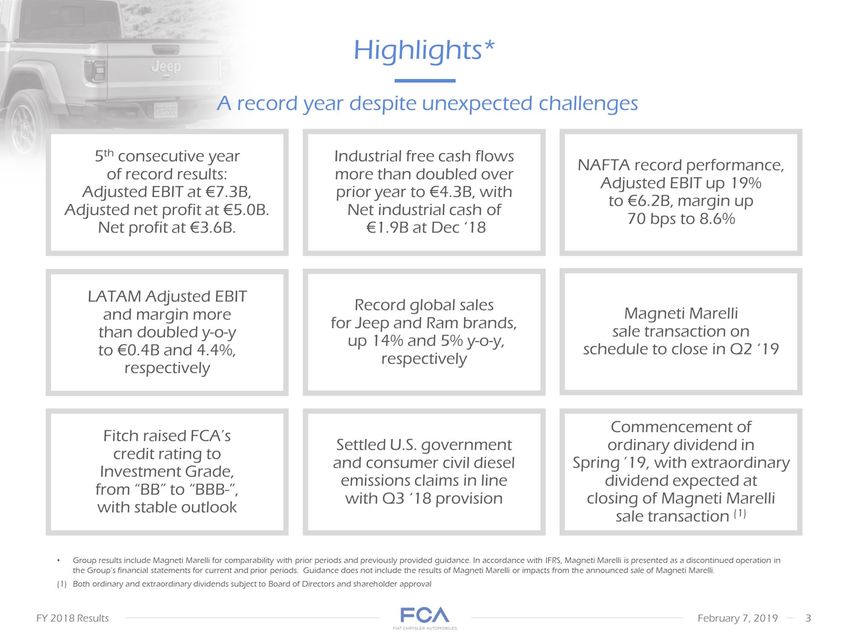
•     Dec 31 ‘17 Adjusted industrial
•   EBITDA Financial charges
•   & Taxes (1) Change in
    provisions
    & other Capex FX &
    Other Dec 31 ’18
     €M Change in Net industrial cash +4,262 Industrial free cash flows +4,342 FY ‘18 Net industrial
    cash walk* (2,390) Working
    capital Accelerated discretionary pension contribution, net of tax Dec 31 ’18
    ex. accelerated discretionary pension contribution, net of tax * Group results include Magneti
    Marelli for comparability with prior periods and previously provided guidance. In accordance with
    IFRS, Magneti Marelli is presented as a discontinued operation in the Group’s financial statements
    for current and prior periods.

•          Refer to Appendix for definitions of supplemental financial measures and reconciliations to
    applicable IFRS metrics. Figures may not add due to rounding.

•   Net of IAS 19
•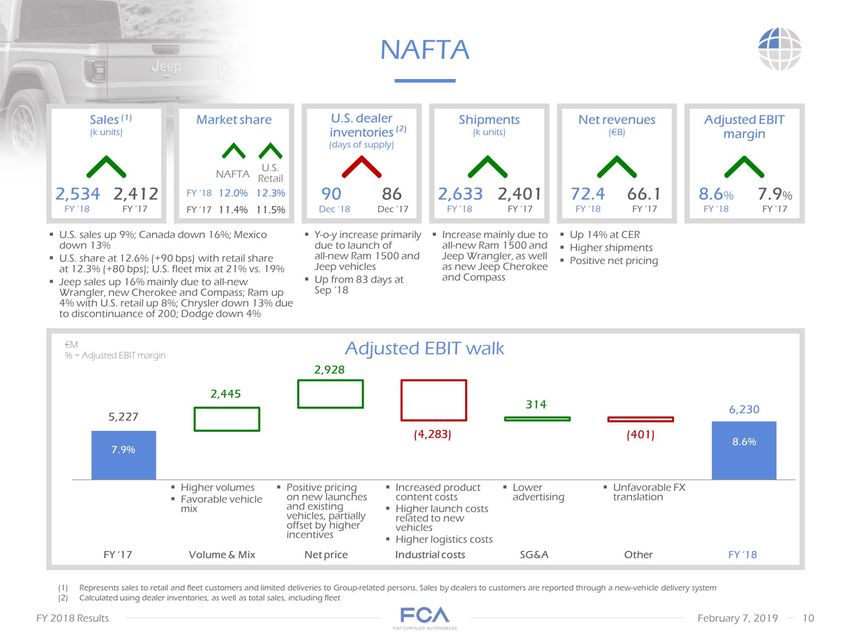
•    U.S. sales up 9%; Canada down 16%; Mexico
    down 13%
•   U.S. share at 12.6% (+90 bps) with retail share
    at 12.3% (+80 bps); U.S. fleet mix at 21% vs. 19%
•   Jeep sales up 16% mainly due to all-new
    Wrangler, new Cherokee and Compass; Ram up 4% with U.S. retail up 8%; Chrysler down 13% due to discontinuance of 200; Dodge down 4% Y-o-y
    increase primarily due to launch of
    all-new Ram 1500 and Jeep vehicles
•   Up from 83 days at Sep ‘18 Increase mainly due to
    all-new Ram 1500 and Jeep Wrangler, as well as new Jeep Cherokee and Compass Up 14% at CER
•   Higher shipments
•   Positive net pricing
•    NAFTA FY ‘17 Volume & Mix Net price Industrial costs SG&A Other FY ‘18 Adjusted EBIT walk €M
•   % = Adjusted EBIT margin Higher volumes
•   Favorable vehicle mix Positive pricing on new launches and existing vehicles, partially offset by higher incentives Increased product content costs
•   Higher launch costs related to new vehicles
•   Higher logistics costs 5,227 7.9% 8.6% U.S. dealer
       inventories (2)
•   (days of supply) Sales (1)
    (k units) Market share Shipments
    (k units) Net revenues
    (€B) 2,412 86 2,401 66.1 2,534 90 2,633 72.4 Adjusted EBIT margin Dec ‘17 Dec ‘18 U.S. Retail 11.5% 11.4% 12.0% 12.3% Lower advertising
    Represents sales to retail and fleet customers and limited deliveries to Group-related persons. Sales by dealers to customers are reported through a
    new-vehicle delivery system
•   Calculated using dealer inventories, as well as total sales, including fleet Unfavorable FX translation
• Brazil industry up 14% y-o-y; Argentina industry down 10% y-o-y
• Market share in Brazil at 17.5%, flat y-o-y; sales at 434k units, up 14%
• Argentina market share up 60 bps to 12.8%; sales at 99k units, down 6%
• Jeep remained leader in Brazil SUV segments
with combined share of 21.2%, down 70 bps y-o-y; Compass continues to be top selling SUV Down slightly from
Sep ‘18 Higher volumes primarily driven by
all-new Fiat Argo and Cronos, as well as Jeep Renegade and Compass, partially offset by discontinued vehicles
• H2 ‘18 market weakness in Argentina Up 21% at CER
• Volumes up 12%
• Favorable vehicle mix
• Positive net pricing LATAM Adjusted EBIT walk €M
• % = Adjusted EBIT margin Calculated using dealer and Group inventories, as well as total sales Net revenues
(€B) FY ‘17 8.0 FY ‘18 8.2 33 34 Inventories (1)
• (days of supply) 513 566 Sales
(k units) 521 585 Shipments
(k units) 12.4% 12.8% Market share Adjusted EBIT margin 1.9% 4.4% Dec ’17 Dec ’18 Volume & Mix Net price
Industrial costs SG&A Other Higher volumes
• Positive
vehicle mix 151 Unfavorable FX
• Higher D&A and R&D for new vehicles Primarily higher advertising for new vehicle launches Unfavorable
FX translation Positive net pricing in Brazil
• Weakening of Argentine peso• China industry down 7% y-o-y, with total SUV segments down 8% y-o-y
• Challenges in China market, with share down 10 bps to 0.8% largely due to lower China JV sales Down from 112
days at Sep ’18 Lower China JV volumes, impacted by H2 ‘18 China market weakness and increased competition,
particularly in the SUV segments
• Down 13% at CER
• Unfavorable market and vehicle mix
• Unfavorable net pricing APAC Reflects aggregate for major markets where Group competes (China, Australia,
Japan, South Korea and India). Market share is based on retail registrations, except in India where market share is
based on wholesale volumes, as well as management’s estimates of industry sales data, which use certain data
provided by third party sources.
• Calculated using dealer and Group inventories, as well as total combined sales Adjusted EBIT walk €M
• % = Adjusted EBIT margin Net revenues
(€M) 3.3 FY ‘17 2.7 FY ‘18 Inventories (2)
• (days of supply) 86 80 Market share (1) 0.8% 0.7% Shipments
(k units) Combined JV 290 205 209 125 Adjusted EBIT margin 5.3% (11.0)% Dec ’17 Dec ’18 Volume & Mix
172 Unfavorable vehicle mix Higher incentives
• Pricing actions for changes in China import duties Net price Industrial costs SG&A Other Lower China JV results
• Non-repeat of prior year Tianjin insurance recoveries Sales
(k units) 277 192 228 142 FY ‘17 margin at 2.4% excluding Tianjin (China) insurance recoveries
• Primarily lower advertising• Adjusted EBIT walk Down from 98 days at Sep ’18 Lower shipments biased to H2 ‘18
• Higher Jeep brand shipments, more than offset by lower Fiat brand volumes Positive vehicle mix
• Lower shipments
• Unfavorable net pricing Lower volumes
• Unfavorable trim and channel mix Purchasing and manufacturing efficiencies
• Favorable FX
• Higher R&D
• EMEA 735 €M
• % = Adjusted EBIT margin 3.2% 1.8% Higher incentives in major markets
• Pricing actions related to WLTP transition
• Unfavorable FX
• Calculated using dealer and Group inventories, as well as total sales Inventories (1)
• (days of supply) 71 88 Shipments
(k units) 1,365 FY ‘17 1,318 FY ‘18 Net revenues
(€B) 22.7 22.8 Sales
(k units) 1,486 1,428 EU 28 + EFTA market share 6.6% 11.4% PCs LCVs 6.5% 11.1% Adjusted EBIT margin Dec
’17 Dec ’18 Volume & Mix Net price Industrial costs SG&A Other EU 28 + EFTA (EU) passenger car (PC) industry
flat y-o-y; with Italy down 3%; share down 10 bps
• EU LCV industry up 4%, with Italy down 3%; share down 30 bps, primarily due to Italy (-140 bps)
• PC sales in the region down 3%; higher Jeep (+49%), offset by lower Fiat (-10%)
• LCV sales down 6% mainly due to market weakness in Turkey Higher advertising for Jeep brand
• Continued cost containment
• H2 ‘18 performance substantially at breakeven• Maserati Commercial performance
• Global sales down 28% y-o-y, with decreases in all major markets (China -43%,
Europe -25%, North America -19%), partially due to lower industry volumes
• Lower shipments primarily related to market challenges in China, as well as
inventory management actions and lower volumes in North America and Europe
• Continued inventory challenges due to disappointing sales performance; need to
right-size during H1 ‘19
• Financial performance
• Lower Net revenues mainly due to lower volumes and unfavorable market mix
• Adjusted EBIT decrease primarily due to lower volumes, increased D&A and
unfavorable FX, partially offset by lower marketing expenses Sales
(k units) Net revenues
(€M) Shipments
(k units) Adjusted EBIT (1)
• (€M) Adjusted EBIT margin• Industry outlook M units LATAM
• (passenger cars and LCVs) APAC (1)
• (passenger cars only) EMEA
• (passenger cars and LCVs) NAFTA
• (total vehicle sales including medium/heavy trucks) APAC industry reflects aggregate for major markets where
Group competes (China, Australia, Japan, South Korea and India)
• As provided at Jun 1 ‘18 Capital Markets Day FY ’19E FY ’18 FY ’18E FY ’19 forecast revised down
slightly from prior guidance (2)
due to recent market weakness
in Argentina
• Continued growth expected in Brazil, with FY ’19 industry forecasted at 2.6M units, up
from 2.5M units in FY ’18
• FY ’19 Argentina industry expected to continue its decline, down 0.2M units y-o-y to 0.6M units FY ’19 forecast
revised down from prior guidance (2) due to recent decline in China market
• FY ’19 China industry forecasted to remain flat y-o-y at 21.7M units FY ’19 forecast revised down from prior
guidance (2) due to industry slowdown in
H2 ‘18 and worsening macroeconomics in Turkey, U.K. and Italy
• FY ’19 EU industry expected to decrease slightly to 17.8M units, from 18.0M units in
FY ’18 FY ’19 forecast substantially in line with prior guidance (2)
• FY ’19 U.S. industry forecasted to decrease slightly to 17.2M units, from 17.7 M units in FY ’18
• FY ’19 Canada and Mexico industries expected to remain stable at 2.0M and 1.4M units, respectively Source: IHS
Global Insight, Wards and Group estimates• Appendix
•    Supplemental financial measures FCA monitors its operations through the use of various supplemental financial measures that may not be
    comparable to other similarly titled measures of other companies. Accordingly, investors and analysts should exercise appropriate caution in
    comparing these supplemental financial measures to similarly titled financial measures reported by other companies. Group management believes
    these supplemental financial measures provide comparable measures of its financial performance which then facilitate management’s ability to
    identify operational trends, as well as make decisions regarding future spending, resource allocations and other operational decisions.
•   FCA’s supplemental financial measures are defined as follows:
•   Earnings before interest, taxes, depreciation and amortization (“EBITDA”) is computed starting with Net profit and adding back Net financial
    expenses, Tax expense/(benefit) and depreciation and amortization expense
•   Adjusted earnings before interest and taxes (“Adjusted EBIT”) – continuing operations excludes certain adjustments from Net profit from continuing
    operations including: gains/(losses) on the disposal of investments, restructuring, impairments, asset write-offs and unusual income/(expenses) that
    are considered rare or discrete events that are infrequent in nature, and also excludes Net financial expenses and Tax expense/(benefit). Adjusted
    EBIT includes both Adjusted EBIT – continuing operations and Adjusted EBIT – discontinued operations.
•   Adjusted net profit – continuing operations is calculated as Net profit from continuing operations excluding post-tax impacts of the same items
    excluded from Adjusted EBIT – continuing operations, as well as financial income/(expenses) and tax income/(expenses) considered rare or discrete
    events that are infrequent in nature. Adjusted net profit includes both Adjusted net profit – continuing operations and Adjusted net profit –
    discontinued operations.
•   Adjusted diluted EPS – continuing operations is calculated by adjusting Diluted EPS for the same items excluded from Adjusted net profit – continuing
    operations. Adjusted diluted EPS includes both Adjusted diluted EPS – continuing operations and Adjusted diluted EPS – discontinued operations.
    Industrial free cash flows is calculated as Cash flows from operating activities less: cash flows from operating activities related to financial services,
    net of eliminations; Investment in property, plant and equipment and intangible assets for industrial activities; and adjusted for discretionary pension
    contributions in excess of those required by the pension plans, net of tax. The timing of Industrial free cash flows may be affected by the timing of
    monetization of receivables and the payment of accounts payable, as well as changes in other components of working capital, which can vary from
    period to period due to, among other things, cash management initiatives and other factors, some of which may be outside of the Group’s control.
    Industrial free cash flows includes both Industrial free cash flows – continuing operations and Industrial free cash flows – discontinued operations.
•   Net industrial cash/(debt) is computed as: Debt plus derivative financial liabilities related to industrial activities less (i) cash and cash equivalents, (ii)
    certain current debt securities, (iii) current financial receivables from Group or jointly controlled financial services entities and (iv) derivative financial
    assets and collateral deposits; therefore, debt, cash and cash equivalents and other financial assets/liabilities pertaining to financial services entities
    are excluded from the computation of Net industrial cash/(debt).
•   Net industrial cash/(debt) should not be considered as a substitute for cash flows or other financial measures under IFRS; in addition, Net industrial
    cash/(debt) depends on the amount of cash and cash equivalents at each balance sheet date, which may be affected by the timing of monetization of
    receivables and the payment of accounts payable, as well as changes in other components of working capital, which can vary from period to period
    due to, among other things, cash management initiatives and other factors, some of which may be outside of the Group’s control. Net industrial
    cash/(debt) should therefore be evaluated alongside these other measures as reported under IFRS for a more complete view of the Company’s
    capital structure and liquidity.
• Net revenues (€B) Adjusted EBIT (1) (€M) 6.6%
margin Q4 ’18 summary* Shipments (k units) Q4 ‘18 Q4
‘17 1,247 1,177 JVs Combined Consolidated * Group
results include Magneti Marelli for comparability with prior
periods and previously provided guidance. In accordance
with IFRS, Magneti Marelli is presented as a discontinued
operation in the Group’s financial statements for current
and prior periods.
• Refer to Appendix for definitions of supplemental financial
measures and reconciliations to applicable IFRS metrics
• Figures may not add due to rounding Adjusted net
profit (1) (€M)• €M
% = Adjusted EBIT margin By segment Q4 ’18 Adjusted EBIT walk* By operational
driver Q4 ‘17 NAFTA LATAM APAC EMEA Maserati Other
activities & Eliminations Q4 ‘18 6.6% Less:
Discontinued operations Q4 ’17 Continuing operations Q4 ’18 Continuing
operations Plus: Discontinued operations 6.4% 6.2% 1,894 Volume
& Mix Net price Industrial
costs SG&A Other * Group results include Magneti Marelli for comparability
with prior periods and previously provided guidance. In accordance with IFRS,
Magneti Marelli is presented as a discontinued operation in
the Group’s financial statements for current and prior periods. The remaining
Components activities are no longer considered a separate reportable segment
and are included within "Other activities“.
• Refer to Appendix for definitions of supplemental financial measures and
reconciliations to applicable IFRS metrics. Figures may not add due to rounding.
• Reflects €116M of cost savings due to discontinuance of depreciation and
amortization of Magneti Marelli assets from Sep 30 ’18, in accordance with IFRS 5
(1)• €M Q4 ’18 Net industrial cash walk* (189) Sep 30 ‘18 Adjusted industrial
• EBITDA Financial charges
• & Taxes (1) Change in
provisions
& other Capex FX &
• Other Dec 31 ‘18 Working
capital Tax benefit
from Q3 ’18 accelerated discretionary pension contribution Dec 31 ’18
ex. accelerated discretionary pension contribution, net of tax Industrial free cash
flows +2,024 * Group results include Magneti Marelli for comparability with
prior periods and previously provided guidance. In accordance with IFRS, Magneti
Marelli is presented as a discontinued operation in the Group’s financial
statements for current and prior periods.
• Refer to Appendix for definitions of supplemental financial measures and
reconciliations to applicable IFRS metrics. Figures may not add due to rounding.
• Net of IAS 19• Represents sales to retail and fleet customers and limited deliveries to Group-related persons. Sales by dealers to customers are reported through a new- vehicle delivery system. Q4 ’18 – NAFTA Sales (1) (k units) 556 Q4 ‘17 613 Q4 ‘18 Market share Shipments (k units) 624 638 Net revenues (€B) 16.8 19.4 Volume & Mix Net price Industrial costs SG&A Other Adjusted EBIT walk €M • % = Adjusted EBIT margin 1,349 8.0% 8.7% Adjusted EBIT margin 10.4% 11.1% NAFTA U.S. Retail 11.5% 11.6%
• Q4 ’18 – LATAM Net revenues
  (€B) Q4 ‘17 2.2 Q4 ‘18 12.4% 12.6% Market
  share 135 140 Sales
  (k units) Volume & Mix Net price Industrial
  costs SG&A Other Adjusted EBIT walk 52
  €M
• % = Adjusted EBIT margin 4.6% 2.4% 148
  152 Shipments
  (k units) Adjusted EBIT margin
• Q4 ’18 – APAC Reflects aggregate for major markets
  where Group competes (China, Australia, Japan, South
  Korea and India). Market share is based on retail
  registrations, except in India where market share is based
  on wholesale volumes, as well as management’s estimates
  of industry sales data, which use certain data provided by
  third party sources. Market share (1) 0.8% Q4 ‘17 0.7%
  Q4 ‘18 Net revenues
  (€B) Sales
  (k units) Combined JV 78 53 57 31 Shipments
  (k units) 54 28 Volume & Mix Net price Industrial costs
  SG&A Other Adjusted EBIT walk (2) €M
• % = Adjusted EBIT margin (13.2)% (0.2)% Adjusted EBIT
  margin
• Q4 ‘17 Volume & Mix Net price Industrial
  costs SG&A Other Q4 ‘18 Adjusted EBIT walk
  Q4 ’18 – EMEA €M
• % = Adjusted EBIT margin Sales
  (k units) 330 294 Shipments
  (k units) 345 304 Net revenues
  (€B) 6.1 5.9 3.8% 1.0% EU 28 + EFTA market
  share 5.9% 10.4% PCs LCVs 9.7% 230
  Adjusted EBIT margin
• Q4 ’18 – Maserati Sales
  (k units) Net revenues
  (€M) Shipments
  (k units) Adjusted EBIT
  (€M) Adjusted EBIT margin
• Key performance metrics* €M, except as otherwise stated
  *      As a result of the announced sale of Magneti Marelli
  and, in accordance with IFRS, Magneti Marelli is presented
  as a discontinued operation in the Group’s financial
  statements for current and prior periods. Magneti Marelli’s
  results will be presented net of tax in a separate line item
  after Net profit from continuing operations.
• Combined shipments include all shipments by the Group's
  unconsolidated joint ventures, whereas consolidated
  shipments only include shipments from the Group's
  consolidated subsidiaries
• Refer to definitions of supplemental financial measures and
  reconciliations to applicable IFRS metrics, included herein
•  As a result of the announced sale of Magneti Marelli and,
  in accordance with IFRS, Magneti Marelli is presented as a
  discontinued operation in the Group’s financial statements
  for current and prior periods. Magneti Marelli’s results will
  be presented net of tax in a separate line item after Net
  profit from continuing operations.
• Reflects €96M of cost savings, net of tax of €20M, due to
  discontinuance of depreciation and amortization of
  Magneti Marelli assets from Sep 30 ’18, in accordance with
  IFRS 5
• Refer to Page 28 for explanation of Notes A – K above €M
  Reconciliation of Net profit to Adjusted EBIT*
•    Reconciliation of Net profit to Adjusted EBIT – notes Refer to Page 27 for a reconciliation of Net profit to Adjusted
    EBIT and related notes

•   FY ‘18 Adjusted EBIT excludes adjustments primarily related to:

•   Costs related to final settlements reached on civil, environmental and consumer claims related to U.S. diesel
    emissions matters
•   Impairment expense of €297M and supplier obligations of €56M, primarily in EMEA, resulting from changes in
    product plans in connection with the 2018 – 2022 Business Plan
•   Impairment of inventory in connection with acceleration of new emissions standards in China and slower than
    expected sales
•   Accrual in relation to costs for recall campaigns related to Takata airbag inflators, net of recovery
•   Special bonus payment of $2,000 to approximately 60,000 employees in NAFTA as a result of the U.S. Tax Cuts and
    Jobs Act
•   Restructuring costs primarily consisting of €123M in EMEA, partially offset by reversal of €28M of previously
    recorded restructuring costs in LATAM
•   Charges arising on settlement of a portion of a supplemental retirement plan and an annuity buyout in NAFTA
•   Costs in relation to the Port of Savona (Italy) flood and fire
•   Recovery of amounts accrued in 2016 in relation to costs for recall contested with a supplier
•   Reduction of costs in relation to the NAFTA capacity realignment which were accrued in 2015
•   Credits recognized related to indirect taxes in Brazil
• Reconciliation of Net profit to Adjusted net profit and Diluted EPS to Adjusted diluted EPS* €M * As a result of the announced sale of Magneti Marelli and, in accordance with IFRS, Magneti Marelli is presented as a discontinued operation in the Group’s financial statements for current and prior periods. Magneti Marelli’s results will be presented net of tax in a separate line item after Net profit from continuing operations. • Reflects €96M of cost savings, net of tax of €20M, due to discontinuance of depreciation and amortization of Magneti Marelli assets from Sep 30 ’18, in accordance with IFRS 5 • Reflects tax impact on adjustments excluded from Adjusted EBIT noted on Page 27 • Figures may not add due to rounding €, except as otherwise stated
• Reconciliation of Debt to Net industrial
  cash/(debt) and
  Cash flows from operating activities to Industrial
  free cash flows* * Group results, except as
  otherwise noted, include Magneti Marelli for
  comparability with prior periods and previously
  provided guidance. In accordance with IFRS,
  Magneti Marelli is presented as a discontinued
  operation in the Group’s financial statements for
  current and prior periods. €M
• Debt maturity schedule* €B * Group results
  include Magneti Marelli for comparability with prior
  periods and previously provided guidance. In
  accordance with IFRS, Magneti Marelli is presented as
  a discontinued operation in the Group’s financial
  statements for current and prior periods.
•
• Excludes accruals and asset backed financing of €0.5B
  at Dec 31 ’18

• Figures may not add due to rounding
•
• Pension and OPEB plans funded status €B Pension plans
  (1) OPEB plans (2) Balances include prepaid pension plans
  of €0.5B at both Dec 31 ‘18 and Dec 31 ’17
• Includes TFR (termination service indemnity) in Italian
  entities of €0.7B at Dec 31 ‘18 and €0.8B at Dec 31 ‘17 A
  ±100 bps change in the discount rate would impact pension
  and OPEB obligations by ~€2.9B (4.3) Dec 31 ‘17 Discount
  rate Contributions Earnings on plan assets FX
  translation Other FCA Group companies Dec 31 ‘18
  Interest,
  service costs
  & other Other
  actuarial gains Benefit payments (3.3) --
• Research and development costs and
  expenditures* €M *          As a result of the
  announced sale of Magneti Marelli and, in
  accordance with IFRS, Magneti Marelli is
  presented as a discontinued operation in the
  Group’s financial statements for current and
  prior periods. Magneti Marelli’s results will be
  presented net of tax in a separate line item
  after Net profit from continuing operations.
• Market share – mass market brands Market
  share (%) NAFTA Q4 ‘16 Q4 ’17 Q4 ‘18 Q4
  ‘15 APAC industry reflects aggregate for major
  markets where Group competes (China,
  Australia, Japan, South Korea and India).
  Market share is based on retail registrations
  except in India where market share is based
  on wholesales.
•
You can also read