FULL YEAR RESULT 2017 - 21 February 2018 - Coca-Cola Amatil

Page created by Amy Farmer
 
CONTINUE READING
FULL YEAR RESULT 2017 - 21 February 2018 - Coca-Cola Amatil
2017

                                              ccamatil.com
FULL YEAR
RESULT
21 February 2018

                             Alison Watkins
                      Group Managing Director
                             Martyn Roberts
                   Group Chief Financial Officer
                                 David Akers
                                Group Head of
                             Investor Relations
FULL YEAR RESULT 2017 - 21 February 2018 - Coca-Cola Amatil
DISCLAIMER

                                                                                                        ccamatil.com
Coca-Cola Amatil advises that these presentation slides and any related
materials and cross referenced information, contain forward looking statements
which may be subject to significant uncertainties outside of Coca-Cola Amatil’s
control.
No representation is made as to the accuracy or reliability of forward looking
statements or the assumptions on which they are based.
Actual future events may vary from these forward looking statements and you
are cautioned not to place reliance on any forward looking statement.

                                                               Coca-Cola Amatil 2017 Full Year Result      2
FULL YEAR RESULT 2017 - 21 February 2018 - Coca-Cola Amatil
AGENDA

                                                                                          ccamatil.com
Result Overview                 Alison Watkins

Shareholder Value Proposition   Alison Watkins

Additional Initiatives          Alison Watkins

Leadership Updates              Alison Watkins

Business Performance            Martyn Roberts

Financials                      Martyn Roberts

Strategy & Progress Updates     Alison Watkins

Sustainability & Outlook        Alison Watkins

Questions & Answers

                                                 Coca-Cola Amatil 2017 Full Year Result      3
FULL YEAR RESULT 2017 - 21 February 2018 - Coca-Cola Amatil
ccamatil.com
GROUP
PERFORMANCE
Alison Watkins Group Managing Director

                                         Coca-Cola Amatil 2017 Full Year Result      4
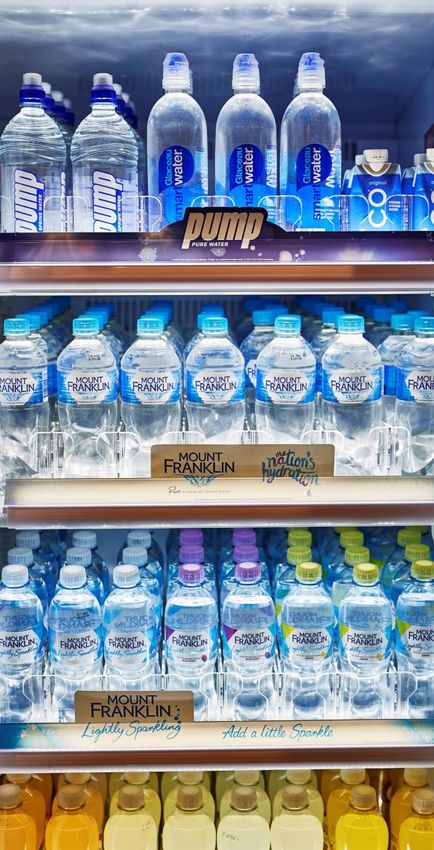
FULL YEAR RESULT 2017 - 21 February 2018 - Coca-Cola Amatil
2017 FULL YEAR

                                                                                                                                          ccamatil.com
RESULT OVERVIEW
Underlying1 earnings per share (EPS) increased by 2.2 per cent, with statutory EPS up 85.7 per cent

Underlying1 net profit after tax (NPAT) broadly in line with FY16, and in line with our guidance provided in April 2017

Statutory earnings before interest and tax (EBIT) of $678.4 million, up 45.5 per cent, and statutory NPAT of $445.2
million, up 80.9 per cent

Underlying1 EBIT of $678.7 million and underlying NPAT of $416.2 million representing declines of 0.7 per cent and
0.4 per cent respectively

Strong earnings performances in New Zealand & Fiji, Indonesia & Papua New Guinea and Alcohol & Coffee

Performance of Australian Beverages improved after Easter, following a challenging start to the year; improved
trajectory in second half

Non-trading items relating to one-off gain from sale of Richlands facility in Queensland offset one-off costs primarily
relating to cost optimisation projects in Australian Beverages

Final dividend of 26.0 cents per share (2H16: 25.0 cents per share), franked to 70 per cent, representing an
underlying1 payout ratio of 82.4 per cent for the full year

Completion of share buy-back program in November with 39.6 million shares bought back for total consideration of
$350 million at an average price of $8.84 per share

1.   Underlying refers to statutory results adjusted to exclude non-trading items.

                                                                                                 Coca-Cola Amatil 2017 Full Year Result      5
FULL YEAR RESULT 2017 - 21 February 2018 - Coca-Cola Amatil
SHAREHOLDER

                                                                                                                                        ccamatil.com
VALUE PROPOSITION
We are focused on generating attractive sustainable returns for shareholders

                                                                                             Targeting shareholder
    Investment case                EBIT drivers                          EPS drivers
                                                                                                 value creation

  Predominantly a Coca-     Revenue growth plans and
                              continuous cost focus                   Modest capex for
   Cola franchisee with         across the group                     developed markets           Mid single-digit
      leading brands                                                                              EPS growth
                                                                              +
  Route-to-market with                           Core developed
    scale and reach         Targeting low             market
                                                                       Growth capex for
                              single-digit          franchises
                                                                          Indonesia
                             EBIT growth          (Australia and
                                                                    funded via TCCC equity    Attractive dividends:
   Large-scale, modern,                           New Zealand)
                                                                           injection               above 80%
  low-cost infrastructure                                                                         payout ratio
                                             +                                +
                                                   Developing
  Steady cash flow from      Targeting               markets
                                                                     Continuous working
  core Australia and New    double-digit           (Indonesia,
                                                                     capital management
    Zealand franchises      EBIT growth            Papua New
                                                 Guinea and Fiji)                             Strong balance sheet
                                             +                                +
  Growth opportunities                                                                       Strong return on capital
   including Indonesia                                               Bolt-on acquisitions           employed
                             Targeting              Alcohol
  and Alcohol & Coffee      double-digit            & Coffee         Capital management
     providing upside       EBIT growth             and SPC               initiatives

                                                                                               Coca-Cola Amatil 2017 Full Year Result       6
FULL YEAR RESULT 2017 - 21 February 2018 - Coca-Cola Amatil
PROGRESS AGAINST OUR

                                                                                                                                                          ccamatil.com
SHAREHOLDER VALUE PROPOSITION
Solid progress against many of the elements of our shareholder value proposition,
however, Australian Beverages has been challenging

                                                                                                       Targeting shareholder
                      EBIT drivers                                     EPS drivers
                                                                                                           value creation

                                                                                  FY15 FY16 FY17
                                                            Modest capex
       Revenue growth plans and continuous                                                                                  FY15 FY16 FY17
                                                            for developed                          Mid single-
           cost focus across the group
                                                            markets                                digit
                                                                                                   EPS growth
                                                                              +
                                         FY15 FY16   FY17
 Targeting low                                              Growth capex for      FY15 FY16 FY17
   single-digit       Australia                             Indonesia funded
  EBIT growth                                               via TCCC equity
                      New Zealand                           injection
                                                                                                   Attractive               FY15 FY16 FY17
                  +                                                           +                    dividends: above
                                         FY15 FY16   FY17                                          80% payout
                                                                                  FY15 FY16 FY17   ratio
                                                            Continuous
  Targeting           Indonesia                             working capital
 double-digit         Papua New                             management
 EBIT growth          Guinea
                                                                              +
                      Fiji
                                                                                                                            FY15 FY16 FY17
                  +                                                               FY15 FY16 FY17
                                                            Bolt-on                                Strong balance
                                         FY15 FY16   FY17
  Targeting                                                 acquisitions                           sheet
 double-digit         Alcohol & Coffee                      Capital                                Strong ROCE
 EBIT growth                                                management
                      SPC
                                                            initiatives

                                                                                                                 Coca-Cola Amatil 2017 Full Year Result         7
FULL YEAR RESULT 2017 - 21 February 2018 - Coca-Cola Amatil
ADDITIONAL INITIATIVES

                                                                                                       ccamatil.com
SHARE BUYBACK PROGRAM
 $350 million share buy-back program completed on 9
  November 2017

 Acquired 39.6 million shares at an average price of $8.84
  per share

 Resulting in 723,999,699 shares on issue

RICHLANDS FACILITY SALE AND LEASEBACK
 Sale of Richlands facility in Queensland announced in
  June 2017; settled in early December 2017

 Proceeds of $156 million resulting in a one-off gain of
  $101 million before and after tax in 2H17 (due to the
  utilisation of capital losses)

                                                              Coca-Cola Amatil 2017 Full Year Result       8
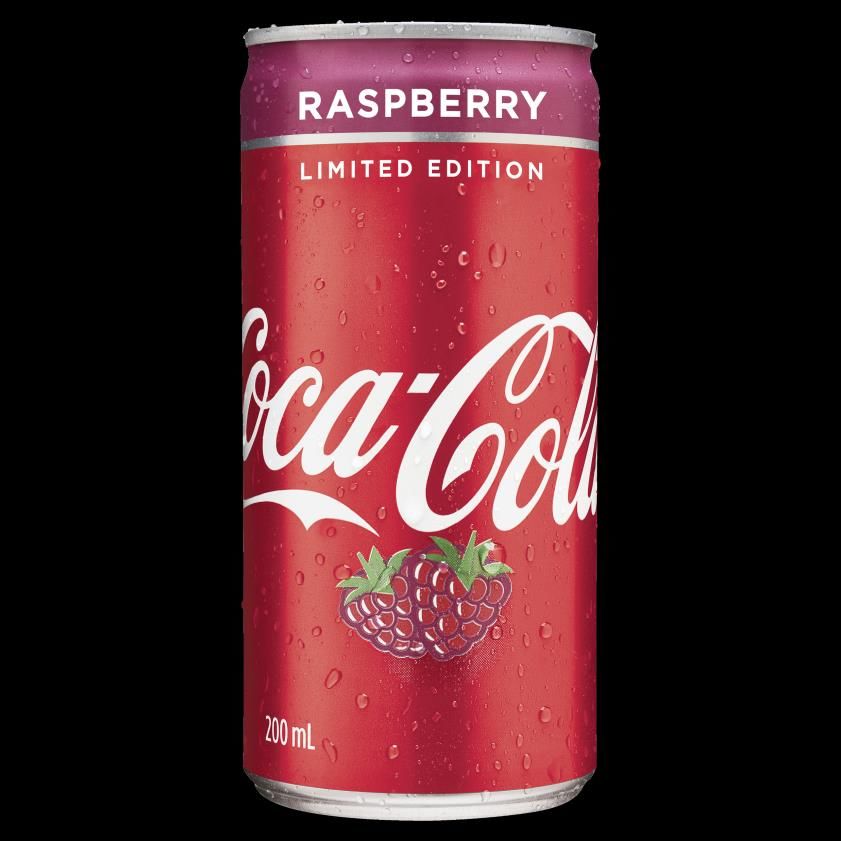
FULL YEAR RESULT 2017 - 21 February 2018 - Coca-Cola Amatil
LEADERSHIP UPDATES

                                                                                                                            ccamatil.com
 MANAGEMENT
Australian Beverages
  Martyn Roberts appointed Interim Australian Beverages Managing Director until Peter
   West commences on 30 April 2018
  Steve Paddis (previously NZ CFO) announced as Australian Beverages CFO in
   November 2017; commencing in February 2018
Partners & Growth
  Chris Sullivan commenced as Group Director Partners & Growth in July 2017
Information Technology
  Debbie Nova commenced as Group CIO in January 2018
  Sam Mitchell commenced as Chief Digital Officer in January 2018
Group Finance
  Paul Cooke appointed Interim Group Chief Financial Officer until 30 April 2018
Human Resources and Public Affairs, Communications & Sustainability (PAC&S)
  Kate Mason, currently Australian Beverages’ Chief Transformation Officer, to
   commence as Group Director People & Culture in March 2018
  Liz McNamara to join the Group Leadership Team, as Group Director PAC&S in March
   2018

 REMUNERATION
  Revenue growth targets included in Short Term Incentive Plan from 2018
  Earnings per share metric for Long Term Incentive Plan adjusted to reflect near-term
   outlook including 2018 reinvestment in Australian Beverages and container deposit
   schemes

 BOARD
  Appointment of Julie Coates as a Non-Executive Director

                                                                                          Coca-Cola 2017 Full Year Result       9
FULL YEAR RESULT 2017 - 21 February 2018 - Coca-Cola Amatil
ccamatil.com
BUSINESS
PERFORMANCE
Martyn Roberts Group Chief Financial Officer

                                               Coca-Cola Amatil 2017 Full Year Result   10
SEGMENT RESULTS OVERVIEW

                                                                                                                 ccamatil.com
                                                                                   % of
  Underlying EBIT $ million                   FY171    FY16   Change %
                                                                                Group EBIT

  Australian Beverages1                      412.6    440.9      (6.4)                61%

  New Zealand & Fiji1                        104.8     99.7       5.1                 15%

  Indonesia & Papua New Guinea                90.9     69.6      30.6                  13%

  Alcohol & Coffee                            49.7     44.7      11.2                   7%

  Corporate, Food & Services1                 20.7     28.5     (27.4)                  3%

  Total                                      678.7    683.4      (0.7)

1. Segment adjusted for Property Division.

                                                                        Coca-Cola Amatil 2017 Full Year Result    11
ccamatil.com
                     AUSTRALIAN BEVERAGES
Revenue, volume and EBIT trajectory improved in the                                         COMMENTARY
second half, following a challenging start to the year
                                                                                           Revenue, volume and EBIT trajectory
                                                                                            improved in the second half as many of our
                                                         FY          1H          2H
 $ million                           FY17      FY16    Change      Change      Change
                                                                                            initiatives gained traction
                                                         %           %           %
                                                                                           This was not sufficient to offset the challenges
                                                                                            we experienced at the start of the year where
 Trading revenue                   2,535.2   2,621.2      (3.3)       (5.3)      (1.4)
                                                                                            performance was adversely impacted by
                                                                                            competitive pressure in the cola and water
     Revenue per unit case ($)       $8.15    $8.22       (0.9)       (1.3)      (0.2)      categories and channel mix away from state
                                                                                            operational accounts, combined with higher
                                                                                            cost of goods sold
     Volume (million unit cases)     311.1    319.0       (2.5)       (3.9)      (1.2)
                                                                                           Trading revenue per unit case was 0.9% lower
                                                                                            comprising 0.8% increase from container
 Underlying EBIT                    412.6     440.9       (6.4)      (13.2)      (0.2)
                                                                                            deposit scheme pricing, 1.3% reduction in
                                                                                            realised price and 0.4% reduction from
 EBIT margin                         16.3%   16.8%     (0.5) pts   (1.4) pts    0.3 pts
                                                                                            product / channel mix
                                                                                           Savings from cost optimisation program
 Return on capital employed          36.1%   38.7%     (2.6) pts
                                                                                            reinvested in rebalancing of the portfolio
                                                                                            through innovation, refocussing our sales
                                                                                            effort and price investment
                                                                                           Continued strong return on capital employed
                                                                                           Accelerated Australian Growth Plan underway

                                                                                                                 Coca-Cola Amatil 2017 Full Year Result   12
ccamatil.com
                AUSTRALIAN BEVERAGES
Improved performance in the second half                                  CATEGORY
particularly in still beverages                                           Initiatives implemented during the year resulted
                                                                           in improved performance for sparkling and still
                                                                           beverages in the second half
 Volume Composition By Category (million unit cases)
                                                                          However, not sufficient to fully offset challenges
                                                                           in the first half, where competitive pricing in
                                              FY         1H       2H
                         FY17      FY16     Change     Change   Change     sparkling beverages resulted in volume decline,
                                              %          %        %        and significant growth in private label water
                                                                           resulted in branded water volume decline
      Sparkling                                                           We subsequently invested in price for branded
                                                                           water resulting in volume stabilisation
        Beverages        206.7     213.6      (3.2)     (3.8)    (2.7)
                                                                          Positive performance in the energy and dairy
        Frozen            25.2      22.9      10.0      14.4      6.4
                                                                           categories

      Still               79.2      82.5      (4.0)     (8.5)     0.8
                                                                         CHANNEL
                                                                          Revenue and volume improvements in Grocery
                                                                           and Petrol & Convenience in the second half

      Total             311.1     319.0       (2.5)     (3.9)    (1.2)    Continued pressure in immediate consumption
                                                                           in National and State Operational Accounts

                                                                                                 Coca-Cola Amatil 2017 Full Year Result   13
ccamatil.com
                       NEW ZEALAND & FIJI
Another strong performance with continued EBIT growth
                                                                                                                      NEW ZEALAND
                                                                                                    Change –
                                                                                 Change                              New Zealand achieved revenue and volume
   $ million                                          FY17          FY16                            Constant
                                                                                     %                                growth with a strong performance in
                                                                                                 Currency1 %
                                                                                                                      sparkling beverages
   Trading revenue                                   554.1          551.5             0.5                     1.9    Strong result in energy and juice categories,
                                                                                                                      offsetting some challenges in sports and
                                                                                                                      water
       Revenue per unit case ($)                      $7.84         $7.81             0.4                     1.8
                                                                                                                     Growth in grocery, convenience & leisure
                                                                                                                      and quick service restaurant channels
       Volume (million unit cases)                     70.7           70.6            0.1

                                                                                                                      FIJI
   Underlying EBIT                                   104.8            99.7            5.1                     7.0
                                                                                                                     Revenue and volume decline reflecting the
                                                                                                                      cycling of a very strong FY16 due to
   EBIT margin                                        18.9%          18.1%        0.8 pts                 0.9 pts     favourable economic conditions post
                                                                                                                      Cyclone Winston
   Return on capital employed                         27.4%        26.3%          1.1 pts                            Improved mix and efficiency gains delivered
                                                                                                                      in the second half

1. The constant currency basis is determined applying FY16 foreign exchange rates to FY17 local currency results.

                                                                                                                                         Coca-Cola Amatil 2017 Full Year Result   14
ccamatil.com
                       INDONESIA & PAPUA NEW GUINEA
Another significant contribution with continued EBIT
improvements in Indonesia and in Papua New Guinea                                                                     INDONESIA
                                                                                                                     Strong EBIT performance despite economic
                                                                                  Change
                                                                                                   Change –           factors affecting consumer discretionary
  $ million                                       FY17               FY16                          Constant
                                                                                      %                               spending, constraining revenue and volume
                                                                                                Currency1 %
                                                                                                                      performance
                                                                                                                     Substantial progress on our business
  Trading revenue                              1,002.7             1,053.3            (4.8)                (1.4)
                                                                                                                      transformation with efficiency gains in
                                                                                                                      manufacturing and route-to-market while
                                                                                                                      continuing to invest in developing capabilities
      Revenue per unit case ($)                   $4.46              $4.63            (3.7)                (0.2)      in the business
                                                                                                                     Progress in winning share in sparkling
      Volume (million unit cases)                 225.0              227.7            (1.2)                           beverages and tea
                                                                                                                     Continuing to invest in manufacturing
                                                                                                                      facilities, cold drink equipment and the rollout
  EBIT                                             90.9               69.6            30.6                  35.2
                                                                                                                      of our route-to-market model

  EBIT margin                                      9.1%              6.6%          2.5 pts               2.5 pts
                                                                                                                      PAPUA NEW GUINEA
                                                        the

1. The constant currency basis is determined applying FY16 foreign exchange rates to FY17 local currency results.    Double digit EBIT growth delivered, aided by
                                                                                                                      favourable economic conditions due to the
                                                                                                                      national election

                                                                                                                                         Coca-Cola Amatil 2017 Full Year Result   15
ccamatil.com
                          ALCOHOL & COFFEE
   Another strong performance, with double digit EBIT                                                                 ALCOHOL
   growth continuing                                                                                                 Alcohol achieved revenue, volume and
                                                                                                                      EBIT growth
                                                                                                   Change –          Solid performance in the Spirits & Premix
      $ million                                 FY17            FY16          Change %              constant
                                                                                                currency1 %
                                                                                                                      segment with Canadian Club growing
                                                                                                                      above market growth
      Trading revenue                        564.8            535.5                  5.5                  6.0        Significant increase in beer volumes with
                                                                                                                      the addition of Molson Coors
                                                                                                                      International’s Miller Genuine Draft and
      EBIT                                     49.7             44.7               11.2                 11.9
                                                                                                                      Miller Chill brands in Australia
                                                                                                                     Significant investment invested back into
      EBIT margin                                8.8%            8.3%           0.5 pts              0.5 pts
                                                                                                                      the business to build our capabilities and
1. The constant currency basis is determined applying FY16 foreign exchange rates to FY17 local currency results.     support our long-term growth aspirations

                                                                                                                    COFFEE
                                                                                                                     Revenue and volume growth, while the
                                                                                                                      business invested in capability
                                                                                                                      development
                                                                                                                     Additional investment in the business,
                                                                                                                      including an out of home coffee business
                                                                                                                      and sales team, to develop opportunities
                                                                                                                      in new markets and expand our offering

                                                                                                                                          Coca-Cola Amatil 2017 Full Year Result   16
ccamatil.com
                       CORPORATE, FOOD & SERVICES
Improved earnings in SPC but smaller                          SPC
contribution from services division                          Delivered a small profit, benefitting from reduced
                                                              depreciation and improved portfolio mix
   $ million                      FY17    FY16   Change %    SPC revenue decline reflecting proactively exiting
                                                              a number of private label lines as well as
   Trading revenue1             277.0    316.2    (12.4)      continued competitive pressure
                                                             Encouraging signs in tomatoes and beans &
                                                              spaghetti
   Underlying EBIT               20.7     28.5    (27.4)     Continued pressure in fruit and spreads

1. Majority derived from SPC.
                                                              SERVICES
                                                             Smaller contribution from the services division due
                                                              to the sale of Quirks and lower services
                                                              requirement to Australian Beverages

                                                              PROPERTY
                                                             A Property Division was established within this
                                                              segment from 1 January 2017
                                                             Key property assets from Australian Beverages
                                                              and New Zealand have been moved into this
                                                              segment – segment assets and earnings restated
                                                             Income derived from rent charged to businesses
                                                              based on market rates
                                                             Division responsible for Group-wide management
                                                              of ownership and lease arrangements for all
                                                              facilities            Coca-Cola Amatil 2017 Full Year Result    17
ccamatil.com
FINANCIALS
Martyn Roberts Group Chief Financial Officer

                                               Coca-Cola Amatil 2017 Full Year Result   18
ccamatil.com
                     INCOME STATEMENT
Underlying NPAT broadly in line with FY16 and in line with                       COMMENTARY
guidance provided in April                                                      Strong EBIT growth in Indonesia &
                                                                                 Papua New Guinea, Alcohol & Coffee,
 $ million                                      FY17       FY16    Change %      New Zealand & Fiji, offset by EBIT
                                                                                 decline in Australian Beverages
 Underlying EBIT                               678.7      683.4        (0.7)
                                                                                Lower net finance costs despite
                                                                                 increased net debt, resulting from
 Net finance costs                              (68.8)    (73.0)        5.8      lower interest rates in Australia
                                                                                Effective tax rate (underlying) of
                                                                                 29.2 per cent reflecting a higher mix
 Taxation expense (before non-trading items)   (177.9)   (181.3)        1.9
                                                                                 of earnings towards overseas
                                                                                 businesses where tax rates are lower
 Non-controlling interests                      (15.8)    (11.2)       41.1
                                                                                Strong performance in Indonesia
                                                                                 resulting in increased non-
 NPAT before non-trading items                                                   controlling interests
 attributable to Coca-Cola Amatil              416.2      417.9        (0.4)    Non-trading items after income tax
 shareholders                                                                    of $29.0 million resulting from one-off
                                                                                 gains from sale of Richlands facility in
                                                                                 2H17 and utilisation of capital losses
 Non-trading items after income tax              29.0    (171.8)        nm
                                                                                 offsetting cost optimisation programs
                                                                                 in Australian Beverages
 NPAT attributable to Coca-Cola Amatil         445.2      246.1        80.9
 shareholders

                                                                                                Coca-Cola Amatil 2017 Full Year Result   19
ccamatil.com
                     CAPITAL EMPLOYED
Strong return on capital employed at 20.9 per cent
                                                                                        COMMENTARY
                                                                                       Capital employed reduced by $49.5 million
 $ million                                          FY17      FY16     Variance $M
                                                                                        resulting from:
 Working capital                                    476.3     458.8            17.5      Working capital increased driven by
                                                                                          strong sales in the last two weeks of
                                                                                          December in Australia, timing of collections
 Property, plant and equipment (PPE)               1,864.8   1,948.9         (84.1)
                                                                                          and requirements to support growth,
                                                                                          partially offset by FX translation benefits and
 Intangible assets                                 1,207.9   1,218.5         (10.6)       increased accruals

 Current and deferred tax liabilities              (306.3)   (343.7)           37.4
                                                                                         PPE decreased reflecting FX translation,
                                                                                          sale of Richlands facility and Thebarton
                                                                                          write-downs, partially offset by capital spend
 Net non-debt derivatives (liabilities) / assets     (5.4)     25.4          (30.8)
                                                                                         Intangible assets decreased due to FX
                                                                                          translation and amortisation of previous
 Other net assets / (liabilities)                   (19.8)    (40.9)           21.1
                                                                                          investment
                                                                                         Current and deferred tax liabilities
 Capital employed                                  3,217.5   3,267.0         (49.5)
                                                                                          decreased due to unrealised losses on sugar
                                                                                          derivatives and cycling prior year tax
 Return on capital employed (ROCE)                 20.9%     20.4%      0.5 points        benefits in Australia
                                                                                         Net non-debt derivative assets
                                                                                          movement primarily driven by lower sugar
                                                                                          market prices
                                                                                         Other liabilities decreased due to NSW
                                                                                          container deposit scheme and provision
                                                                                          movements

                                                                                                          Coca-Cola Amatil 2017 Full Year Result   20
ccamatil.com
                   CAPITAL EXPENDITURE
Capital expenditure of $312 million, higher than FY16,                                                COMMENTARY
reflecting increased capex for Richlands projects                                                    Capital expenditure for 2017 was higher than
                                                                                                      2016 and weighted to the second half
                                                                                                     Australian Beverages: included spend on
 Capex ($ million) and Capex / Depreciation and amortisation (x times)
                                                                                                      new production lines at Richlands, technology to
           2.00                                                                                       support sales and customer service programs
 600                                                                                       2.00
                                                                                                      and further automation of support services
                           1.60

 500       464                                                                      1.20
                                                                                           1.50      New Zealand & Fiji: included spend on rollout
                                                                      1.10
             1
                                               1.07
                                                      0.95                                            of additional cold drink equipment in the QSR
                           393                                                             1.00
 400
                                                                                                      channel, supply chain improvements in New
                             3
            165
                                                                                                      Zealand and a PET blowfill line in Fiji
                                                                                    312    0.50
                           117                                        296
                                               285
                                                                                     8
 300
                                               10     256              11                            Indonesia & PNG: increased production
                                                                       58            99    -
            143
                            68                 73
                                                        7
                                                                                                      efficiencies resulting in lower capex spend
                                                       54
 200                        16                                         62                             requirement in Indonesia; however, we
                                               69                                    84    (0.50)
                                                       72
            42
                                                                       39                             commissioned our ASSP line, new sparkling
                                               17
                                                       27
 100                       189                                                       35
                                                                                           (1.00)     beverages line at Medan; warehouse and pre-
                                               117                    126
            113                                        96                            85               form facility in Surabaya; new can line in PNG
  -                                                                                        (1.50)
           FY12           FY13             FY14       FY15           FY16           FY17             Corporate, Food and Services: included
                  Indonesia & PNG                            New Zealand & Fiji                       spend on Property Division (ie Richlands’
                  Corporate, Food & Services                 Australian Beverages                     warehouse automation project)
                  Alcohol & Coffee                           Total
                  Capex / D&A

                                                                                                                         Coca-Cola Amatil 2017 Full Year Result   21
ccamatil.com
                           FREE CASH FLOW
Cash realisation rate solid at 91.9 per cent
                                                                                                                             COMMENTARY
                                                                                                                           Free cash flow result in 2016 was
                                                                                                      Change
     $ million                                                                FY17        FY16
                                                                                                        ($M)                excellent
     Underlying EBIT                                                            678.7       683.4           (4.7)          Free cash flow in 2017 was lower than
     Depreciation and amortisation                                               261.8       269.3           (7.5)          2016 at $429.3 million
     Impairments – non-cash                                                        2.5         4.1           (1.6)         Working capital increased driven by strong
     Change in adjusted working capital1                                        (52.8)        17.7         (70.5)           sales in the last two weeks of December
     Net interest paid and finance costs                                        (53.5)       (56.0)           2.5           in Australia, timing of collections and
     Taxation paid                                                             (173.4)     (145.0)         (28.4)           requirements to support growth
     Movements in other items2                                                  (25.9)         1.3         (27.2)          Tax paid was higher due to cycling of tax
     Underlying operating cash flow (before non-trading items)                  637.4       774.8        (137.4)            benefits in Australia in 2016
     Capital expenditure                                                       (312.2)     (295.7)         (16.5)          Movements in other items reflected
     Proceeds from sale of non-current assets                                      6.9        13.9           (7.0)          prepayments in relation to NSW container
     Payments for additions of other intangible assets                                -       (2.5)           2.5           deposit scheme and provision movements
     Underlying free cash flow (before non-trading items)                       332.1       490.5        (158.4)
                                                                                                                           Capital spend increased reflecting
     Add: Cash flow from non-trading items                                       97.2             -         97.2            increased spend on the Richlands
     Free cash flow                                                             429.3       490.5         (61.2)            automated warehouse project and new
     Cash realisation3                                                         91.9%      110.9%      (19.0) pts            production lines

1.    Working capital is adjusted to exclude the impact of non-cash flow and non-operating items such as foreign exchange translation, impacts
      of disposal of businesses and payables relating to additions of property, plant and equipment.
2.    Mainly comprising of movements in prepayments and provisions.
3.    Underlying basis: net operating cash flows divided by NPAT (adding back depreciation and amortisation expenses before tax).

                                                                                                                                                 Coca-Cola Amatil 2017 Full Year Result   22
ccamatil.com
                      NET DEBT AND INTEREST COVER
Strong balance sheet with net debt at $1.3 billion and                                               COMMENTARY
underlying EBIT interest cover of 9.9 times
                                                                                                    Net debt increased by $344.4 million to
                                                                                                     $1,337.2 million from FY16 primarily
 Net debt ($ million) and Underlying EBIT interest cover (x times)                                   due to share buy-back program

                                                                                      9.9
                                                                                                    Total available debt facilities at the end
4,000.0                                                                     9.4
                                                                                                     of the year were $2.78 billion with
                                                                                              9
              7.8                                           7.7
                                                                                                     average maturity of 5.5 years
3,500.0
                            6.7
                                                                                              7
                                                                                                    Substantial proportion of cash assets
3,000.0                                    5.3
                                                                                                     held for specific purposes
                                                                                              5     Underlying EBIT interest cover has
2,500.0                                                                                              increased to 9.9 times
                                                                                              3
2,000.0

                                         1,871.3
                          1,759.3                                                             1
1,500.0     1,632.5

                                                                                    1,337.2
1,000.0                                                                                       -1
                                                          1,146.3
                                                                           992.8

 500.0                                                                                        -3

    -                                                                                         -5
             FY12          FY13          FY14              FY15            FY16     FY17

                             Net debt              Underlying EBIT interest cover

                                                                                                                       Coca-Cola Amatil 2017 Full Year Result   23
ccamatil.com
STRATEGY &
PROGRESS
UPDATES
Alison Watkins Group Managing Director

                                         Coca-Cola Amatil 2017 Full Year Result   24
OUR GROUP STRATEGY HAS

                                                                                                        ccamatil.com
THREE DISTINCT ELEMENTS

PERFORM                    Primary focus
                                            GROW                             Greater focus

   LEAD          EXECUTE   PERFORM
                                                   GROWTH WITHIN

                                                   GROWTH BETWEEN

                                                   GROWTH BEYOND

STRONG ORGANISATION                                                       Ongoing focus

     FIT FOR PURPOSE               LEADERSHIP         REPUTATION AND TRUST

                                                               Coca-Cola Amatil 2017 Full Year Result   25
GROW: PURSUING MANY

                                                                                                                    ccamatil.com
GROWTH OPTIONS
GROWTH WITHIN
Additional growth within our businesses
 Leveraging and extending brands and capabilities (eg our route-to-
  market)
 Building and adding new brands and channels

GROWTH BETWEEN
Additional growth between our businesses
 International coffee (eg Indonesia)
 International beer and rum (eg Fiji to Australia and New Zealand)

GROWTH BEYOND
Growth beyond our current businesses
 Additional Coca-Cola territories

 Extending Amatil brands and capabilities to new geographies

 Potential acquisitions

 Exploring additional opportunities and technologies targeting customer
  and consumer needs

                                                                           Coca-Cola Amatil 2017 Full Year Result   26
AUSTRALIAN BEVERAGES

                                                                                                                                                                  ccamatil.com
OUR ACCELERATED AUSTRALIAN GROWTH PLAN
Our joint plan focusses on stabilising the core, targeting growth areas and
delivering improved execution in existing and new channels

  STRATEGY                     LEAD                                     EXECUTE                                      PARTNER

                • Maintain #1 NARTD position, winning NARTD market value growth
  AMBITION      • A broad, innovative consumer-centric portfolio and best-in-market execution
                • Make the “Total Beverages Company” strategy a market reality

                                                                                                                                D. PRECISION
                    A. STABILISE           B. DOUBLE DOWN                C. CLOSE                  C. CREATE
                                                                                                                              AVAILABILITY AND
                     THE CORE             IN GROWTH AREAS                THE GAP                   NEW GAPS
                                                                                                                                ACTIVATION

   ACTIONS        Drive sparkling
                                          Accelerated share          Fast track entry               Lead the
                                                                                                                                 Get the right
                                                                                                                              portfolio in every
                  acceptance and
                                          gain in high value            into other               emergence of                   outlet using a
                  hold ground in
                                          growth categories             categories              new categories               range of route-to-
                 critical categories
                                                                                                                                market models

     LEAD                                                         • Enter established
                                                                    categories where we
                                                                                            • Create new gaps in
                                                                                                emerging categories or
                                                                                                                             • Win in RECA and IC
                                                                                                                             • Digital platforms
   BRANDS &                                                         are not currently           new categories               • Segmented execution

  INITIATIVES                                                       participating

                                                                                                                         Coca-Cola Amatil 2017 Full Year Result   27
PROGRESS UPDATES

                                                                                                                            ccamatil.com
CATEGORY
Since November, we have made good progress against our plans

 COLA                              WATER                            TEA / JUICE

 • Continued transition to Coca-   • Launch of Pump+                • Relaunch of tea range
   Cola No Sugar                   • Targeted price investment to   • Continued roll-out of Keri Juice
 • Launch of Coca-Cola Raspberry     drive competitiveness            Blenders
 • Launched heritage packs in
   RECA

                                                                                   Coca-Cola Amatil 2017 Full Year Result   28
PROGRESS UPDATES

                                                                                                                                                                ccamatil.com
COST OPTIMISATION
We have been successful in identifying and delivering on cost optimisation initiatives
and are accelerating the closure of Thebarton to the end of 2018

 1ST $100M TARGET                           2ND TARGET OF AT LEAST $100M                            $20M TARGET
• Supply chain optimisation                • “Supply chain of the Future”                         • Closure of South Australian
• Procurement optimisation                 • Merchandising and salesforce                           manufacturing facilities
• Support services optimisation              restructure                                          • Close brought forward to occur by
                                           • Procurement optimisation                               the end of 2018
                                           • Support services optimisation

           Delivered ahead of                                                                                        Accelerated
                                                                 On track
                schedule

  INDICATIVE
                        2014          2015              2016                  2017              2018                2019                 2020
    TIMING

     1st               Announced   Delivered ahead of schedule
  $100M                  Oct14

     2nd                                              Announced                   At least a further $100 million
  $100M                                                 Oct16                            cost optimisation

  ~$20M                                                                     Announced
                                                                              Feb17
                                                                                                         Accelerated

                                                                                                                       Coca-Cola Amatil 2017 Full Year Result   29
PROGRESS UPDATES

                                                                                                                                                                   ccamatil.com
ACCELERATING OUR REINVESTMENT
We are bringing forward ~$40 million of reinvestment from the expected cost savings in
2019 to invest against the initiatives in our Accelerated Australian Growth Plan in 2018

Indicative profile of cost optimisation and accelerated reinvestment                                  COMMENTARY
                                                                                                     We have previously aimed to reinvest the
                                                                                                      cost savings in the year it was expected to
                                                                       Accelerated                    be delivered
                                                                                        Total
                                                        ~$20M
     Cost                                                                              ~$120M        Decision to bring forward ~$40 million of
                      ~$45M
 Optimisation                          ~$35M                                         Cost savings
                                                        ~$20M           ~$20M
                                                                                                      reinvestment from the expected cost savings
                                                                                                      in 2019 and 2020
                                                        ~$20M           ~$20M          Total
                                       ~$35M
                                                                                                     The additional ~$40 million of investment in
                                                                                     ~$120M
 Reinvestment         ~$45M
                                                                                   Reinvestment       2018 will be allocated towards initiatives
                                                                                                      covering increases in marketing, execution,
                                                                                                      cold drink equipment, digital technology and
                                       ~$40M                                                          price
                                                             Accelerated
                                                            reinvestment                             The additional ~$40 million of investment in
                                                                                                      2018 is not expected to be offset with cost
                                                                                                      savings in 2018
                       2017             2018             2019              2020
                                                                                                     Our plan is to restore Australian Beverages
                      $100M Target    $20M Target   Reinvestment   Reinvestment brought forward       to revenue and earnings growth but will
                                                                                                      have a negative impact on earnings in 2018

                                                                                                                          Coca-Cola Amatil 2017 Full Year Result   30
PROGRESS UPDATES

                                                                                                                                                      ccamatil.com
CONTAINER DEPOSIT SCHEMES
Australian Beverages’ near-term earnings will be impacted by the implementation
of container deposit schemes in NSW, Queensland, ACT and Western Australia

 NEW SOUTH WALES                                                       OTHER STATES
Overview                                                              ACT
 Commenced for consumers on 1 December 2017 (the industry             Targeting implementation first half 2018
  paid from 1 November)
                                                                       Intend to harmonise operations with NSW scheme
 We increased our prices by 13.6 cents (excluding GST) to
  recover the estimated costs of the scheme                           Queensland
 Our price increases to customers are being transparently             Now targeting implementation in November 2018
  itemised on invoices
                                                                       Amatil actively participating in industry consultation
Commentary
                                                                      Western Australia
 Some volatility in customer ordering in NSW in October /
  November                                                             Targeting implementation early 2019
 Overall, a negative impact on December trading, but extremely       Victoria & Tasmania
  difficult to quantify given the many variables and still early in
  implementation                                                       Indicated not considering the introduction of a container
                                                                        deposit scheme
 Redemption rates in December and January lower than had been
  expected with delays to available collection points
 From April, mechanism for the Scheme Coordinator to adjust the
  redemption cost to reflect discrepancies between redemption
  forecast versus actuals

                                                                                                             Coca-Cola Amatil 2017 Full Year Result   31
ccamatil.com
SUSTAINABILITY &
OUTLOOK
Alison Watkins Group Managing Director

                                         Coca-Cola Amatil 2017 Full Year Result   32
OUR APPROACH TO SUSTAINABILITY WILL UNDERPIN

                                                                                                                                                  ccamatil.com
OUR FUTURE PERFORMANCE
Our focus is on the four areas where we can have the greatest impact

OUR PEOPLE                      WELLBEING                         ENVIRONMENT                      OUR COMMUNITY

We provide a safe, open,        We provide choices and the        We operate responsibly in        We partner with our
flexible and inclusive          information consumers             all we do to minimise our        communities to deliver a
workplace where our people      need to make their choice.        impact on the environment        shared benefit from our
are energised by the                                              and ensure we deliver a          presence.
opportunities they have.                                          positive lasting legacy.
2017 ACHIEVEMENTS               2017 ACHIEVEMENTS                 2017 ACHIEVEMENTS                2017 ACHIEVEMENTS
 Human Rights Policy            Continued reformulation          Leadership role in container    $1.1M invested in the Coca-
  introduced across Group        Commit to measuring NARTD         deposit and refund schemes       Cola Australia Foundation
 73% reduction in injuries       sugar intensity in portfolio     Commit to deliver 25%            with Coca-Cola South Pacific
  since 2012 & 11% increase       and 10% reduction in sugar        carbon reduction for the        Aspire to invest equivalent of
  in hazards reported on 2016     intensity in Australia and NZ     NARTD “drink in your hand”       1% EBIT across Group

                                                                                                         Coca-Cola Amatil 2017 Full Year Result   33
DRAFT
SAFETY FOCUS AND

                                                                                                         ccamatil.com
OUR CONTRIBUTION
SAFETY PERFORMANCE
        Annual Total Recordable Injury Frequency Rate (TRIFR)

            8.1

                                                          5.0
                                   4.4

          2015                   2016                   2017

OUR CONTRIBUTION

                                                                Coca-Cola Amatil 2017 Full Year Result   34
OUTLOOK

                                                                                                                         ccamatil.com
OUTLOOK
 Indonesia, Papua New Guinea, New Zealand, Fiji, Alcohol & Coffee and
  SPC are all expected to continue to deliver growth in line with our
  Shareholder Value Proposition
 Australian Beverages’ and consequently Group near-term earnings will be
  negatively impacted by:
    Accelerated reinvestment of ~$40M of cost savings in 2018 in
     marketing, execution, cold drink equipment, digital technology to
     drive growth initiatives and in price to drive competitiveness; and
    The uncertain impact of container deposit schemes
 We are committed to our Shareholder Value Proposition targeting a
  return to delivery of mid-single digit earnings per share growth in the
  medium term
 This will depend on the success of revenue growth initiatives in Australia,
  Indonesian economic factors and regulatory conditions in each of our
  markets

NON-TRADING ITEMS
 As part of our cost optimisation program in Australian Beverages, we are
  expecting one-off costs in 2018 of approximately $50 million
 We are pursuing additional opportunities within our Property Division
  which we anticipate may result in additional one-off gains in 2018,
  targeting to offset the one-off costs

                                                                                Coca-Cola Amatil 2017 Full Year Result   35
OUTLOOK

                                                                                                                   ccamatil.com
CAPITAL EXPENDITURE
 2018 Group capex expected to be around $400M
 This reflects initiatives to drive growth in Australian Beverages and
  continued investment in Indonesia

DIVIDENDS
 Continue to target medium term dividend payout ratio of over 80
  per cent
 It is anticipated that franking will be at a lower in future years

BALANCE SHEET & RETURN ON CAPITAL EMPLOYED
 Balance Sheet to remain conservative with flexibility to fund future
  growth opportunities
 Expect to maintain strong return on capital employed
 We will also continue to explore opportunities to extract value from
  our property portfolio

                                                                          Coca-Cola Amatil 2017 Full Year Result   36
ccamatil.com
QUESTIONS &
ANSWERS

              Coca-Cola Amatil 2017 Full Year Result   37
ccamatil.com
APPENDIX

           Coca-Cola Amatil 2017 Full Year Result   38
ccamatil.com
You can also read