Full Year Results Presentation - July 2020 - Polar Capital ...
←
→
Page content transcription
If your browser does not render page correctly, please read the page content below
Full Year Results Presentation – July 2020

Results as at 30 April 2020

                                                                                  Year ended                  Year ended      Change
                                                                                   30/04/19                    30/04/20        (y/y)

  Net Assets                                                                   £1,935,646,000                £2,308,597,000   +19.3%

  NAV per ordinary share                                                            1446.40p                   1715.59p       +18.6%

  Price per ordinary share                                                          1354.00p                   1774.00p       +31.0%

  Benchmark Change                                                                                                            +18.1%

  Ordinary shares in issue                                                       133,825,000                  134,566,000     + 0.6%

Source: Polar Capital, 30 April 2020. Past performance is not indicative or a guarantee of future returns.

For non-US investor use only. Please refer to the Important Information at the end of this presentation.                               2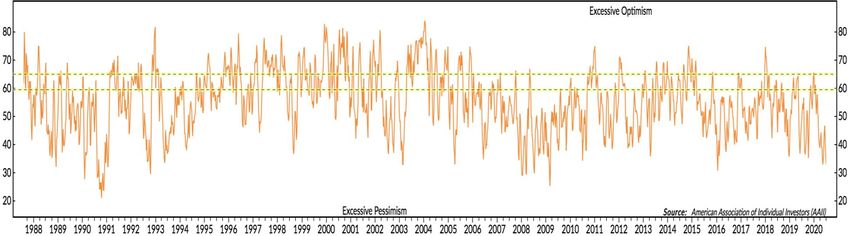
PCT as at 30 June 2020

                                                                                 Year ended                  Year ended      Change       As at
                                                                                  30/04/19                    30/04/20        (y/y)      30/06/20

  Net Assets                                                                  £1,935,646,000                £2,308,597,000   +19.3%   £2,780,107,079

  NAV per ordinary share                                                           1446.40p                   1715.59p       +18.6%     2032.15p

  Price per ordinary share                                                         1354.00p                   1774.00p       +31.0%     2035.00p

  Benchmark Change                                                                                                           +18.1%

  Ordinary shares in issue                                                      133,825,000                  134,566,000     + 0.6%    136,806,000

Source: Polar Capital, 30 June 2020. Past performance is not indicative or a guarantee of future returns.

For non-US investor use only. Please refer to the Important Information at the end of this presentation.                                               3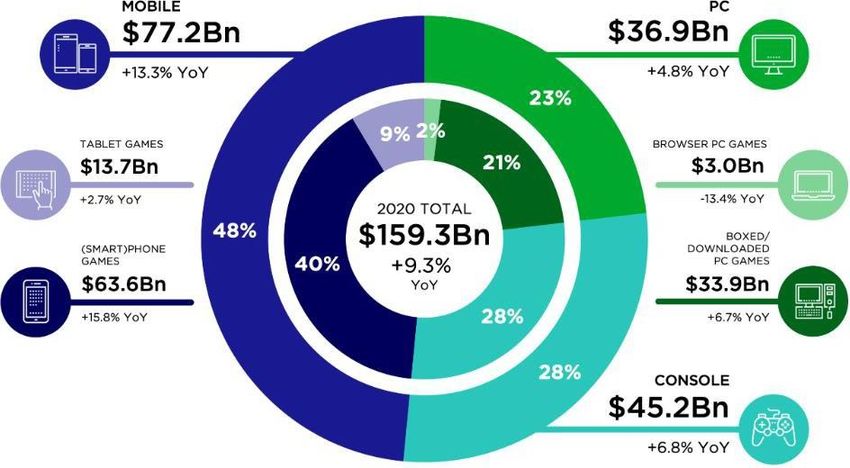
Full Year Review

DJ World Technology vs. FTSE World TR since April 2019                                                     • Global equities (FTSE World -1.5%) fell
                                                                                                             modestly during one of the most remarkable
                                                                                                             years in living memory as COVID-19 changed the
                                                                                                             world as we knew it.
                                                                                                           • This unprecedented challenge was met with
                                                                                                             remarkable worldwide monetary and fiscal
                                                                                                             support driving a stunning equity market reversal;
                                                                                                             after the quickest ever descent into a bear
                                                                                                             market, April delivered the best monthly returns
                                                                                                             since 1987 (and Q2 proved the best quarter for
                                                                                                             US stocks since 1998)

                                                                                                           • Technology stocks enjoyed an outstanding year
                                                                                                             of absolute and relative returns (DJ World Tech
                                                                                                             +18.1% in Sterling terms) due to the sector’s
                                                                                                             relative earnings progress and a valuation re-
                                                                                                             rating while the Coronavirus crisis highlighted the
                                                                                                             sector’s superior growth / balance sheet profile
                                                                                                             and its criticality.
Source: Bloomberg, 30 June 2020. Past performance is not indicative or a guarantee of future returns.

For non-US investor use only. Please refer to the Important Information at the end of this presentation.                                                       4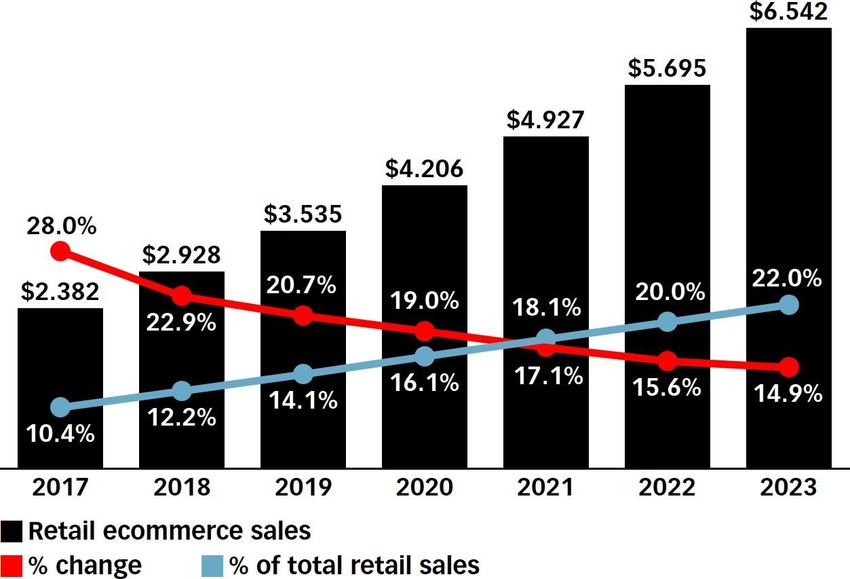
Full Year Review

US technology small caps vs. large caps since April 2019                                                   • Sector strength obscured the growing divergence
                                                                                                             between next-generation and legacy companies,
                                                                                                             as well as large cap (+21%) and small-cap (-
                                                                                                             3%). This divergence extended post COVID with
                                                                                                             outstanding outperformance experienced by
                                                                                                             companies that benefit from (and capture the
                                                                                                             zeitgeist of) the so-called ‘new normal’.
                                                                                                           • NAV performance (+18.6%) exceeded the
                                                                                                             benchmark by 0.5%.
                                                                                                           • The current crisis has shown the modern world is
                                                                                                             built on technology while many of the trends we
                                                                                                             have written about for years have been
                                                                                                             meaningfully accelerated by the crisis. While
                                                                                                             valuations appear to capture at least some of this
                                                                                                             acceleration, we look forward to many more
                                                                                                             years of growth for the technology sector.

Source: Bloomberg, 30 June 2020. Past performance is not indicative or a guarantee of future returns.

For non-US investor use only. Please refer to the Important Information at the end of this presentation.                                                      5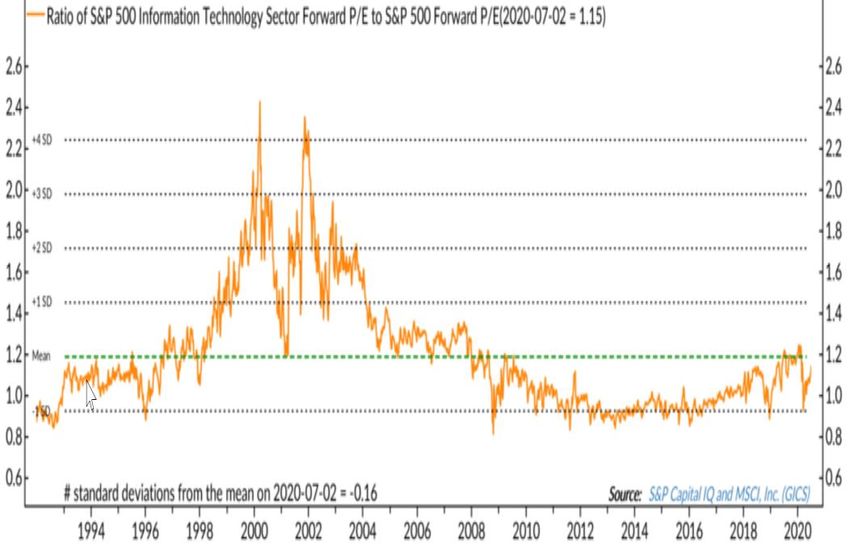
The Technology Team
• Technology is at the core of the Polar Capital business

• One of the largest technology franchises in Europe with c.US$9.8bn under management

• Nine dedicated technology specialists – strong multi-cycle track record

                                          Global Technology                                     Polar Capital Technology                                            Automation & AI
       Funds                                    Fund                                               Trust (LSE listed)                                                    Fund
                                              US$5.8bn                                                 US$3.4bn                                                        US$523m

                                 Nick Evans                                                  Ben Rogoff                                                   Xuesong Zhao
                                 Partner                                                     Partner                                                      Fund Manager/Analyst
                                 Investment experience: 22 years                             Investment experience: 25 years                              Investment experience: 13 years

                                 Sectors: US                                                 Sectors: US                                                  Sectors: Asia (all-cap), global
                                                                                                                                                          semi / Semi cap equipment

 Fund Managers
                                                              Fatima Iu                                                  Alastair Unwin
                                                              Fund Manager/Analyst                                       Fund Manager/Analyst
                                                              Investment experience: 14 years                            Investment experience: 9 years

                                                              Sectors: Europe (all-cap), security,                       Sectors: Global (all-cap) Payments,
                                                              networking, energy & med tech                              SMB software, IT services

                           Chris Wittstock (based in US)                       Bradley Reynolds                                   Paul Johnson                                              Nick Williams
                           Senior Investment Analyst                           Investment Analyst                                 Investment Analyst                                        Investment Analyst
                           Investment experience: 36 years                     Investment experience: 12 year s                   Investment experience: 8 years                            Investment experience: 4 years
      Analysts
                           Sectors: US Technology/Softwar e                    Sectors: US (all-cap) – Internet &                 Sectors: Emerging Tech inc.                               Sectors: Global (all-cap) –
                                                                               digital media                                      3D printing, gaming & autos                               A&AI Fund

Source: Polar Capital, 30 June 2020.

For non-US investor use only. Please refer to the Important Information at the end of this presentation.                                                                                                                     6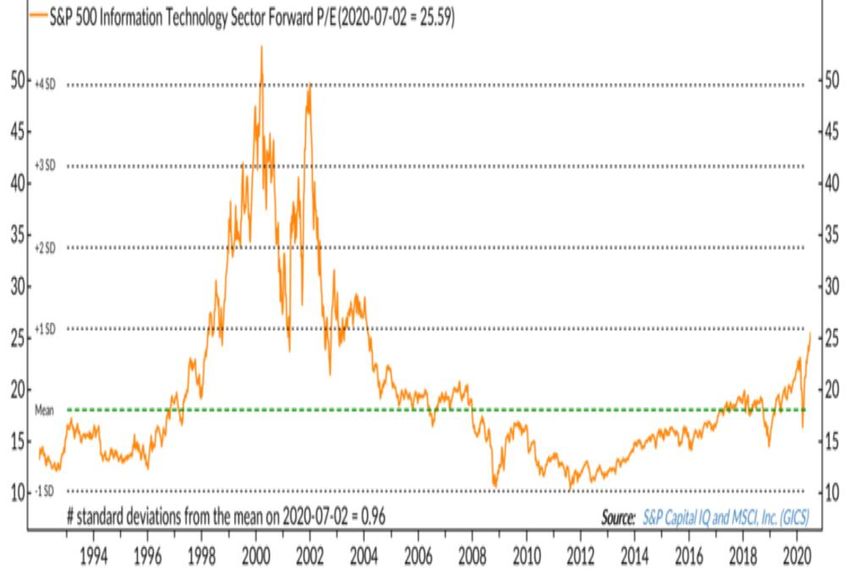
Investment Framework

                               4,000+ universe
                                                                                                                   Dynamic definition of technology
                                                                                Thematic overview              Real-world changes in userbehaviour

                                                                                                                                   S-Curve inflections
                                                                                What we look for                          Secular themes / pure-plays

                                                                                                                             Last-generation winners
                                                                                What we avoid                                  Public venturecapital

                                                                                                               Growth bias – rev/earnings/ cash flow
                                                                                Valuation                  Price targets (bull/base/bear) / Risk reward

                                                                                                                             Bottom-up stock picking
                                                                                Portfolio construction                             Benchmark aware

                                                                                                                        Mis-execution / modelchange
                                                                                Sell disciplines                               Price level attainment
                                      Portfolio

Source: Polar Capital.

For non-US investor use only. Please refer to the Important Information at the end of this presentation.                                                  7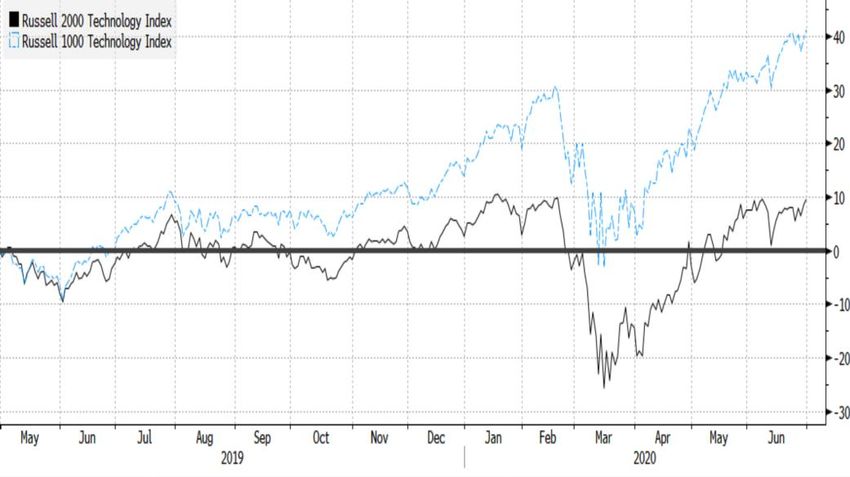
Thematic Investing: Hype vs. Reality
                                                                            Polar Capital Global Technology Team
                                                                       Searching for revenue growth and cash flow inflections

                                                                        R&D                                         High growth                                      Low growth                       No growth
                                 Pre-Revenue                        negative OM%                                   expanding OM%                                     stable OM%                uncertain / decliningOM%

                                                                                                                                                           Payment network
                                                                                                                                                       Digital Gaming               EM smartphones
     Sales (blue)

                                                                                                                                                      eCommerce                              IT Services        Value Trap
                                                                                                                                   Unified Communications         Streaming media          DM smartphones
                                                                                                                                 Digital Twin Simulation       Performance Marketing
                                                                                                                                                                                           Pay TV Subscription
                                                             5G Devices                                                                                    Factory Automation / Robotics
                                                                                                                                       400G Optical                                                  Virtualisation
                                                   Block Chain
                                                                      Robotic Process Autom ation                                                     Internet of Things (IoT)
                                         Precision Medicine                                                                      Clean Energy                                              Cyber Security (Firewall)
                                                                       Next Gen Memory                                                            Software as a Service (SaaS)
                                                                                                                                 EUV Litho                                                     ERP / Traditional SW
                             Edge Computing / Analytics
                                                                        Autonomous Driving                                                    Cloud computing (PaaS/IaaS)
                                                                                                                             3D Sensing                                                                      Mainframe
                                            5G mm Wave
                                                                         SIC/48v                                                          Machine to Machine Communication
                                                                                                                         OLED TV                                                                  Desktop PC / printers
                      Low Earth Orbit Satellite Systems                    Energy Storage                                              Microservices / Containerisation
      Hype (orange)

                                                                                                          ADAS / Active Safety
                                  Solid State Battery                      Smart Agriculture                                     3D Packaging
                        Light Cargo Delivery Drones                          Virtual Reality                                 Mobile Payment
                      Flying Autonomous Vehicles                              Electric Vehicles                          Cyber Security (Cloud Security)

                      Adaptive Machine Learning                                   3D Printing                       Data Economy / Machine Learning
                                                                                       5G Network             AI (Image Recognition)
                           Fuel Cell Vehicles
                                                                                                    AI (Voice Recognition)

                                “Blue Sky”                         Disillusionment                            Emerging / Adoption                                   Mainstream                             Maturity

                       Positioning of themes/products above is only intended to be indicative of approximate penetration/maturity
Source: Polar Capital & Gartner, October 2019. It should not be assumed that recommendations made in future will be profitable or will equal performance of the securities in this document. A list of all
recommendations made within the immediately preceding 12 months is available upon request.

For non-US investor use only. Please refer to the Important Information at the end of this presentation.                                                                                                                     8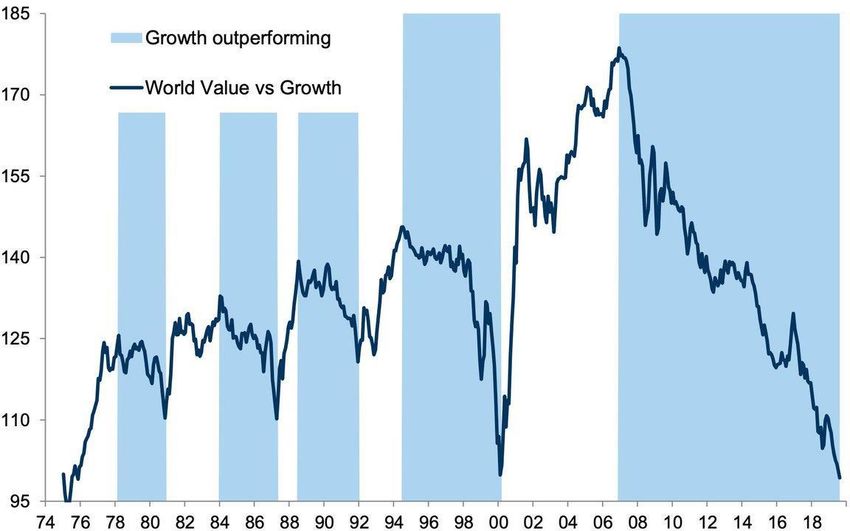
Thematic Investing: Hype vs. Reality

                                                                                                                Consumer Cash Payments, forecasts vs. actual (m)4

      •      Introduced in late 2016 to derision1
      •      Analysts estimate that 16m AirPods were
             sold in 20182 , 40m in 20193 and as many as                                                           “How did you go bankrupt?
             100m by 20212..                                                                                       Two ways. Gradually, then suddenly.”
      •      This would make them Apple’s second fastest                                                                                                                  - Ernest Hemingway
             selling new product of all time5

Source: 1. OneZero, 2019. 2. Ming-Chi Kuo of TF International Securities. 3. Neil Cybart, Above Avalon, February 2019. 4. UK Finance, Link Network. 5. Cult of Mac, 2019. The stocks represented herein do not
reflect the entire holdings contained within the Fund. It should not be assumed that recommendations made in future will be profitable or will equal performance of the securities in this document. A list of all
recommendations made within the immediately preceding 12 months is available upon request. All opinions and estimates constitute the best judgment of Polar Capital as of the date hereof, but are subject to
change without notice, and do not necessarily represent the views of Polar Capital.

For non-US investor use only. Please refer to the Important Information at the end of this presentation.                                                                                                             9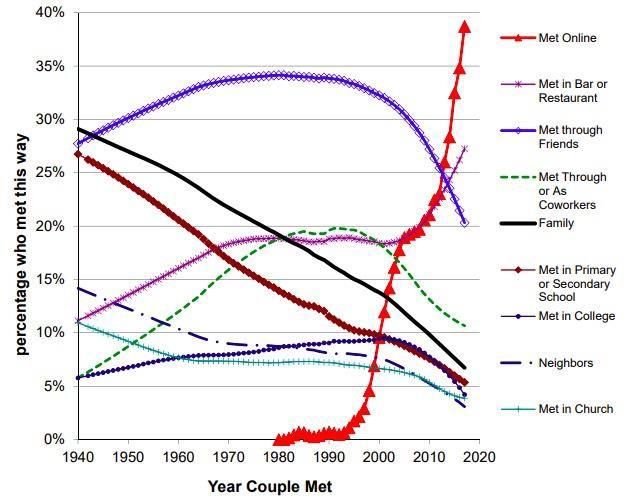
Technology Outperformance

 Tech has driven all the earnings growth since 2009                                                               Helping growth stocks sharply outperform value
 Tech vs. Ex. Tech earnings (1985 – Present)                                                                      World Value vs. Growth stocks (1974 – Present)

Source: FT, Goldman Sachs. Trailing 12-month earnings. It should not be assumed that recommendations made in future will be profitable or will equal performance of the securities in this document. A list of all
recommendations made within the immediately preceding 12 months is available upon request. All opinions and estimates constitute the best judgment of Polar Capital as of the date hereof, but are subject to change
without notice, and do not necessarily represent the views of Polar Capital.

For non-US investor use only. Please refer to the Important Information at the end of this presentation.                                                                                                               6
Eight Core Investment Themes

   Core Investment themes (estimated exposure in Fund)

                          SaaS / Software "Eating the World"                                                                                                                      14.1%
                                   Industry 4.0 / Automation                                                                          4.4%
                               Cloud Infrastructure / Security                                                                                                       11.3%
                                        Digital Entertainment                                                                                                         11.3%
                                  Mobility / Connectivity / 5G                                                                                                                                16.6%
                                          Payments / Fintech                                                                           4.7%
                         Data Economy / Artificial Intelligence                                                                                                                  13.7%
                            Online Advertising / eCommerce                                                                                                                          14.5%
                                 Market Hedge / Beta Offset                                                           0.9%
                                              Other / Cyclical                                                                                  6.7%
                                               Other / Growth                                                            1.6%
                                               Other / Legacy                                                     0.1%
                                                                                                              0%                     5%                    10%                    15%                    20%

Source: Polar Capital, 30 June 2020, internal estimates. Past performance is not indicative or a guarantee of future returns. It should not be assumed that recommendations made in future will be profitable or will
equal performance of the securities in this document. A list of all recommendations made within the immediately preceding 12 months is available upon request. All opinions and estimates constitute the best
judgment of Polar Capital as of the date hereof, but are subject to change without notice, and do not necessarily represent the views of Polar Capital.

For non-US investor use only. Please refer to the Important Information at the end of this presentation.                                                                                                                11
Investment Themes
Eight core theme breakdown (31 January 2017 – 30 June 2020)
19%
18%
17%
16%
15%
14%
13%
12%
11%
10%
9%
8%
7%
6%
5%
4%
3%
2%
1%
0%
Nov-17
Nov-18
Nov-19
Jul-17
Jul-18
Jul-19
May-17
Oct-17
May-18
Oct-18
May-19
Oct-19
May-20
Dec-17
Dec-18
Dec-19
Apr-17
Apr-18
Apr-19
Mar-20
Apr-20
Mar-17
Mar-18
Mar-19
Feb-19
Jan-17
Feb-17
Sep-17
Feb-18
Sep-18
Sep-19
Feb-20
Jun-17
Jan-18
Jun-18
Jan-19
Jun-19
Jan-20
Jun-20
Aug-17
Aug-18
Aug-19
Data Economy / Artificial Intelligence Cloud Infrastructure / Security Digital Entertainment Online Advertising / eCommerce
Market hedge / beta offset Industry 4.0 / Automation Mobility / Connectivity / 5G SaaS / Software "Eating the World"
Payments / Fintech Other / Cyclical Other / Growth Other / Legacy
Source: Polar Capital, 30 June 2020. Past performance is not indicative or a guarantee of future returns.
For non-US investor use only. Please refer to the Important Information at the end of this presentation. 12Digital Disruption: Demographics
How couples meet (1940 – present)1 Gen Z consumers are different2
96% own a smartphone, more than 50% are online >10 hrs/day4
Generation Z 70% watch more than 2 hours of YouTube/day3, 83% watch Netflix5
62% will not use apps that are hard to navigate6
c.26% of the US pop8
80% feel distressed when away from their devices4
Average attention span = 8 seconds7
Source: 1. https://web.stanford.edu/~mrosenfe/Rosenfeld_et_al_Disintermediating_Friends.pdf 2. Visual Capitalist. 3. www.tvlicensing.co.uk. 4. Visual Capitalist. 5. IBM. 6. Uniquely Generation Z Report. 7. Nola
Research Group. 8. Digital Marketing Community, GenZ: New Insights Into the Mobile-First Mindset of US Teens, August 2016 | Think With Google.
It should not be assumed that recommendations made in future will be profitable or will equal performance of the securities in this document. A list of all recommendations made within the immediately preceding
12 months is available upon request.
For non-US investor use only. Please refer to the Important Information at the end of this presentation. 13Digital Disruption: Artificial Intelligence(AI)
Collapsing computing costs (1950 – 2019)1
“Artificial Intelligence technologies will be the
most disruptive class of technologies over the
next 10 years due to radical computational
power, near-endless amounts of data, and
unprecedented advances in deep neural
networks; these will enable organizations with
AI technologies to harness data in order to adapt
to new situations and solve problems that no
one has ever encountered previously”
- Gartner, July 20172
Source: 1. John C. McCallum; Gordon Moore; The Linley Group; Nielson Normal Group; The Economist. 2. Gartner. The stocks represented herein do not reflect the entire holdings contained within the Fund. All
opinions and estimates constitute the best judgment of Polar Capital as of the date hereof, but are subject to change without notice, and do not necessarily represent the views of Polar Capital.
For non-US investor use only. Please refer to the Important Information at the end of this presentation. 14Digital Disruption: COVID Acceleration
Digital transformation – “the business imperative of responding to needs of a new generation of customers,
partners and suppliers who expect transactions to be seamless, real-time, Facebook-like
in experience, Amazon-like in reliability”1
COVID acceleration – “As COVID-19 impacts every aspect of our work and life, we have seen two years’ worth
of digital transformation in two months. From remote teamwork and learning to sales
and customer service to critical cloud infrastructure and security, we are working alongside
customers every day to help them stay open for business in a world of remote everything.
There is both immediate surge demand and systemic structural changes across all of our
solution areas that will define the way we live and work going forward.”
-Satya Nadella, CEO, Microsoft2
Accelerated US eCommerce3 Remote work likely to persist post COVID4
Source: 1. Baird. 2. Microsoft, 30/4/20. 3. Adobe Digital Economy Index May 2020 4 Gartner, compiled by Goldman Sachs Global Investment Research, May 2020 It should not be assumed that recommendations made in
future will be profitable or will equal performance of the securities in this document. A list of all recommendations made within the immediately preceding 12 months is available upon request. All opinions and estimates
constitute the best judgment of Polar Capital as of the date hereof, but are subject to change without notice, and do not necessarily represent the views of Polar Capital.
For non-US investor use only. Please refer to the Important Information at the end of this presentation. 15Investment Themes
Advertising / eCommerce
Internet advertising worth $340bn in 2020E2, 52% of total ad spending2
eCommerce est. $4.2trn in 2020E, c16% of total retail sales1
Brand Building → Transaction facilitation
Payments / Fintech
Global mobile payments worth $2.73tr by 20234
2.1bn consumers to pay via mobile wallet in 20195
eCommerce → behavioural change / disruption
Data Economy / Artificial Intelligence
2.5bn Gb of data generated per day only 1% is stored & analysed7
AI likely largest driver of tech spend over 5-10 years ($127bn by 2025E7)
Rules based engines → Self improving algorithms
Cloud Infrastructure / Security
By 2023, 43% of application workloads expected to run in Cloud services5
Security tailwinds include data breaches, regulation, digitzation, cyberwarfare
Under-utilisation / cost arbitrage → Elastic Compute / TAM expansion
Source: 1. eMarketer, Dec 2019; 2. IAB, Zenith, BoA Dec 2019; 3. BoA / ML / Zenith, US market Jan 18; 4. Payments cards and mobile, 2019. 5. GS CIO Survey (Jan 2020). 6. MS, Geekwire July 2018. 7.
BAML, August 2018. It should not be assumed that recommendations made in future will be profitable or will equal performance of the securities in this document. A list of all recommendations made within the
immediately preceding 12 months is available upon request.
For non-US investor use only. Please refer to the Important Information at the end of this presentation. 16Investment Themes
Software / SaaS “Eating The World”
SaaS market of $141bn in 2019 expected to reach $550bn by 20258
As penetration rises (~30% today5 ) expect more strategic M&A by incumbents
SMB adoption / TAM expansion→ Enterprise / ‘rip and replace’
Digital Entertainment
$146bn 2019 gaming market1 growing to $200bn by 2023E driven by mobile, DLC / MTX 1
Streaming + 5G could open AAA titles to ~2.6bn mobile gamers worldwide2
Leisure → Connected / Competitive
Industry 4.0 / Automation
$381bn TAM by 2023 (c.10% CAGR)3 enabled by advanced components (e.g. sensors, gears)
Position repeatability: 0.01mm (robots) / 0.5mm (humans) VS 0.02mm (iPhone64) / 0.1mm (cars)
Cost savings → Necessity, Flexibility (‘CoBot’) and Consistency
Connectivity / Mobility / 5G
Current networks insufficient to support an increasingly connected world
5G infrastructure spending worth $26bn by 2022E, +118% CAGR (2018-2022)7
Capacity + latency → IoT enablement
Source: 1. Newzoo, April 2020; 2. Newzoo April 2020 3. marketsandmarkets, May 2018; 4. Cult of Mac, 2014. 5. IDC. 6. NewZoo May 2017. 7. ZDNet, 2018. 8. Keybanc. It should not be assumed that recommendations
made in future will be profitable or will equal performance of the securities in this document. A list of all recommendations made within the immediately preceding 12 months is available upon request.
For non-US investor use only. Please refer to the Important Information at the end of this presentation. 17Digital Marketing / Online Advertising
• Global online advertising worth $340bn in 2020E, c. 52% of total worldwide advertising spend1
• Online share of US advertising now commensurate with % time spent in media (51% vs. 20%/33% in 2010)…2
• …but TV + radio + print still c.49% of US ad spending and new dollar pools (trade spend / direct marketing) emerging2
• US digital media consumption accelerated in 2018 (to +7% y/y) aided by highly favourable demographic trends3
Worldwide digital advertising spending ($bn): 2018 – 20233 TAM expansion as new dollar pools emerge4
Sample Holdings
Source: Polar Capital, unless otherwise stated. 1. IAB, Zenith, BoA,, Dec 2019. 2. Bond Internet Trends 2019 3. Bond Internet Trends 2019 BoAML/Zenith, US market January 2018. 4. Morgan Stanley, March 2020. Note:
*Other includes Telemarketing, Event Sponsorship, Business-to-Business Promotion, Directories and Public Relations.. It should not be assumed that recommendations made in future will be profitable or will equal
performance of the securities in this document. A list of all recommendations made within the immediately preceding 12 months is available upon request. All opinions and estimates constitute the best judgment of Polar
Capital as of the date hereof, but are subject to change without notice, and do not necessarily represent the views of Polar Capital.
For non-US investor use only. Please refer to the Important Information at the end of this presentation. 18eCommerce
• eCommerce growth continues unabated and is forecast at $4.2tr in 2020E, representing c.16% of total retail sales1
• Amazon’s share of US e-commerce now 38%, 4% of all retail spend2
• Mobile now an integral part of the shopping experience, accounting for 63.5% of all retail eCommerce 2
• Improvements in payments / delivery continue to reduce online buying friction / change user behaviour and expectations
Global eCommerce sales, $bn (2017-2023E)1 Online penetration of US retail categories 20193
Sample Holdings
Source: Polar Capital, unless otherwise stated. 1. eMarketer, June 2019. 2. eMarketer, June 2019. 3. eMarketer, Bernstein, Jan 2020. It should not be assumed that recommendations made in future will be profitable or will
equal performance of the securities in this document. A list of all recommendations made within the immediately preceding 12 months is available upon request. All opinions and estimates constitute the best judgment of Polar
Capital as of the date hereof, but are subject to change without notice, and do not necessarily represent the views of Polar Capital.
For non-US investor use only. Please refer to the Important Information at the end of this presentation. 19Payments / Fintech • Global mobile payment market set to reach $2.73tr by 2023, representing a 25% CAGR 2018-20231 • 2.1bn consumers expected to make a purchase via a mobile wallet in 2019, >50% in China2 • B2B opportunity: $120tr (vs. $45tr consumer volume) largely cheque-based today ($4-20/transaction vs. 30-50c digital) 3 • Contactless coming: half of US transactions
Cloud Infrastructure / Security
• Having debunked many of the earlier barriers to adoption, we expect Cloud migration to accelerate over the coming years
• Expect ‘all’ incremental capacity added in cloud: c. 50% of spend by 20192 and 44% of application workloads by 20213
• Cloud deflation to be felt across IT stack – IT Services market worth >$1.1tn in 2019 (2x software + datacentre combined)4
• Cost of cybercrime estimated at $6tr by 2021 with cybersecurity playing a vital role in protecting the digital economy1

 Cloud penetration remains low across major IT spend                                                           Enterprise computing workloads expectations6
 categories5

      Sample Holdings
Source: Polar Capital unless otherwise stated. 1. PWC, The cost of inaction on cybercrime in the Middle East, 2018. 2. Deutsche Bank, January 2016. 3. Morgan Stanley / Geekwire August 2018 4. Gartner, May 2020.
5. Gartner, Goldman Sachs Global Investment Research. 6. Goldman Sachs, Global Investment Research. It should not be assumed that recommendations made in future will be profitable or will equal performance of the
securities in this document. A list of all recommendations made within the immediately preceding 12 months is available upon request. All opinions and estimates constitute the best judgment of Polar Capital as of the date
hereof, but are subject to change without notice, and do not necessarily represent the views of Polar Capital.

For non-US investor use only. Please refer to the Important Information at the end of this presentation.                                                                                                              21
The Data Economy / Artificial Intelligence (AI)
• 2.5bn gigabytes of data is generated per day but only 1% is stored and analysed; this could increase to 37% by 20251
– e.g. a single AV may generate 4TB of data/ day, equivalent to 3,000 people today1
• AI likely to be the single largest driver of tech spending over the next 5-10 years, worth $127bn by 2025E1
– Only 8% of companies have deployed ML beyond testing1, focus likely to remain narrow / specific use-cases
• Data Economy includes semi / components (DRAM / NAND, GPU / FPGA), Cloud (scale), tools (data prep / analytics) and apps.
The ‘Data Economy’ ecosystem2 AI revenue growth by technology, $bn (2015 – 2025E)1
Apps
Tools
Cloud
Semi / components
Sample Holdings
Source: 1. BAML, August 2018 2. Polar Capital. It should not be assumed that recommendations made in future will be profitable or will equal performance of the securities in this document. A list of all recommendations
made within the immediately preceding 12 months is available upon request. All opinions and estimates constitute the best judgment of Polar Capital as of the date hereof, but are subject to change without notice, and do
not necessarily represent the views of Polar Capital.
For non-US investor use only. Please refer to the Important Information at the end of this presentation. 22Software (Is Eating The World)
• Rental / usage-based model is expanding the software market while threatening incumbent franchises / maintenance
• Software as a service (SaaS) targets a $325bn opportunity by 2022, representing 25% of IT spending1
• Focus on the customer experience (CX) driving a front office transformation CRM, UCaaS, CPaaS, voice, payments
• Agility in the data age requires automation / upgraded core business functions AI, BPA, HR, procurement
US nominal tech capex (1980 – Q1’20)2 SaaS spending (2004 – 2020E)1
Sample Holdings
Source: 1. Statista, 2020. 2. Cornerstone, Q1’20. It should not be assumed that recommendations made in future will be profitable or will equal performance of the securities in this document. A list of all recommendations
made within the immediately preceding 12 months is available upon request. All opinions and estimates constitute the best judgment of Polar Capital as of the date hereof, but are subject to change without notice, and do
not necessarily represent the views of Polar Capital.
For non-US investor use only. Please refer to the Important Information at the end of this presentation. 23Digital Entertainment
• Video games: $146bn bn market in 2019 → $201bn by 2023E (~8% CAGR), driven by new console cycle, mobile and AR/VR1
• Meteoric rise of Free-To-Play Fortnite (>78m MAU / $2.4bn sales): both risk and opportunity2
• Streaming video : c.200m (vs. 1bn paid TV) subscribers worldwide, Netflix dominates today with 140m (6x closest comp)3
• eSports: modest TAM (~$1.1bn) but massive audience (201m enthusiasts + 253m occasional viewers) watching 6.6bn hours4
2020 global games market1 Total paid US subscriptions5
Sample Holdings
Source: 1. Newzoo, Apr 2020. 2. Polygon, September 2018 & The Telegraph, 2019. 3. RBC, August 2019. 4. Influencer Marketing Hub. 5. Company data, SNL Kagan, Ampere, Moran Stanley Research estimates. It should
not be assumed that recommendations made in future will be profitable or will equal performance of the securities in this document. A list of all recommendations made within the immediately preceding 12 months is
available upon request. All opinions and estimates constitute the best judgment of Polar Capital as of the date hereof, but are subject to change without notice, and do not necessarily represent the views of
Polar Capital.
For non-US investor use only. Please refer to the Important Information at the end of this presentation. 24Industry 4.0: Automation / Simulation
• The Fourth Industrial Revolution underway driven by Cyber Physical Systems, Internet of Things and Cloud Services
• Edge AI, low latency from 5G and advanced machine vision should enable cobots to self-learn tasks
• Over 25% of manufacturing tasks that can be automated may be performed by robots over the next decade1
• Service robotics (logistics, domestic, medical) market ($17bn +32% y/y in 2019) now the same size as Industrial robotics market
Connected factory combines multiple technologies2 Annual installations of industrial Robots (2013-2022E)3
Sample Holdings
Source: 1. Boston Consulting Group, September 2015. 2. Analog Devices. 3. World Robotics, 2019. It should not be assumed that recommendations made in future will be profitable or will equal performance of the
securities in this document. A list of all recommendations made within the immediately preceding 12 months is available upon request. All opinions and estimates constitute the best judgment of Polar Capital as of the date
hereof, but are subject to change without notice, and do not necessarily represent the views of Polar Capital.
For non-US investor use only. Please refer to the Important Information at the end of this presentation. 25Connectivity: 5G / IoT / Edge Computing • Current networks insufficient capacity / latency to support an increasingly connected world (c.29bn devices by 2022)1 • 5G up to 100x faster with low latency (
5G – Smartphones / Apple
• The c.1.5bn unit smartphone market is mature: global penetration at c.66%1 and units declined 2% y/y in 20201
• Apple remains unique: premium pricing + services. Wearables (+32% y/y in FQ2’20) AirPod / Watch attach at estimated 7% / 12%2
• Can 5G shorten replacement cycles? Although the PC experience is sobering, sentiment could improve ahead of 5G launch in 2020
• 5G content gains coming at a time of higher capital intensity due to ‘Moore’s Stress’ – favours RF, SPE, IC design, test and materials

 Smartphone worldwide unit shipments (2008 - 2022)3                                                                 Apple replacement cycles FY16 – FY21E4

      Sample Holdings

Source: 1. Gartner, Feb 2020. 2. Bernstein, 3 June 2020. 3. Business Insider, 2018. 4. Bernstein, 2020. It should not be assumed that recommendations made in future will be profitable or will equal performance of the
securities in this document. A list of all recommendations made within the immediately preceding 12 months is available upon request. All opinions and estimates constitute the best judgment of Polar Capital as of the date
hereof, but are subject to change without notice, and do not necessarily represent the views of Polar Capital.

For non-US investor use only. Please refer to the Important Information at the end of this presentation.                                                                                                                        27
Phase 1 – Our Early Response to COVID-19
Reduced Exposure Increased Exposure
• Macro sensitive (travel / air / SMB etc.) • Time at home
e.g. PRO, Square, LivePerson, Salesforce.com, Google Netflix, Nintendo, Take-Two, Spotify, Tencent, Activision
• Advertising / marketing • Work from home / security
e.g. Facebook, Adobe, Hubspot, Salesforce.com, Pinterest Akamai, Cloudflare, Okta, Microsoft, Google, Smartsheet
• Cyclical / industrials / robotics • Cloud infrastructure
e.g. Autodesk, Aspen, Yaskawa, ADI, Ansys, Cognex CrowdStrike, Intel, Amazon, Microsoft, Google, AMD,
NVIDIA
• Behaviour change / social distancing
e.g. Match, IAC Interactive, Dolby, Uber, Chegg • 5G and security infrastructure
Lattice Semi, Lumentum, Siltronic, FLIR Systems, Apple,
Mediatek, Arista Networks, Everbridge, Axon
• High valuation / big ticket / long salescycle
e.g. Five9, Workday, Alteryx, Medallia
• Consumer behaviour change
Ocado, Grubhub, Meituan, Twitter, Amazon, Alibaba
• Execution / liquidity / net debt
e.g. Mimecast, TDK, Marvell, 8x8, Keysight
Source: Polar Capital. Subject to change without notice and may not represent the current portfolio. All opinions and estimates constitute the best judgment of Polar Capital as of the date hereof, but are subject to change without
notice, and do not necessarily represent the views of Polar Capital. It should not be assumed that recommendations made in future will be profitable or will equal performance of the securities in this document. A list of all
recommendations made within the immediately preceding 12 months is available upon request.
For non-US investor use only. Please refer to the Important Information at the end of this presentation. 28Phase 2 – Slowly Transitioning to the “New Normal”
Reduced Exposure Increased Exposure
• Temporary behaviour changes • Lasting behaviour changes
(digital entertainment / gaming) (food delivery / exercise at home)
• Work from home • Internet Advertising
(security) (resilient direct response)
• eCommerce • Industry 4.0 / automation exposure
(reduced o/w Amazon,Alibaba) (robotics to enable social distancing)
• Software as a Service • 5G Infrastructure & Devices
(esp. high SMB exposure) (stimulus spend likely in H2)
• US/China trade war risk • 5G Devices & semiconductors
Reducing exposure to … Focusing on companies with …
less liquid stocks (flexibility) strong balance sheets (i.e. net cash)
Source: Polar Capital. All opinions and estimates constitute the best judgment of Polar Capital as of the date hereof, but are subject to change without notice, and do not necessarily represent the views of Polar Capital. It should
not be assumed that recommendations made in future will be profitable or will equal performance of the securities in this document. A list of all recommendations made within the immediately preceding 12 months is available
upon request.
For non-US investor use only. Please refer to the Important Information at the end of this presentation. 29Technology Valuations Absolute sector valuation (PE): Relative sector valuation (PE): At post GFC highs (1992 – present) At / around market level – with superior balance sheet Source: Ned Davis, 2 July 2020. Copyright 2018 Ned Davis Research, Inc. Further distribution prohibited without prior permission. All Rights Reserved. See NDR Disclaimer at www.ndr.com/copyright.html. For data vendor disclaimers refer to www.ndr.com/vendorinfo/. Past performance is not indicative or a guarantee of future returns. For non-US investor use only. Please refer to the Important Information at the end of this presentation. 30
‘Next-Generation’ Valuations

 Internet valuation (equal cap weighted):                                                                                                                                           Software as a Service (SaaS) valuation:
 EV/forward 2 year EV/EBITDA levels1                                                                                                                                                EV/forward 12 month revenue multiples2

   25

   20

   15

   10

    5

    0
                                                                                                   Feb-17
                          Oct-13

                                                                                                                                       Oct-18
                                                                                 Apr-16
        Jan-13
                 Jun-13

                                                     Jan-15
                                                              Jun-15

                                                                                                                                                                  Jan-20
                                                                                                                                                                           Jun-20
                                   Mar-14
                                            Aug-14

                                                                       Nov-15

                                                                                          Sep-16

                                                                                                                     Dec-17

                                                                                                                                                Mar-19
                                                                                                                                                         Aug-19
                                                                                                                              May-18
                                                                                                            Jul-17

                                                                                ML Internet Index

Source: 1. Bloomberg, 30 June 2020. UCITS Internet sector (AMZN/FB/GOOG/BABA/700HK/PYPL) vs Bank of America Merrill Lynch Internet sector Index. 2. Thomson Reuters, KeyBanc, Capital Markets, June 2020.
Includes the following tickers: ADBE, ALRM, APPF, APPN, AVLR, AYX, BAND, BILL, BL, BNFT, BOX, CDAY, CLDR, COUP, CRM, CRWD, CSLT, CSOD, DBX, DDOG, DOCU, DOMO, DT, ECOM, ESTC, EVBG, FIVN,
FSLY, HUBS, LOGM, MDB, MIME, NET, NEWR, NOW, OKTA, PAYC, PCTY, PD, PFPT, PING, PLAN, PRO, PS, QLYS, QTWO, RNG, RP, RPD, SHOP, SMAR, SPSC, SQ, SVMK, TDOC, TEAM, TENB, TLND, TWLO,
TWOU, VEEV, WDAY, WIX, W K, WORK, YEXT, ZEN, ZM, ZS, ZUO. Past performance is not indicative or a guarantee of futurereturns.

For non-US investor use only. Please refer to the Important Information at the end of this presentation.                                                                                                                      31
‘Next-Generation’ Valuations
IT security valuation: Cloud vs legacy valuation
EV/forward 12 month revenue multiples1 EV/trailing 12 month revenue multiples2
14x
12x
EV/ trailing 12 month sales
10x
8x
6x
4x
2x
0x
Jan-10
Jan-11
Jan-12
Jan-13
Jan-14
Jan-15
Jan-16
Jan-17
Jan-18
Jan-19
Jan-20
Sep-10
Sep-11
Sep-12
Sep-13
Sep-14
Sep-15
Sep-16
Sep-17
Sep-18
Sep-19
May-10
May-11
May-12
May-13
May-14
May-15
May-16
May-17
May-18
May-19
May-20
LEGACY CLOUD
Source: 1. Citi Research, FactSet, June 2020. 2. Bloomberg, BofA Merrill Lynch Global Research, June 2020. Past performance is not indicative or a guarantee of future returns.
For non-US investor use only. Please refer to the Important Information at the end of this presentation. 32Rhymes, Not Repeats
Technology outperformance Technology outperformance
Sector market cap as % of S&P 500 market cap Market cap weight minus earnings weight
‒ Q1’20: technology earnings +15% y/y vs. +2.5% S&P 500
Source: Ned Davis, June 2020. Past performance is not indicative or a guarantee of future returns.
For non-US investor use only. Please refer to the Important Information at the end of this presentation. 33Rhymes, Not Repeats Concentration risk: Concentration risk: % of S&P 500 accounted for by largest 5 stocks1 Weights of Top 5 / bottom half of stocks in the S&P 5002 Source: 1. BoA Global Investment Strategy / Bloomberg, June 2020 2. Ned Davis, June 2020. Past performance is not indicative or a guarantee of future returns. For non-US investor use only. Please refer to the Important Information at the end of this presentation. 34
Rhymes, Not Repeats

   Investor sentiment
   AAII Bulls / (Bulls + Bears)1

                                                         Late 1990s exuberance

                                                                                                                                 32.9%
                                                                                                                                 as at
                                                                                                                                 2 July 20201

                                                                                                               Post GFC trauma

Source: 1. Ned Davis as at 2 July 2020. Past performance is not indicative or a guarantee of future returns.

For non-US investor use only. Please refer to the Important Information at the end of this presentation.                             35
PCT Positioning
Sector exposure (%) Market cap exposure (%)
Software 24.1%
Semiconductors & Semiconductor Equipment 17.0% 87.0%
Large Cap (>$10bn)
Interactive Media & Services 16.2%
Technology Hardware, Storage & Peripherals 11.2% Mid Cap (>$1bn - $10bn) 12.0%
Internet & Direct Marketing Retail 7.6% Small Cap (PCT Positioning
Largest overweights Largest underweights Market cap exposure versus benchmark
Activision Blizzard Alphabet
Advanced Micro Devices Analog Devices
Advantest Corp Apple
Large-cap -5.3%
Amazon Applied Materials
Axon Enterprise Autodesk
Ciena Corp Broadcom
CloudFlare Cisco Systems
Crowdstrike Holdings Facebook Mid-cap 4.8%
Everbridge IBM
Mastercard Infosys
Match Group Intel
MediaTek Intuit Small-cap 0.5%
Netflix LAM Research
PayPal Holdings Micron Technology
ServiceNow Microsoft -20% -15% -10% -5% 0% 5% 10% 15%
Take-Two Interactive Software Oracle
Visa SAP
Xilinx Shopify
Zendesk SK Hynix
Zoom Video Communications Texas Instruments
Source: Polar Capital, as at 30 June 2020. Bold denotes a zero position. It should not be assumed that recommendations made in future will be profitable or will equal performance of the securities in this document. A
list of all recommendations made within the immediately preceding 12 months is available upon request.
For non-US investor use only. Please refer to the Important Information at the end of this presentation. 37PCT Positioning
Thematic breakdown1,2 Thematic breakdown relative to benchmark (%)1,2
10.0%
Legacy
11%
5.0%
Internet
26%
0.0%
-5.0%
Semiconductors
21%
-10.0%
Cloud: applications
12% -15.0%
Smartphones
2% -20.0%
Automotive
Solar
Video Games
Cybersecurity
Factory automation/robotics
Materials
Emerging
Payments
Cloud: applications
3D Printing
Medical Technology
Big data / AI
Other
Semiconductors
Smartphones
Internet
Apple
IoT
Electric Vehicles
Legacy
Cloud: infrastructure
Apple
9%
Medical Technology Cloud: infrastructure
Electric Vehicles 1% Solar 5%
1% 0% Cybersecurity
Emerging Other IoT Payments 1%
1% 0% 1% 4%
3D Printing Automotive Big data / AI
0% 1% 2%
Factory
automation/robotics
2%
Source: Polar Capital, 30 June 2020. 1. Benchmark: Dow Jones Global Technology Index (TR). 2. Index exposure based on Top 100 index constituents. Figures are shown as gross weightings.
It should not be assumed that recommendations made in future will be profitable or will equal performance of the securities in this document. A list of all recommendations made within the immediately preceding 12
months is available upon request.
For non-US investor use only. Please refer to the Important Information at the end of this presentation. 38PCT Positioning
Index Index
PCT 1 Top 100 ex Sales growth 2020 – PCT vs. benchmark2
Apple
PE (Median) CY 30.7 28.2 27.5 60.0
NY 28.7 23.6 23.2
Earnings growth (Median) CY 2.8 1.9 2.1
NY 30.8 21.6 21.2 50.0
EV/Sales (Mean) CY 9.8 8.8 8.9
NY 8.3 7.4 7.4
EV/Sales (Median) CY 7.3 6.0 6.2
40.0
NY 6.3 5.4 5.4
EV/Sales (Weighted)** CY 9.6 8.6 9.0
NY 8.1 7.3 7.7
Weight
Sales Growth (Mean) CY 7.1 8.6 8.7 30.0
NY 19.0 14.9 14.9
Sales Growth (Median) CY 8.5 7.3 7.7
NY 17.4 13.2 13.4
20.0
Sales Growth (Weighted)** CY 10.4 8.6 10.1
NY 18.5 14.8 15.4
Gross Margin (Mean) 55.2 55.2 55.4
Gross Margin (Median) 54.3 55.0 55.2 10.0
Gross Margin (Weighted)** 53.0 55.8 59.1
Net Cash as % mkt cap Avg 6.2 5.9 5.9
Wgtd** 6.2 5.3 5.4 0.0
Market Cap ($m) Mean 127,322 115,493 100,010 50
Best Estimate Sales Growth 2020
Median 18,696 31,768 31,767
Wgtd** 549,254 745,494 581,888 PCT GROSS WEIGHT BENCH GROSS WEIGHT
Source: 1. Polar Capital, 08 July 2020. Figures in blue exclude Apple (15.3% gross) from the Index Top 100. CY = Current Year, NY = 2021 calendar year estimates. 2. Polar Capital, 08 July 2020. Benchmark: Dow
Jones Global Technology Index (TR). Past performance is not indicative or a guarantee of future results. All opinions and estimates constitute the best judgment of Polar Capital as of the date hereof, but are subject to
change without notice, and do not necessarily represent the views of Polar Capital. It should not be assumed that recommendations made in future will be profitable or will equal performance of the securities in this
document. A list of all recommendations made within the immediately preceding 12 months is available upon request.
For non-US investor use only. Please refer to the Important Information at the end of this presentation. 39Appendix For non-US investor use only. Please refer to the Important Information at the end of this presentation. 40
Team Biographies
                                    Ben Rogoff – Partner
                                    Experience: 25 years
                                    Ben joined Polar Capital in May 2003. He is lead manager of Polar Capital Technology Trust plc and is a Fund Manager of the Polar Capital
                                    Global Technology Fund and Polar Capital Automation and Artificial Intelligence Fund. He has been a technology specialist for 25 years. Prior to
                                    joining Polar Capital he began his career in fund management at CMI, as a global technology analyst. He moved to Aberdeen Fund Managers in
                                    1998 where he spent four years as a senior technology manager. Ben graduated from St Catherine’s College, Oxford in 1995.

                                    Nick Evans – Partner
                                    Experience: 22 years
                                    Nick joined Polar Capital in September 2007 and has 22 years’ experience as a technology specialist. He has been lead manager of the Polar
                                    Capital Global Technology Fund since January 2008 and is also a fund manager on the Polar Capital Technology Trust and Polar Capital
                                    Automation and Artificial Intelligence Fund. Prior to joining Polar he was head of technology at AXA Framlington and lead manager of the AXA
                                    Framlington Global Technology Fund and the AXA world fund (AWF) – Global Technology from 2001 to 2007 (both rated five stars by S&P). He
                                    also spent three years as a Pan-European investment manager and technology analyst at Hill Samuel Asset Management. Nick has a degree in
                                    Economics and Business Economics from Hull University, has completed all levels of the ASIP, and is a member of the CFA Institute.

                                    Xuesong Zhao
                                    Experience: 12 years
                                    Xuesong joined Polar Capital in May 2012 and has 12 years’ investment experience. He is a lead manager of the Polar Capital Automation and
                                    Artificial Intelligence Fund and is a Fund Manager on the Polar Capital Technology Trust and Polar Capital Global Technology Fund. Prior to
                                    joining Polar Capital, he spent four years working as an investment analyst within the emerging markets & Asia team at Aviva Investors, where he
                                    was responsible for the technology, media and telecom sectors. Prior to that, he worked as a quantitative analyst and risk manager for the
                                    emerging market debt team at Pictet Asset Management. He started his career as a financial engineer at Algorithmics, now owned by IBM, in
                                    2005. He holds an MSc in Finance from Imperial College of Science & Technology, a BA (Hons) in Economics from Peking University. He is also
                                    a CFA charterholder.

For non-US investor use only. Please refer to the Important Information at the end of this presentation.                                                                        41
Team Biographies cont.
Fatima Iu
Experience: 14 years
Fatima joined Polar Capital in April 2006 and has 14 years’ experience. She is a fund manager on the Polar Capital Technology Fund, Polar
Capital Technology Trust and Polar Capital Automation and Artificial Intelligence Fund. She is responsible for the coverage of European
Technology, Global Security, Networking, Clean Energy and Medical Technology. Prior to joining Polar, Fatima spent 18 months working at
Citigroup Asset Management with a focus on consumer products and pharmaceuticals. Fatima holds an MSc in Medicinal Chemistry from Imperial
College of Science & Technology in London. She is also a CFA Charterholder.
Alastair Unwin
Experience: 8 years
Alastair joined Polar Capital in June 2019 as a Fund Manager and Senior Analyst. Prior to joining Polar Capital, Alastair co-managed the Arbrook
American Equities Fund. Between 2014 and 2018 he launched and then managed the Neptune Global Technology Fund and managed the
Neptune US Opportunities Fund. Prior to Neptune, Alastair was a technology analyst at Herald Investment Management. Alastair has a BA (1st
Class Hons) in history from Trinity College, Cambridge and is a CFA Charterholder.
Chris Wittstock
Experience: 36 years
Chris joined Polar Capital in July 2017 as a senior technology analyst based in the US. Prior to joining, Chris led the International research sales
effort at Pacific Crest, a technology investment bank that was ultimately acquired by KeyBanc Capital in 2014. Prior to joining Pacific Crest in 2004,
Chris led the International sales effort at Schwab SoundView, the successor company to Soundview Technology Group where he was since 1996.
Chris spent significant time in Europe as a derivative products specialist in the late 80s and 90s, lastly with Morgan Stanley International. He is a
graduate of University of Toronto, Faculty of Engineering (Industrial).
For non-US investor use only. Please refer to the Important Information at the end of this presentation. 42Team Biographies cont.
Brad Reynolds
Experience: 12 years
Brad joined Polar Capital in October 2011 as an Investment Analyst and Trader working as part of the European Market Neutral team with a focus
on media and internet. In 2014, he joined the Technology team as an Investment Analyst. Prior to joining Polar Capital, Brad worked at Ratio Asset
Management as an analyst and trader, and from 2007 to 2011 he worked at F&C as a hedge fund analyst. Brad started his career in 2001 at
Gartmore Investment Management working within the hedge fund team. Brad graduated from the University of Hertfordshire with a degree in
Business Studies.
Paul Johnson
Experience: 8 years
Paul joined Polar Capital in March 2012 as an Investment Analyst on the Polar Capital Technology team. Prior to joining Polar Capital, Paul helped
manage a private investment fund between 2010 and 2012. Paul holds a BA in History and Politics and a Masters in History from Keele University.
He has successfully passed all three levels of the CFA program.
Nick Williams
Experience: 3 years
Nick joined Polar Capital in June 2019 as an analyst on the Polar Capital Technology team. Prior to joining Polar Capital, Nick worked at Neptune
Investment Management as the Assistant Fund Manager on the US Opportunities growth fund. Prior to that he worked in academia at the
University of Oxford. Nick holds an MChem Chemistry from the University of Oxford.
For non-US investor use only. Please refer to the Important Information at the end of this presentation. 43Portfolio Structure – Liquidity Profile
Liquidity horizon evaluation
10,000,000,000 6.00
9,000,000,000
5.00
8,000,000,000
7,000,000,000
Days to liquidate
4.00
AUM (USDM)
6,000,000,000
5,000,000,000 3.00
4,000,000,000
2.00
3,000,000,000
2,000,000,000
1.00
1,000,000,000
0 -
Jun-18
Jan-19
Jun-20
Oct-18
Apr-19
Oct-19
Feb-18
Mar-18
Mar-19
Feb-20
Mar-20
Dec-17
Aug-18
Sep-18
Dec-18
Aug-19
Nov-19
Dec-19
May-18
May-19
May-20
Jul-19
Global Tech AUM $ Strategy AUM $ Days to liquidate 95% (GT) Days to liquidate 95% (Strat)
Source: Polar Capital, 30 June 2020. Liquidation is calculated assuming 20% of daily volume based on the average volume over the previous 60 days. Past performance is not indicative or a guarantee of future returns.
For non-US investor use only. Please refer to the Important Information at the end of this presentation. 44Important Information
Polar Capital
16 Palace Street
London SW1E 5JD
Important Information: This document is provided for the sole use of the intended recipient and is not a financial promotion. It shall not and does not constitute an offer or solicitation of an offer to make an
investment into any fund or Company managed by Polar Capital. It may not be reproduced in any form without the express permission of Polar Capital and is for the intended recipient only. Clients who have
access to this document should make themselves aware of all relevant risk factors relating to these products contained in the Fund or Company’s Prospectus or latest financial report. The law restricts distribution
of this document in certain jurisdictions; therefore, it is the responsibility of the reader to inform themselves about and observe any such restrictions. It is the responsibility of any person/s in possession of this
document to inform themselves of, and to observe, all applicable laws and regulations of any relevant jurisdiction. Polar Capital Technology Trust plc is an Investment Company with investment trust status and as
such its ordinary shares are excluded from the FCA’s (Financial Conduct Authority’s) restrictions which apply to non-mainstream investment products. The Company conducts its affairs and intends to continue to
do so for the foreseeable future so that the exclusion continues to apply. It is not designed to contain information material to an investor’s decision to invest in in Polar Capital Funds Plc – Automation and Artificial
Intelligence Fund, Polar Capital PLC – Global Technology Fund or Polar Capital Technology Trust plc which is an Alternative Investment Fund under the Alternative Investment Fund Managers Directive
2011/61/EU (“AIFMD”) managed by Polar Capital LLP the appointed Alternative Investment Manager. In relation to each member state of the EEA (each a “Member State”) which has implemented the AIFMD,
this document may only be distributed and shares may only be offered or placed in a Member State to the extent that (1) the fund is permitted to be marketed to professional investors in the relevant Member
State in accordance with AIFMD; or (2) this document may otherwise be lawfully distributed and the shares may otherwise be lawfully offered or placed in that Member State (including at the initiative of the
investor). As at the date of this document, the Fund has not been approved, notified or registered in accordance with the AIFMD for marketing to professional investors in any member state of the EEA. However,
such approval may be sought or such notification or registration may be made in the future. Therefore this document is only transmitted to an investor in an EEA Member State at such investor’s own
initiative. SUCH INFORMATION, INCLUDING RELEVANT RISK FACTORS, IS CONTAINED IN THE COMPANY OR FUND’S OFFER DOCUMENT WHICH MUST BE READ BY ANY PROSPECTIVE
INVESTOR.
Statements/Opinions/Views: All opinions and estimates constitute the best judgment of Polar Capital as of the date hereof, but are subject to change without notice, and do not necessarily represent the views
of Polar Capital. This material does not constitute legal or accounting advice; readers should contact their legal and accounting professionals for such information. All sources are Polar Capital unless otherwise
stated.
Third-party Data: Some information contained herein has been obtained from third party sources and has not been independently verified by Polar Capital. Neither Polar Capital nor any other party involved in or
related to compiling, computing or creating the data makes any express or implied warranties or representations with respect to such data (or the results to be obtained by the use thereof), and all such parties
hereby expressly disclaim all warranties of originality, accuracy, completeness, merchantability or fitness for a particular purpose with respect to any data contained herein.
Holdings: Portfolio data is “as at” the date indicated and should not be relied upon as a complete or current listing of the holdings (or top holdings) of the Company or Fund. The holdings may represent only a
small percentage of the aggregate portfolio holdings, are subject to change without notice, and may not represent current or future portfolio composition. Information on particular holdings may be withheld if it is in
the Company or Fund’s best interest to do so. It should not be assumed that recommendations made in future will be profitable or will equal performance of the securities in this document. A list of all
recommendations made within the immediately preceding 12 months is available upon request. This document is not a recommendation to purchase or sell any particular security. It is designed to provide
updated information to professional investors to enable them to monitor the Company or Fund.
Benchmarks: The following benchmark index is used: Dow Jones World Technology Index (Total Return). This benchmark is generally considered to be representative of the Technology Equity universe. This
benchmark is a broad-based index which is used for comparative/illustrative purposes only and has been selected as it is well known and is easily recognizable by investors. Please refer to www.djindexes.com
for further information on this index. Comparisons to benchmarks have limitations as benchmarks volatility and other material characteristics that may differ from the Company or Fund. Security holdings, industry
weightings and asset allocation made for the Company or Fund may differ significantly from the benchmark. Accordingly, investment results and volatility of the Company or Fund may differ from those of the
benchmark. The indices noted in this document are unmanaged, are unavailable for direct investment, and are not subject to management fees, transaction costs or other types of expenses that the Company or
Fund may incur. The performance of the indices reflects reinvestment of dividends and, where applicable, capital gain distributions. Therefore, investors should carefully consider these limitations and differences
when evaluating the comparative benchmark data performance. Information regarding indices is included merely to show general trends in the periods indicated, it is not intended to imply that the fund was similar
to the indices in composition or risk.
For non-US investor use only. Please refer to the Important Information at the end of this presentation. 45Important Information Cont.
Polar Capital
16 Palace Street
London SW1E 5JD
Regulatory Status: Polar Capital LLP is a limited liability partnership number OC314700. It is authorised and regulated by the UK FCA and is registered as an investment adviser with the US Securities &
Exchange Commission (“SEC”). A list of members is open to inspection at the registered office, 16 Palace Street, London SW1E 5JD. FCA authorised and regulated Investment Managers are expected to write to
investors in funds they manage with details of any side letters they have entered into. The FCA considers a side letter to be an arrangement known to the investment manager which can reasonably be expected
to provide one investor with more materially favourable rights, than those afforded to other investors. These rights may, for example, include enhanced redemption rights, capacity commitments or the provision of
portfolio transparency information which are not generally available. The Fund and the Investment Manager are not aware of, or party to, any such arrangement whereby an investor has any preferential
redemption rights. However, in exceptional circumstances, such as where an investor seeds a new fund or expresses a wish to invest in the Fund over time, certain investors have been or may be provided with
portfolio transparency information and/or capacity commitments which are not generally available. Investors who have any questions concerning side letters or related arrangements should contact the Polar
Capital Desk at the Registrar on 0800 876 6889 (PCTT) or Administrator on +353 1 434 5007 (UCITS). The Fund is prepared to instruct the custodian of the Fund, upon request, to make available to investors
portfolio custody position balance reports monthly in arrears.
Information Subject to Change: The information contained herein is subject to change, without notice, at the discretion of Polar Capital and Polar Capital does not undertake to revise or update this information
in any way.
Forecasts: References to future returns are not promises or estimates of actual returns Polar Capital may achieve. Forecasts contained herein are for illustrative purposes only and does not constitute advice or a
recommendation. Forecasts are based upon subjective estimates and assumptions about circumstances and events that have not and may not take place.
Performance/Investment Process/Risk: Performance is shown net of fees and expenses and includes the reinvestment of dividends and capital gain distributions. Factors affecting the Company or Fund’s
performance may include changes in market conditions (including currency risk) and interest rates and in response to other economic, political, or financial developments. Past performance is not a guide to or
indicative of future results. Future returns are not guaranteed and a loss of principal may occur. Investments are not insured by the FDIC (or any other state or federal agency), or guaranteed by any bank, and
may lose value. No investment process or strategy is free of risk and there is no guarantee that the investment process or strategy described herein will be profitable.
Allocations: The strategy allocation percentages set forth in this document are estimates and actual percentages may vary from time-to-time. The types of investments presented herein will not always have the
same comparable risks and returns. Please see the private placement memorandum or prospectus for a description of the investment allocations as well as the risks associated therewith. Please note that the
Company or Fund may elect to invest assets in different investment sectors from those depicted herein, which may entail additional and/or different risks. Performance of the Company or Fund is dependent on
the Investment Manager’s ability to identify and access appropriate investments, and balance assets to maximize return to the Company or Fund while minimizing its risk. The actual investments in the Company
or Fund may or may not be the same or in the same proportion as those shown herein.
Country Specific disclaimers: The Company or Funds have not been and will not be registered under the U.S. Investment Company Act of 1940, as amended (the "Investment Company Act") and the holders
of its shares will not be entitled to the benefits of the Investment Company Act. In addition, the offer and sale of the Securities have not been, and will not be, registered under the U.S. Securities Act of 1933, as
amended (the "Securities Act"). No Securities may be offered or sold or otherwise transacted within the United States or to, or for the account or benefit of U.S. Persons (as defined in Regulation S of the
Securities Act). In connection with the transaction referred to in this document the shares of the Fund will be offered and sold only outside the United States to, and for the account or benefit of non U.S. Persons
in "offshore- transactions" within the meaning of, and in reliance on the exemption from registration provided by Regulation S under the Securities Act. No money, securities or other consideration is being solicited
and, if sent in response to the information contained herein, will not be accepted. Any failure to comply with the above restrictions may constitute a violation of such securities laws.
For non-US investor use only. Please refer to the Important Information at the end of this presentation. 46You can also read