Full-year results to 30 June 2019 - August 2019 - BWP Trust
←
→
Page content transcription
If your browser does not render page correctly, please read the page content below
Full-year results to 30 June 2019
August 2019
Important notice

    The information provided in this presentation should be considered together with the financial statements for the
    period and previous periods, ASX announcements and other information available on the Trust’s website.
    This presentation has been prepared by BWP Management Limited as the responsible entity for BWP Trust. The
    information provided is for information purposes only and does not constitute an offer to arrange to issue securities or
    other financial products, nor is it intended to constitute legal, tax or accounting advice or opinion. The information
    contained in this presentation is not investment or financial product advice and is not intended to be used as the basis
    for making an investment decision. This presentation has been prepared without taking into account the investment
    objectives, financial situation or particular needs of any particular person.
    All reasonable care has been taken in preparing the information contained in this presentation, however no
    representation or warranty, express or implied, is made as to the fairness, accuracy, completeness or correctness of the
    information, opinions and conclusions contained in this presentation. Without limiting the preceding sentence, no
    representation or warranty, express or implied, is given as to the accuracy, completeness, likelihood of achievement or
    reasonableness of any forward-looking statements, forecasts, prospects or returns contained in this presentation. Such
    forward-looking statements, forecasts, prospects or returns are by their nature subject to significant uncertainties and
    contingencies, many of which will be outside the control of BWP Trust or BWP Management Limited. Also, past
    performance is no guarantee of future performance.
    Before making an investment decision, you should conduct your own due diligence and consult with your own legal,
    tax or accounting adviser as to the accuracy and application of the information provided in this presentation and in
    respect of your particular investment needs, objectives and financial circumstances.

2    FULL-YEAR RESULTS TO 30 JUNE 2019
Presentation outline
    Michael Wedgwood                     >Summary
    Managing Director
    BWP Management Limited               >Results

    Andrew Ross                          >Portfolio
    Portfolio Manager
    BWP Management Limited               >Core portfolio

    David Hawkins                        >Alternative use properties
    Finance Manager
    BWP Management Limited               >Capital management

                                         >Outlook

3    FULL-YEAR RESULTS TO 30 JUNE 2019
Summary

                                                  Wollongong, NSW

4   SUMMARY | FULL-YEAR RESULTS TO 30 JUNE 2019
2019 full-year results at a glance

              $156.3m         ⇧             $116.4m         ⇧             18.11 cpu         ⇧             $2.92 pu ⇧                     15.5% pa
              Total revenue 1.9%1            Dist. amount 1.7%1,2          Ordinary dist. 1.7%1,2              NTA        2.5%1          10 yr total return

                 PORTFOLIO                                             PORTFOLIO                                            CAPITAL
                PERFORMANCE                                           MANAGEMENT                                          MANAGEMENT

                           2.3%                                               97.4%                                           1.56 cents
                  like-for-like rental growth                                   leased                                      special distribution

                         $53.4m3                                                 3                                         A- S&P rating/
                  portfolio revaluation gain                      properties being repositioned,                          A3 Moody’s rating
                                                                     2 re-formatted for LFR

                          6.30%                                                   4                                               17.3%
                      portfolio cap rate                         property divestments completed                                    gearing

                        4.4 years                                                  2                                              3.8%
                        portfolio WALE                                properties being rezoned                        cost of debt at 30 June 2019

    1 In comparison to prior corresponding period
    2 Excludes special distribution, including amount released from capital profits for the special distribution
    3 Gross movement in valuations a $58.1 million revaluation gain before adjustments made for straight-lining of rent

5       SUMMARY | FULL-YEAR RESULTS TO 30 JUNE 2019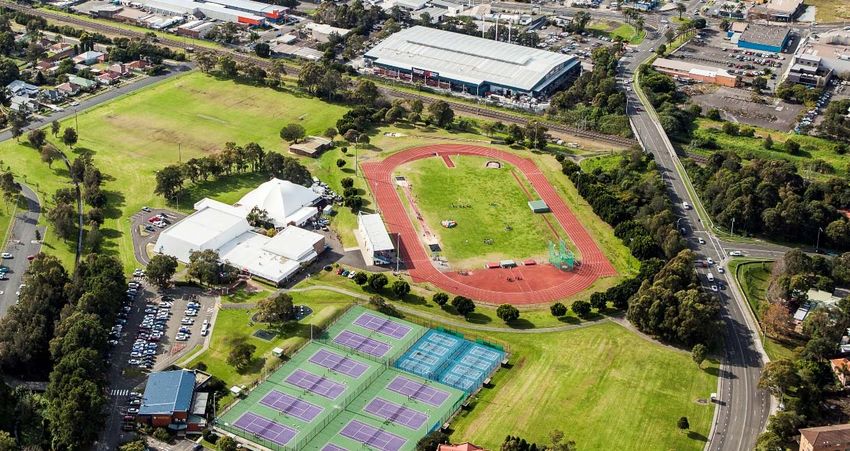
Bunnings
    > 265 Bunnings Warehouse stores across Australia and New Zealand at 31 Dec 2018

    > Half-year revenue of $6.9 billion, up 5.2 per cent per comparable period

    > Addressable Australian market, sales of $78 billion per annum

    > Key strategies:
      – Building a stronger offer: in terms of value offer to customers, new and expanded services,
        easier and innovative DIY, a wider and more localised range, and improving the physical
        network
      – Accelerating trade growth: in terms of the range, relationships with trade customers,
        services, and channels to market, and omni-channel
      – Data and digital: with a focus on full omni-channel capabilities, more content to inspire and
        teach DIY, and stronger analytics capabilities

    > Sustainability priorities:
      – Energy: LED lighting and solar installation at stores
      – Timber: responsible sourcing
      – Waste: reduced packaging and diversion of waste from landfill
      – Water: rainwater collection, water usage, product range
         (with supporting education and awareness)

    Source: Wesfarmers Strategy Briefing Day, 13 June 2019 and Wesfarmers half-year report to 31 December 2018

6     SUMMARY | FULL-YEAR RESULTS TO 30 JUNE 2019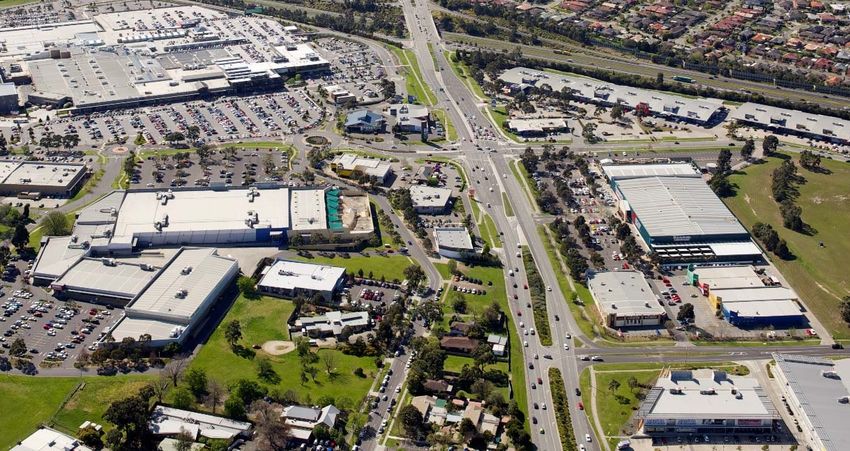
BWP sustainability and climate risk actions
    > 86 per cent of the Trust’s properties have LED lighting in one or more of the car park, nursery
      trading area, canopy trading area, or in the main store

    > 13 properties in portfolio have solar power generation installed

    > 92 per cent of the properties in portfolio have in place water tanks for the recycling of roof
      collected rainwater

    > Property energy efficiency will continue to be the main focus

    > Climate risk assessment undertaken for each property in the portfolio annually

    > Currently reviewing management practices and disclosure with reference to
      Task Force on Climate-related Financial Disclosure recommendations

7    SUMMARY | FULL-YEAR RESULTS TO 30 JUNE 2019
Results

                                                   Port Melbourne, VIC

8    RESULTS | FULL-YEAR RESULTS TO 30 JUNE 2019
Financial performance vs PCP1
                                                                                                               FY2019                                        PCP

    Total revenue                                                                                             $156.3m                                  $153.4m
    Management expense ratio                                                                                      0.62%                                   0.60%
    Other expenses                                                                                                 $7.3m                                   $6.0m
    Distributable profit2 (excluding revaluations)                                                            $115.9m                                  $113.2m
    Number of units on issue                                                                                    642.4m                                   642.4m
    Full-year ordinary distribution per unit                                                              18.11 cents                              17.81 cents
    Special distribution per unit3                                                                          1.56 cents                                                -
    Total assets                                                                                           $2,382.3m                                $2,369.5m
    Borrowings                                                                                                 $412.7m                                 $457.6m
    Net tangible assets per unit                                                                                   $2.92                                    $2.85
    Gearing (debt to total assets)                                                                                17.3%                                   19.3%
    1 pcp: prior corresponding period, being the 12 months ended 30 June 2018 or as at 30 June 2018 as relevant
    2 Excludes any capital profits released
    3 Following the divestment of four properties during the year ended 30 June 2019, a special distribution has been declared with the release of $10.0 million of

      capital profits

9       RESULTS | FULL-YEAR RESULTS TO 30 JUNE 2019
Financial performance 6 monthly
                                                                        6 months to     6 months to          6 months to
                                                                           Jun 2019       Dec 2018              Jun 2018
     Total revenue                                                            $77.3m         $79.0m                     $76.5m
     Management expense ratio                                                 0.62%           0.62%                      0.60%
     Other expenses                                                           $3.8m           $3.5m                       $3.0m
     Distributable amount1                                                   $59.0m          $57.4m2                    $56.8m
     Property revaluation gains                                              $33.3m3         $20.1m3                    $23.0m
     Net profit including property revaluations                              $90.5m          $78.9m                     $79.7m
     Number of units on issue4                                               642.4m          642.4m                     642.4m
     Six months distribution1 (per unit)                                   9.18 cents      8.93 cents               9.03 cents
     Total assets4                                                         $2,382.3m       $2,375.3m                $2,369.5m
     Borrowings4                                                             $412.7m         $437.9m                   $457.6m
     Weighted average cost of debt5 (p.a.)                                   $4.24%           4.31%                      4.46%
     Net tangible assets4 (per unit)                                           $2.92           $2.89                      $2.85
     NTA per unit excluding hedging liabilities4                               $2.92           $2.89                      $2.86
     Weighted average cap rate4                                               6.30%           6.40%                      6.48%
     1 Excludes special distribution                                                             * Figures above subject to rounding
     2 Excludes $1.4 million retained in reserves
     3 After adjustments made for the straight-lining of rent
     4 As at the respective period end rather than for six months to
     5 Finance costs divided by average borrowings for the six months

10       RESULTS | FULL-YEAR RESULTS TO 30 JUNE 2019
Financial summary 5 year performance
FY2019 FY2018 FY2017 FY2016 FY2015
Revenue $156.3m $153.4m $152.5m $150.2m $144.9m
Distributable profit1 $116.4m $114.4m $112.5m $107.9m $101.6m
Total assets $2,382.3m $2,369.5m $2,312.8m $2,200.5m $2,018.0m
Borrowings $412.7m $457.6m $471.1m $472.3m $485.4m
Gearing (debt to total assets) 17.3% 19.3% 20.4% 21.5% 24.1%
Weighted average cost of debt2 4.3% 4.6% 4.6% 5.0% 5.5%
Weighted average cap rate 6.30% 6.48% 6.59% 6.77% 7.33%
Management expense ratio 0.62% 0.60% 0.60% 0.64% 0.65%
Total ordinary distribution
18.11 cents 17.81 cents 17.51 cents 16.79 cents 15.84 cents
per unit
1 Includes any capital profits released relating to ordinary distributions (FY2019: $0.45 million; FY2018: $1.2 million)
2 Finance costs divided by average borrowings
11 RESULTS | FULL-YEAR RESULTS TO 30 JUNE 2019Portfolio
Morayfield, QLD
12 PORTFOLIO | FULL-YEAR RESULTS TO 30 JUNE 2019FY2019 like-for-like rental growth
Proportion of rental income Average increase
4%
Market -1.4%1
2.3%
47% Fixed 3.0% like-for-like
rental growth
49% CPI 1.9%
Year ended
2019 2018 2017 2016 2015 2014 2013 2012 2011 2010
30 June (%)
Rental growth2 2.3 2.43 2.1 2.4 2.9 4.0 2.1 4.0 3.4 2.9
CPI growth4 1.9 2.0 1.4 1.6 2.5 2.3 1.7 3.4 2.9 1.6
1 All finalised market rent reviews relating to the year ending 30 June 2019
2 Like-for-like rental growth compares the passing rent at the end of the period to the passing rent at the end of the previous corresponding period, but
excludes any properties acquired, divested, vacated, developed or upgraded during or since the previous corresponding period
3 Amended from 2.5 per cent to take into account market rent reviews finalised post year end
4 Reflects the annual average like-for-like growth resulting from CPI rent reviews completed during each period
13 PORTFOLIO | FULL-YEAR RESULTS TO 30 JUNE 2019Bunnings market rent review outcomes
> One Bunnings market rent review from FY2019 and two market rent reviews from FY2018 were
resolved during the 12 months to 30 June 2019
Passing rent Reviewed rent
Property location Effective date
($pa) ($pa)
Fyshwick, ACT1,2 1,233,359 1,233,359 24 Dec 2017
Artarmon, NSW1,3 1,705,451 1,705,451 9 Feb 2018
Southport, QLD4 1,774,646 1,750,000 10 Nov 2018
4,713,456 4,688,810
1 The market rent review was due during the year ended 30 June 2018, but the outcome of the negotiation was completed during the current financial
year
2 As part of the market rent review agreement, Bunnings has committed to an additional two years with the lease now expiring in December 2024 and the
Trust has given Bunnings a five year option from that date
3 The parties have agreed to waive the subsequent two CPI annual escalations in February 2019 and 2020
4 The market rent review was determined by an independent valuer
14 PORTFOLIO | FULL-YEAR RESULTS TO 30 JUNE 2019FY2019 rent reviews
> Three Bunnings Warehouse market rent reviews due in FY20181 and six market rent reviews due in
FY20192 currently in negotiation
Rent review type FY2019 (all leases)
% of rental
First-half Second-half
income3
CPI 27 18 47%
Fixed 20 26 42%
Market 8 4 11%
Total 55 48 100%
1 Belrose NSW, Wollongong NSW, Villawood NSW
2 Balcatta WA, Coburg VIC, Tuggeranong ACT, Cannon Hill QLD, Bayswater VIC, Browns Plains QLD
3 Based on portfolio rental as at 30 June 2019
15 PORTFOLIO | FULL-YEAR RESULTS TO 30 JUNE 2019Capitalisation rate trends
> New Bunnings Warehouse store yields remain stable in the 5.0 per cent to 5.5 per
cent range
Bunnings transaction yields
10.00%
9.00%
8.00%
7.00%
Bunnings Portfolio
Acquisitions by BWP
6.00%
5.00%
4.00%
3.00%
Jun‐10 Jan‐11 Aug‐11 Feb‐12 Sep‐12 Mar‐13 Oct‐13 Apr‐14 Nov‐14 Jun‐15 Dec‐15 Jul‐16 Jan‐17 Aug‐17 Feb‐18 Sep‐18 Apr‐19 Oct‐19
New Bunnings Store Transactions BWP Portfolio Cap Rate
Secondary Market Bunnings Transactions Portfolio Transaction Average Cap Rate
16 PORTFOLIO | FULL-YEAR RESULTS TO 30 JUNE 2019June 2019 revaluation
> June 2019 weighted average capitalisation rate 6.30 per cent (Dec 2018: 6.40 per cent)
– 14 independent valuations (20 per cent of BWP portfolio value), average cap rate 6.02 per cent
– 61 internal valuations, average cap rate 6.37 per cent
– Stand alone Bunnings Warehouses weighted average cap rate of 6.12 per cent
> FY19 gross fair value gain of $58.11 million on revaluation
– After adjusting for property divestments, cap rate compression largely contributed to the net fair
value gain during the period after the portfolio average cap rate decreased by 18 bps
– Cap rate movement; 19 properties decreased, 51 properties no change and 5 properties
increased
Revaluation by state No. of Rental Cap rate Value
30 June 2019 properties $m/annum2 (%) ($m)
NSW/ACT 18 32.1 6.58 534.4
QLD 19 37.2 6.18 601.6
SA 2 4.1 6.02 67.9
VIC 20 46.2 5.91 759.7
WA 16 26.8 6.93 394.6
Total/weighted average 75 146.4 6.30 2,358.2
1 Gross movement in valuations; statutory accounts reflect a $53.4 million revaluation gain after adjustments made for straight-lining of rent
2 Subject to rounding
17 PORTFOLIO | FULL-YEAR RESULTS TO 30 JUNE 2019June 2019 independent valuations
Jun 2019
Dec 2018 Jun 2019 Valuation
Dec 2018 Jun 2019 Cap Rate Term
Property State Valuation Valuation Movement
Cap Rate Cap Rate Movement Certain
($m) ($m) ($m)
(years)
Rydalmere NSW 5.50% 57.4 5.25% 62.0 -0.25% 4.6 6.7
Thornleigh NSW 6.50% 21.9 6.00% 23.6 -0.50% 1.7 5.2
Wagga Wagga NSW 7.00% 21.1 7.00% 21.7 0.00% 0.6 1.8
Arundel QLD 6.00% 38.1 5.75% 39.8 -0.25% 1.7 6.2
Bethania QLD 6.00% 31.9 6.00% 31.7 0.00% -0.2 6.2
Manly West QLD 5.75% 38.7 5.75% 38.7 0.00% 0.0 7.2
North Lakes QLD 5.75% 46.0 5.50% 48.3 -0.25% 2.3 6.3
Broadmeadows VIC 6.50% 30.3 6.25% 32.0 -0.25% 1.7 1.5
Frankston VIC 6.25% 34.0 6.00% 35.0 -0.25% 1.0 2.5
Sunbury VIC 5.75% 32.5 5.75% 33.5 0.00% 1.0 7.0
Springvale VIC 5.75% 37.3 5.50% 38.8 -0.25% 1.5 6.5
Bibra Lake WA 6.75% 26.0 6.00% 29.3 -0.75% 3.3 5.3
Geraldton WA 7.25% 18.2 7.00% 18.8 -0.25% 0.6 2.5
Albany WA 7.25% 15.1 14.95% 8.7 7.70% -6.4 0.3
Total/
6.11% 448.5 6.02% 461.9 -0.09% 13.4 5.1
weighted average1
1 Figures subject to rounding
18 PORTFOLIO | FULL-YEAR RESULTS TO 30 JUNE 2019Core portfolio
Rydalmere, NSW
19 CORE PORTFOLIO | FULL-YEAR RESULTS TO 30 JUNE 2019Core portfolio summary
66 4.5 years
properties portfolio WALE
14,031m2
3.3 ha
average lettable
average land area
area
75%
82%
upgrade
metro located
properties or
properties
occupiedWeighted average lease expiry profile
25%
20%
% of Rental Income
15%
10%
5%
0%
FY20 FY21 FY22 FY23 FY24 FY25 FY26 FY27 FY28 FY29
1 2
BWH 12 years occ. Showrooms
1 Includes both proposed and completed upgrades
2 Includes Northland which has been retained in the core portfolio due to asset quality
21 CORE PORTFOLIO | FULL-YEAR RESULTS TO 30 JUNE 2019Lease expiries next three years
> Five year options recently exercised for Bibra Lake (WA), Albany (WA), Maitland (NSW),
Thornleigh (NSW), and Noarlunga (SA)
Lease Rent
Property Options Comments
expiry ($’000pa)
Fountain Gate Jan 2020 2 x 5 yrs 1,760 Notification required by Oct 2019; potential upgrade, zoning amendment
Port Melbourne Mar 2020 4 x 5 yrs 2,159 Notification required by Dec 2019
Vermont South Aug 2020 4 x 5 yrs 2,269 Notification required by Jun 2020
Northland Aug 2020 2 x 5 yrs 2,003 Notification required by Jun 2020; Bunnings seeking planning approval for alternative site nearby
Hawthorn Oct 2020 4 x 5 yrs 3,337 Notification required by Jul 2020
Coburg Nov 2020 3 x 5 yrs 1,531 Notification required by May 2020; potential upgrade
Mt Gravatt Dec 2020 4 x 5 yrs 1,366 Notification required by Sep 2020
Broadmeadows Jan 2021 10 yrs 2,007 Notification required by Oct 2020
Mar – Properties acquired in 2011 portfolio transaction - Belmont, Cockburn, Fairfield Waters,
2011 Portfolio 5 x 5 yrs 16,168
Oct 2021 Pakenham, Wagga Wagga, Port Kennedy, Smithfield, Dubbo, Harrisdale and Caroline Springs
Midland Sep 2021 2 x 5 yrs 1,858 Notification required by Jun 2021; Bunnings seeking planning approval for alternative site nearby
Geraldton Dec 2021 2 x 5 yrs 1,319 Notification required by Sep 2021
Mornington Dec 2021 2 x 5 yrs 1,760 Notification required by Sep 2021
Frankston Dec 2021 2 x 5 yrs 2,120 Notification required by Sep 2021
Gladstone Feb 2022 3 x 5 yrs 1,353 Notification required by Nov 2021
Greenacre Apr 2022 5 x 5 yrs 2,785 Notification required by Oct 2021
Craigieburn May 2022 5 x 5 yrs 1,722 Notification required by Nov 2021
Scoresby May 2022 2 x 5 yrs 1,943 Notification required by Feb 2022
22 CORE PORTFOLIO | FULL-YEAR RESULTS TO 30 JUNE 2019Croydon upgrade
> Upgrade cost of $4.0 million at a funding rate of 5.5 per cent
> Upgrade increases the total retail area by 2,190 square metres incorporating an expansion of the
timber trade sales and nursery areas
> Anticipate completion mid-2020
> On completion of the works Bunnings will enter into a new 10 year lease with existing 10 year
option to remain (current term certain 7.2 years)
> Annual CPI reviews with a market rent review on the exercise of the option
> No caps/collars on the market rent review
> No other changes to the existing lease
23 ALTERNATIVE USE PROPERTIES | FULL-YEAR RESULTS TO 30 JUNE 2019Alternative use
properties
Balcatta, WA
24 ALTERNATIVE USE PROPERTIES | FULL-YEAR RESULTS TO 30 JUNE 2019Hoxton Park repositioning
> Bunnings surrendered its lease in June 2019 ($2.15 million surrender fee to BWP)
> New large format retail leases secured to occupy over 70 per cent of the building area
> Tenants include Total Tools, Totally Work Wear, Crunch Fitness, Jaycar and South West Kids Clinic
> Construction underway, to be completed by December 2019 at an expected cost of approximately
$12.0 million
> Leases remain in place with Kennards Self Storage and Officeworks in the adjoining building on
BWP’s site
> Kennards will lease additional area in the re-purposed building and extend existing lease with
both leases expiring in 2032
> WALE pre-Bunnings lease surrender 2.0 years anticipated to increase to 10.5 years on completion
of development
> Likely fair value on-completion of $59.0 million (7.00 per cent capitalisation rate), resulting in a
$20.0 million increase in current fair value at 30 June 2019
> Fair value prior to Bunnings advising it would vacate was $45.6 million (June 2016)
25 ALTERNATIVE USE PROPERTIES | FULL-YEAR RESULTS TO 30 JUNE 2019Other stores being repositioned
Property Lease expiry1 Progress
Development complete with Amart Furniture and Snooze open and trading.
Mandurah Expired Negotiations with other LFR tenants progressing for the remaining lettable area
of 2,560sqm
Concept and feasibility finalised for multi-tenanted industrial development; re-
Cairns Expired
leasing campaign re-launched in July 2019
Planning approval in place for large format retail redevelopment; AFL executed
Port Macquarie Nov 2019 with Amart Furniture for 5,000sqm; leasing campaign progressing for
remaining 2,200sqm of lettable area
Bunnings continues to trade from store. Medium term residential and/or mixed-
Morley Jul 2020
use development potential
Bunnings has lodged a DA for an alternative location. Future options for the
Northland Aug 2020 site are under review and include possible rezoning and mixed use
development
Scheme amendment and structure plan proposal lodged with council in 2018;
Mindarie Sep 2021 expect approval by late 2019 to allow mixed use development of the site which
adjoins Ocean Keys sub-regional shopping centre
1 End of the current Bunnings lease term
26 ALTERNATIVE USE PROPERTIES | FULL-YEAR RESULTS TO 30 JUNE 2019Divestments
Sale price
Property Lease expiry1 Progress
($m)
Under conditional option agreement to sell to unrelated third
Underwood Apr 2019 Undisclosed
party, progressing toward satisfaction of conditions
Under conditional option agreement to sell to unrelated third
Belmont North Mar 2021 Undisclosed
party, progressing toward satisfaction of conditions
Epping Mar 2019 16.2 Settlement completed in February 2019
Oakleigh South Mar 2019 21.4 Settlement completed in February 2019
Lease
Altona 14.4 Settlement completed in September 2018
surrendered
Burleigh Heads Oct 2018 19.7 Settlement completed in September 2018
1 End of the current Bunnings lease term
27 ALTERNATIVE USE PROPERTIES | FULL-YEAR RESULTS TO 30 JUNE 2019Capital
management
Nunawading, VIC
28 CAPITAL MANAGEMENT | FULL-YEAR RESULTS TO 30 JUNE 2019Debt facilities
> Average borrowings for the year $458.3 million (down 2.6 per cent on prior corresponding period)
– 4.3 per cent per annum weighted average cost of debt after hedging (2018: 4.6 per cent per
annum)
– Borrowing costs for the year $19.6 million (down 8.8 per cent on prior corresponding period)
> Bank facilities with CBA and WBC can be extended a further year each year, subject to agreement.
WBC facility has been extended for a further year
> New $100m five-year term debt facility with Sumitomo Mitsui Banking Corporation (“SMBC”)
activated in May 2019 and new $100 million seven-year bond issued in April 2019
> Cost of debt at 30 June 2019: 3.8 per cent per annum
> Interest cover: 6.8 times at 30 June 2019 (2018: 6.5 times)
> Gearing 17.3 per cent at 30 June 2019 (2018: 19.3 per cent)
> A- / Stable S&P rating and A3 Moody’s rating maintained
As at 30 June 2019 Limit ($m) Drawn ($m) Expiry
CBA 110 58 31 Jul 2020
WBC 135 45 30 Apr 2022
SMBC 100 100 20 May 2024
Corporate bond 110 110 11 May 2022
Corporate bond 100 100 10 April 2026
Total /Weighted average 555 413 3.6 years
29 CAPITAL MANAGEMENT | FULL-YEAR RESULTS TO 30 JUNE 2019Debt duration
Debt maturity profile as at 30 June 2019
Volume (A$M)
300
90.4
200
44.6
100 52.0 110.0
100.0 100.0
58.0
0
FY FY FY FY FY FY FY
20 21 22 23 24 25 26
Bonds Drawn bank facilities Undrawn bank facilities
30 CAPITAL MANAGEMENT | FULL-YEAR RESULTS TO 30 JUNE 2019Interest rate hedging
Hedge book profile by
Jun 2019 Dec 2019 Jun 2020 Dec 2020 Jun 2021 Dec 2021
half-year ending
Active swaps ($m) 98 98 85 85 70 40
Swap rates (%)
Maximum 4.92 4.92 4.12 4.12 2.60 2.60
Minimum 2.39 2.39 2.39 2.39 2.39 2.60
Weighted average (%)1 3.07 3.07 2.79 2.79 2.51 2.60
> Including fixed rate corporate bonds:
– $307.5 million hedged at 2.132 per cent weighted average to maturity, at 30 June 2019
1 Weighted average of active swaps at respective half-year end
2 Excludes margins payable on the fixed corporate bonds
31 CAPITAL MANAGEMENT | FULL-YEAR RESULTS TO 30 JUNE 2019Outlook
Fountain Gate, VIC
32 OUTLOOK | FULL-YEAR RESULTS TO 30 JUNE 2019Outlook
Macro economic environment
> Low interest rates, returns and growth
> Demand for Bunnings Warehouse properties is expected to remain stable other than if a major risk event impacts
valuations and/or liquidity in the Australian property sector
> The Trust is well positioned in the event of any change in the macro economic environment with low gearing, a
high returning portfolio, sustainable cashflow and good access to funding
Rental growth
> 44 CPI/ 47 fixed rent reviews in FY2020
> 11 Bunnings MRR’s to be finalised in FY2020 (in addition to those outstanding from FY2018 and FY2019)
Investment
> Primary focus on finalising outcomes on alternative use sites
> Negotiating with Bunnings to progress opportunities to re-invest in existing portfolio
> Continuing to look for acquisitions that create value for the Trust
FY2020 distribution
Taking into account expected rental growth in the core portfolio, the divestment of four properties last financial year,
and the timing of the completion of properties being repositioned, the Trust could expect the distribution for FY2020 to
be marginally higher than the ordinary distribution paid for the year ended 30 June 2019. Capital profits will be utilised
to support distributions as necessary.
33 OUTLOOK | FULL-YEAR RESULTS TO 30 JUNE 2019Further information
bwptrust.com.au
Responsible entity:
BWP Management Limited
Tel: +61 8 9327 4356
Email: investorrelations@bwptrust.com.au
34 FURTHER INFORMATION | FULL-YEAR RESULTS TO 30 JUNE 2019You can also read