Furniture Models Learned from the WWW - Using Web Catalogs to Locate and Categorize Unknown Furniture Pieces in 3D Laser Scans
←
→
Page content transcription
If your browser does not render page correctly, please read the page content below
Furniture Models Learned from the WWW
Using Web Catalogs to Locate and Categorize Unknown Furniture Pieces in 3D Laser Scans
Oscar Martinez Mozos∗ , Member, IEEE, Zoltan-Csaba Marton∗ , Member, IEEE, and Michael Beetz, Member, IEEE,
Abstract—In this article, we address the problem of exploiting
the structure in today’s workplace interiors in order for service
robots to add semantics to their sensor readings and to build
models of their environment by learning generic descriptors from
online object databases. These world models include information
about the location, the shape and the pose of furniture pieces
(chairs, armchairs, tables and sideboards), which allow robots to
perform their tasks more flexibly and efficiently.
To recognize the different objects in real environments,
where high clutter and occlusions are common, our method
automatically learns a vocabulary of object parts from CAD
models downloaded from the Web. After a segmentation and
a probabilistic Hough voting step, likely object locations and a
list of its assumed parts can be obtained without full visibility
and without any prior about their locations. These detections are
then verified by finding the best fitting object model, filtering out
false positives and enabling interaction with the objects.
In the experimental section, we evaluate our method on real
3D scans of indoor scenes and present our insights on what would
be required from a WWW for robots in order to support the
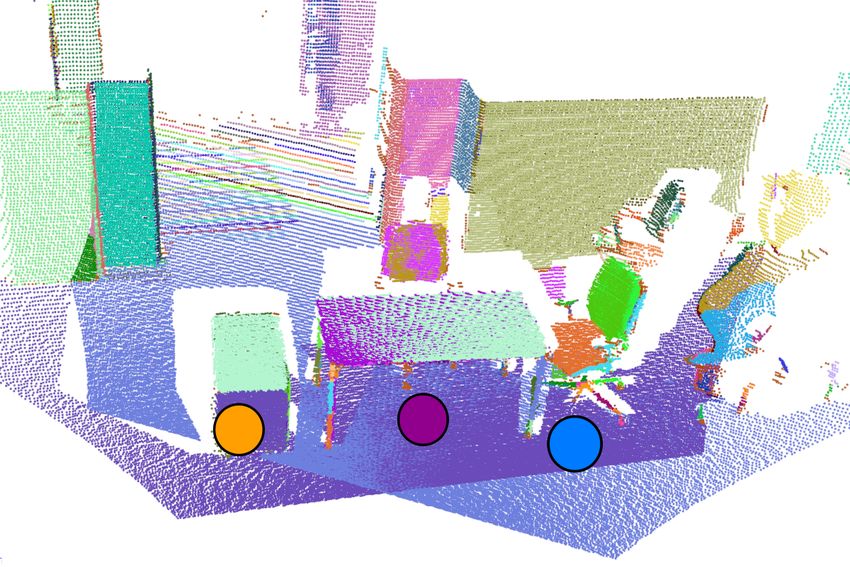
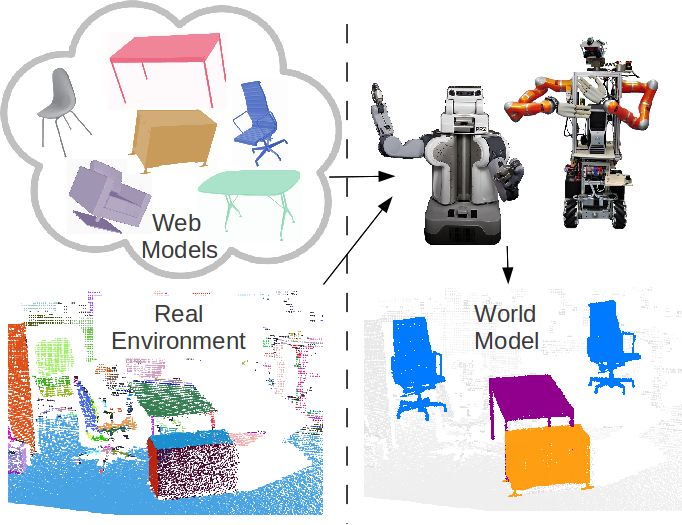
generalization of this approach. Fig. 1. Using furniture models from the WWW together with a segmented
scan of its real environment, the robots create a world model. See the color
I. I NTRODUCTION legend in Fig. 4 (different parts are indicated by random colors).
W E expect the future World Wide Web to include a
shared web for robots, in which they can retrieve
data and information needed for accomplishing their tasks.
approximately horizontal and vertical part, and rectangular
Among many other information, this web will contain models
planar patches are quite common. Thus the key idea of this
of robots’ environments and the objects therein. Today’s web
article is to represent the object models learned by the robot
already contains such 3D object models on websites such as
using a vocabulary of these common parts, together with their
Google 3D Warehouse or catalogs of online furniture stores.
specific spatial distributions in the training objects.
In this article, we investigate how autonomous robots can
exploit the high quality information already available from the During the training process the CAD (Computer Aided
WWW concerning 3D models of office furniture. Apart from Design) models from furniture Web catalogs are converted into
the hobbyist effort in Google 3D Warehouse, many companies point clouds using a realistic simulation of laser scans. These
providing office furnishing have already modeled considerable point clouds are segmented and the resulting parts from the
portions of the objects found in our workplaces and homes. different training objects are clustered to create a vocabulary of
In particular, we present an approach that allows a robot to parts. In the detection step, we match similar parts and apply
learn generic models of typical office furniture using examples probabilistic Hough voting to get initial estimates about the
found in the Web. These generic models are then used by the location and categories of objects found in the scene. Finally,
robot to locate and categorize unknown furniture in real indoor these detections are verified by finding the CAD model that
environments as shown in Fig. 1. best fits to the measurements. This last step allows the robot
Furniture pieces share many common parts, especially if to reject false positive detections.
their purpose is similar. For example, most chairs have an Using larger regions (instead of points) as basic units for
∗
learning offers many advantages. As was already shown in [1],
denotes equal contribution.
Oscar Martinez Mozos is with the Human-Symbiotic Intelligent Robots the knowledge about different functional units of objects can
Lab, Kyushu University, 744 Motooka, Nishi-ku, Fukuoka 819-0395, Japan contribute significantly to a correct detection. Moreover, we
omozos@irvs.is.kyushu-u.ac.jp use training examples that are similar but not necessarily the
Zoltan Csaba Marton and Michael Beetz are with the Intelligent Au-
tonomous Systems, Technische Universität München, 85748 Munich, Ger- same as the objects encountered during the operation of the
many {marton,beetz}@cs.tum.edu robot, thus improving the generalization of the final classifier.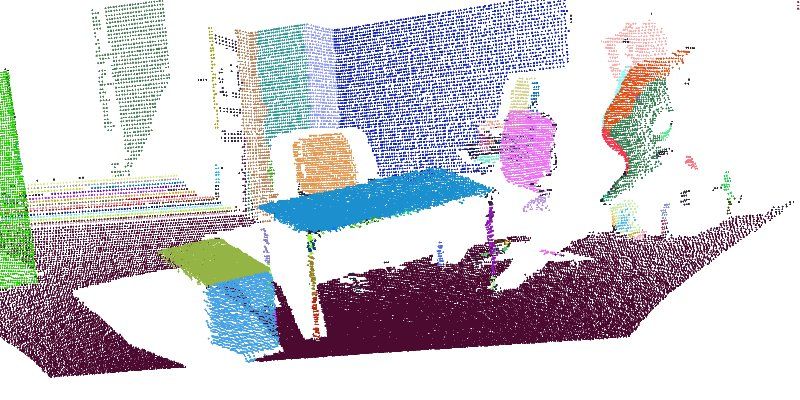
II. R ELATED W ORK                            robot. Combinations of 3D and 2D features for part-based
   Although appearance-based object identification works rea-      detection would definitely improve the results [18].
sonably well using a variety of techniques, the robustness and        For matching problems, RANSAC and its variations are
scalability of many perception systems remains an open issue,      widely used due to the flexibility and robustness of the
as identified by Kragic and Vincze [2]. Ideally, a robot should    algorithm [19], [20]. To register different views of an object,
be able to recognize thousands of objects in a large variety of    local tensors are applied by Mian et al. [21]. Moreover, Rusu et
situations and additionally detect their poses. We will review     al. [22] limit the point correspondences by using local features.
some of the steps taken in this direction and contrast them to        Finally, using synthetic data for training data is an idea
the method proposed in this article.                               that appears in several works [23], [24]. Lai and Fox [25]
   A widely used technique to recognize objects in point           combine scans from real objects with models from Google 3D
clouds involves local descriptors around individual points. For    Warehouse to create an initial training set. In our approach, we
example, the spin image descriptor [3] is used by Triebel et       solely base our classifier on synthetic models, and use those
al. [4] to recognize objects in laser scans, and it is also used   for getting object poses and to verify detection. Additionally,
by de Alarcon et al. [5] to retrieve 3D objects in databases.      we show how our classification results can be combined from
More recently, Steder et al. [6] presented the NARF descriptor     multiple scans to improve the results.
which is well-suited for detecting objects in range images.                   III. 3D P OINT C LOUD S EGMENTATION
Other works apply relational learning to infer the possible
classification of each individual point by collecting informa-        Our classification of objects is based on the detection of
tion from neighboring points. In this sense, Angelov et al. [7]    the different parts that compose them. To determine these
introduce associative Markov networks to segment and classify      parts, we segment the 3D point clouds representing the ob-
3D points in laser scan data. This method is also applied by       jects and scenes. A segmentation defines a disjunct partition
Triebel et al. [8] to recognize objects in indoor environments.    P = {S1 , . . . , SM } of the 3D point cloud. Our segmentation
All previous methods utilize individual 3D points as primitives    method follows a criterion based on a maximum angle dif-
for the classification, whereas we use complete 3D segments        ference between the surface normals. This condition is easily
or “parts” represented by feature vectors. We believe that parts   checked and can be applied to any type of surface. For each
are more expressive when explaining objects.                       point, we calculate its normal by robustly identifying a tangent
   For the detection of complete objects, for example 3D           plane at the selected point and approximating the point’s
shape contexts and harmonic shape contexts, descriptors are        neighborhood (inside a radius of 3 cm) using a height function
presented in the work by Frome et al. [9] to recognize cars in     relative to this plane, in the form of a 2nd order bi-variate
3D range scans. In the work by Wu et al. [10], shape maps          polynomial defined in a local coordinate system [26]:
are used for 3D face recognition. Haar features are used in               h(u,v) = c0 + c1 u + c2 v + c3 uv + c4 u2 + c5 v 2 ,   (1)
depth and reflectance images to train a classifier in the work
by Nüchter et al. [11]. In these works, objects are detected      where u and v are coordinates in the local coordinate system
as a whole, whereas we are able to detect objects by locating      lying on the tangent plane. To obtain the unknown coefficients
only some of their parts, which results in better detections       ci , we perform a direct weighted least squares minimization
under occlusions and when using different viewpoints. Our          and project the point onto the obtained surface. By choosing
work shares several ideas with the approach by Klasing [12],       the query point to be at the origin of the local coordinate
which also detects objects using a vocabulary of segmented         system (U  ~ ⊥ V ~ ⊥ N ~ , with U~ and V~ in the plane, and N  ~
parts. However, we apply the classifier directly to the point      parallel to its normal), we can easily compute the normal ~n of
cloud without looking for isolated objects first.                  the estimated surface by computing the two partial derivatives
   Part-based object classification in 3D point clouds has also                                          ~ +c1 N
                                                                   at (0, 0) and the cross product ~n = (U     ~ )×(V ~ +c2 N
                                                                                                                            ~ ). The
been addressed by Huber et al. [13], using point clouds            surface normals get more and more accurate as the order of the
partitioned by hand. In contrast, we partition the objects in      fitted polynomial increases, but in our experiments we found
an unsupervised manner. Ruiz-Correa et al. [14] introduce an       an order of 2 to give sufficiently good results for segmentation
abstract representation of shape classes that encode the spatial   while keeping the computational costs low.
relationships between object parts. The method applies point           Using the obtained normals for each point in the cloud, we
signatures, whereas we use descriptors for complete segments.      apply a region growing algorithm where we mark a point p
   Many of the techniques in our approach come from the            as belonging to a part S if the distance between the point p
vision community. The creation of a vocabulary is based on         and some point in S is closer than δ = 5 cm, and if the angle
the work by Agarwal and Roth [15], and its extension with a        formed by the normal of p and the seed normal of S is less
probabilistic Hough voting approach is taken from Leibe et         than α = 40◦ . Seed points are iteratively selected as points
al. [16]. Voting is also used by Sun et al. [17] to detect         with the lowest curvature that do not belong to any part yet.
objects by relating image patches to depth information. Basing     This ensures that flat parts are identified first and makes the
our approach on geometrical information allows us to have a        identification process more robust. The parts that have less
single 3D CAD model of an example object in the WWW                than 10 points are considered to be too small, and are most
database, since the different views can be generated by the        probably produced in regions with high normal variations or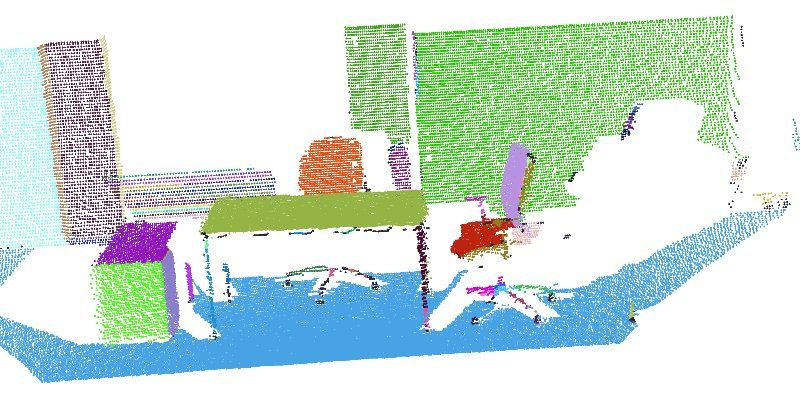
Fig. 2. Left: Example point cloud acquisition and segmentation of a chair.      Fig. 3.    Example word activation and corresponding 2D voting space.
Right: Example shape model for a partial view. Please note that one of the
legs and the extensible beam of the chair were occluded in the scan.

                                                                                2) Average curvature of S computed as the smallest eigen-
by spurious points. Thus we perform a simple distance-based                        value’s proportion to the sum of eigenvalues in the local
region growing to group them together and the resulting parts                      neighborhoods of all points.
that are still too small are discarded. The parameters were                     3) Volume occupied by the voxelized points in S.
selected because they provide good partitions in our setup                      4) We calculate three eigenvalues, e1 , e2 , e3 , of S and
(see Sect. VII). An example segmentation of an object is                           calculate six proportions: e1 /e2 , e2 /e3 , e1 /e3 , e1 /sum,
depicted in Fig. 2, and segmentations of point clouds in indoor                    e2 /sum, e3 /sum, where sum = e1 + e2 + e3 .
environments are shown in Fig. 4.                                               5) We obatin three eigenvectors, e~1 , e~1 , e~1 , of S, project
   Finally, our segmentation method produces parts with only                       the points onto each of them, and calculate three metric
slight curves. As explained in the introduction, the reason is                     variances v1 , v2 , v3 (which we used instead of e1 , e2 , e3 ).
that this kind of surface is very common in furniture objects                   6) Orientation of the eigenvector corresponding to the
in indoor environments. However, cylindrical objects would                         smallest eigenvalue, indicating the orientation of S.
be broken up into parts covering at most 2α degrees, and the                    7) We project the points onto each eigenvector and get the
extracted features account for the curvature of the part.                          distance to the farthest point from the medium in both
                                                                                   directions le1~1 , le2~1 , le1~2 , le2~2 , le1~3 , le2~3 . We then calculate
       IV. T RAINING O BJECTS FROM W EB C ATALOGS                                  the following values: (le1~1 + le2~1 ), (le1~2 + le2~2 ), (le1~3 + le2~3 ),
                                                                                   (le1~1 /le2~1 ), (le1~2 /le2~2 ), (le1~3 /le2~3 ), (le1~1 + le2~1 )/(le1~2 + le2~2 ).
   As explained in the introduction, the goal of this work is to                8) Three proportions between features 5 and 7: v1 /(le1~1 +
develop a system that allows robots to query object databases                      le2~1 ), v2 /(le1~2 + le2~2 ), v3 /(le1~3 + le2~3 ).
in the Web to obtain information about typical objects found                    9) Proportion between the occupied volume (feature 3) and
in indoor environments. In this work we use established                            the volume of the oriented bounding box of the part.
Web databases of objects. In particular, we download CAD
                                                                                Each part S is finally represented by a vector containing 24
models from Google 3D Warehouse [27], Vitra’s Furnish.net
                                                                             features normalized to the range [0,1].
database for office equipment [28], and EasternGraphics’ web
catalogs [29].                                                               B. Words and Shape Models
   To obtain realistic point cloud representations for these                    The resulting set of training feature vectors is clustered
objects, we simulated our laser scanner’s sweeping motion on                 to obtain the words forming the vocabulary of parts. In our
the robot, intersected each beam with the CAD model of the                   approach, we apply k-means, since it has given good results in
object, and added realistic noise to the depth measurements.                 previous works [31], [32]. After applying k-means to the train-
Each obtained scan was additionally segmented using the                      ing feature space, we obtained a clustering C = {C1 , . . . , CV },
algorithm described in Sect. III. An example process for                     which represents our vocabulary of parts. Each cluster Ci is
obtaining training data for a chair is shown in Fig. 2. The                  called a word. An example word is shown in the center of
whole process takes, on average, 4.67s per view on a single                  Fig. 3 representing the back of a chair from different views.
core using a good graphics card.                                                In addition, and following [16], we learn a shape model for
                                                                             each training object view. This model specifies the distance
                   V. VOCABULARY OF PARTS                                    relations among the different parts that compose the object.
   We build a common vocabulary of parts for all the classes                 We extract the center of mass s ∈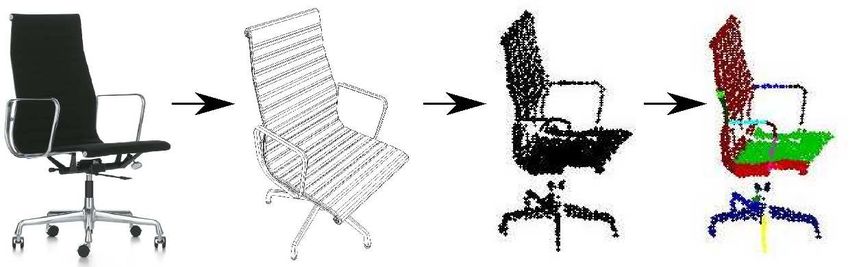
possible locations for objects in the point cloud, ii) a selection    B. Hypotheses Selection
of the best hypotheses is done following a set of criteria, iii)        According to [16], the final score V (o, x) of a hypothesis
model fitting and verification is applied.                            representing an object and its position can be obtained by
A. Hypotheses Generation                                              marginalizing over all the parts found in the scene,
   Given an initial partition P = {S1 , . . . , SM } of a 3D point                          X
cloud representing an indoor environment, we first obtain the                    V (o, x) =     p(o, x | fk , lk )p(fk | lk ) . (6)
                                                                                              k
corresponding feature vector fi for each part Si . Each feature
vector is then matched to a subset of words A ⊂ C from                The first term in this expression is calculated as in (3), and the
the learned vocabulary (activation), which constitute possible        second term p(fk | lk ) is assumed to be a uniform distribution.
interpretations of the part S. Each element of an activated              Following the approach in [16], the different object hypothe-
word casts a vote for a possible object location. This scheme         ses are found as local maxima in the voting space using a
is known as probabilistic Hough voting [16], and an example           search window whose size corresponds to the width of the
is shown in Fig. 3. In this case, a part in the scene activates       particular object class we are looking for. We project the
a word representing backs of chairs. Each element in A casts          votes onto the (x,y)-plane in order to simplify this search
a vote for the center of the chair inside the point cloud.            (see Fig. 3). After obtaining the local maxima, we apply a
   Formally, and following [16], given a feature vector f             threshold to select the best hypotheses. Moreover, hypotheses
representing a part S located at position l in a 3D point cloud,      are checked for inconsistencies in the space. In our case,
the probability of finding an object of class o at position x is      two hypotheses for the same type of object at two different
                         X                                            locations xi and xj are inconsistent if the 2D-convex hulls
        p(o, x | f, l) =     p(o, x | Ai , f, l)p(Ai | f, l).  (2)    of the objects centered at xi and xj overlap. This condition
                          i
                                                                      assumes that all objects are lying on the floor.
The term p(o, x | Ai , f, l) represents the probability of finding
object o at location x given that feature f at position l activated   C. Model Fitting and Verification
the word Ai . The term p(Ai | f, l) indicates the probability            Having detected positions where a certain object type is
that the feature vector f matches the word Ai .                       likely to be found, we verify the detection and select the best
   Based on [16] we make two further assumptions. First, the          model for the object, along with its pose. To be able to do this,
probability of finding an object given an activated word Ai is        we first need to retrieve the most important parts that voted
independent of the feature vector f . Second, the activation of       for the location. Some of these parts are incorrect but their
a word Ai by feature vector f is independent of the location          weights are low.
of the corresponding part S. Thus,                                       Our task is now to select the model and its pose from a 3D
                           X                                          model database that explains most of the detected object parts.
          p(o, x | f, l) =      p(o, x | Ai , l)p(Ai | f ).     (3)
                                                                      We employ a more detailed model database for this, in order
                              i
                                                                      to be able to account for the variations in shapes and sizes
It remains to describe each term in (3). The term p(Ai | f )          of the different objects. To fit these models to our 3D scans
represents the activation of Ai by f . Following [16] we do           robustly and efficiently, we transform them to noiseless point
not activate just one vocabulary word, but several of them.           clouds by filling the outer triangle faces with points, and use a
Each activation is assigned a probability indicating how well         RANSAC-based algorithm to select the best pose and the best
the feature vector f matches the codebook entry Ai as                 model for each detected object. Since we take the complete
                                w(f, Ai )                             model into account at once instead of each view separately,
                  p(Ai | f ) = P                               (4)    we can reduce the number of trials considerably and we do
                                j w(f, Aj )                           not require the point cloud to come from a single scan. This
where w(f, Ai ) is a distance function proportional to the            can become important later, as detailed in Sect. VII-C. The
inverse of the Euclidean distance between vector f and the            search time is further reduced by assuming that objects are
mean vector of cluster Ai .                                           upright, thus only the location in 2D and the rotation around
   The term p(o, x | Ai , l) represents the probability of finding    the up axis is required to be found.
object o at position x given the activated word Ai at location           In a regular RANSAC algorithm, one can estimate the
l. Once a word is activated, each of its elements a casts a vote      number of required iterations T to find the best model with
to the position xv = l + d.  ~ Here l is the position of the part     probability psuccess as
S found in the point cloud, and d~ is the relation vector of the
                                                                                                               log(1 − psuccess )
element’s shape model (see Sect. V-B). Finally the probability         1 − psuccess = (1 − pgood )T ⇒ T =                         . (7)
p(o, x | Ai , l) is given by                                                                                    log(1 − pgood )
                                   1                                 The value of pgood = wn is the probability of randomly
                                 #(Ai ,o)  if x = xv ;
          p(o, x | Ai , l) =                                   (5)    selecting the best model, and can be estimated after each fit
                                0.0        otherwise,
                                                                      (that is better than the best one found so far) as the probability
where #(Ai , o) indicates the number of elements a in word            w of selecting a good sample to the power of the number of
Ai that pertain to object o.                                          samples n. As the algorithm finds models that are increasingly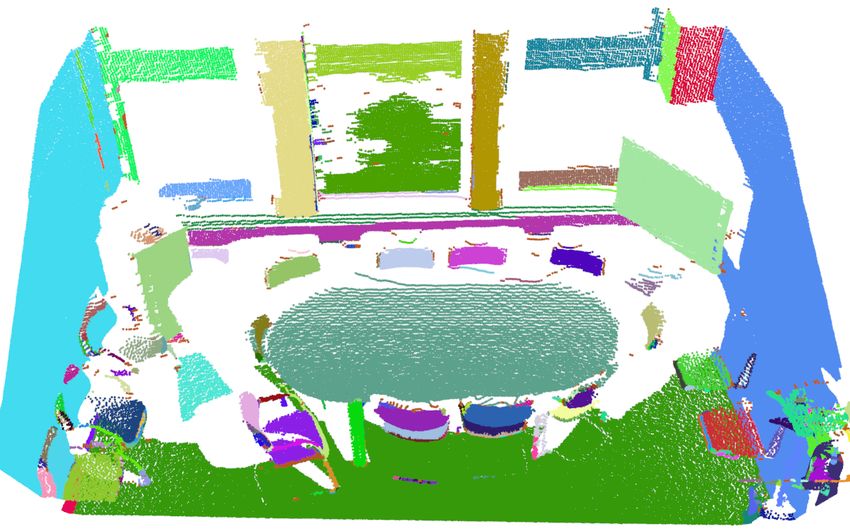
better, the value of w can be updated as #inliers/#points,             Finally, when the scan point has a normal vector which
resulting in a decrease in the number of iterations needed.         is close to being parallel to the upright axis, the rotation of
Thus the number of iterations adapts to the estimated number        the model can not be accurately estimated. In these cases, we
of matches, starting at infinity when no inliers are known and      use a random rotation and since we check a high percentage
decreasing to a number that ensures that the chance of finding      of points, the models are correctly identified. Tables are
a better model than the current one drops below 1 − psuccess .      especially affected by this, and we see larger fitting errors
    As the runtime depends on the number of samples, it is          in finding them but the best models get identified correctly
advisable to keep it as low as possible. If we were to pick both    and a subsequent fine registration using ICP [34] or one of its
the model and the scan points at random, we would have had          many variants can be used to correct the pose.
to use pgood = (#correct matches/#possible matches)2 a                                   VII. E XPERIMENTS
very small number that is also hard to estimate. However, if we
assume that by selecting a random point from the scan, we can          The goal of the experiments is to demonstrate that a robot
find the corresponding model point. This simplifies the equa-       can learn models for 3D office objects found on the Web, and
tion to pgood = #covered scan points/#all scan points.              using these models, is able to locate and categorize pieces of
The number of covered scan points can be found by nearest           furniture in 3D point clouds representing indoor environments.
neighbor searches with a maximum distance in a search tree.            To carry out the experiments, we first downloaded the CAD
                                                                    models of a chair, a table and a sideboard (colored as blue,
    We found that selecting the corresponding model point
                                                                    red and yellow in Fig. 1). These objects were obtained from
to a scan point can be done by iterating over the possible
                                                                    different Web catalogs. Following the procedure of Sect. IV,
matches (points at similar height), and selecting the one that
                                                                    we placed the objects in front of the simulated laser and
would result in a transformation that covers most scan points.
                                                                    rotated them around the up axis, obtaining 16 scans of each
Significant speedups can be achieved by selecting only a
                                                                    object which were segmented using our algorithm. A final
subset of the possible correspondences and scan points. Our
                                                                    common vocabulary of parts was created with k = 40.
experiments provided good results with around 50% of the
                                                                    These values provide a good balance between performance
points checked. Additionally, by keeping track of the best
                                                                    and computational costs (see Fig. 6).
score found, subsequent searches can be stopped early if it
                                                                       To obtain point clouds from real scenes, we used a Hokuyo
becomes clear that they can not produce better scores. The
                                                                    laser mounted on a pan tilt on a robot approximately 1.5m
same principle can be applied over multiple models as well.
                                                                    above the floor (see Fig. 1). Service robots working in human
    Using these techniques, we were able to identify the best
                                                                    environments typically have their 3D sensor at that height such
pose of the good model in around 15s on a standard dual-
                                                                    that its perspective is similar to that of a person. Both of
core laptop, without parallelization or other optimizations. Our
                                                                    the robots we used had such a setup, and since they both
models contain between 5000-15000 points, while the iden-
                                                                    ran ROS (www.ros.org), changing the robot was transparent
tified object parts around 2500. For non-optimally matching
                                                                    to our algorithm. However, different robots or sensors at
models, the verification takes around 60s, while non-matching
                                                                    different heights can be used if the scanning of the training
models are rejected in under a second. After each object model
                                                                    data is adapted accordingly. Finally, the point clouds were
from the identified category is fitted to the object parts, we
                                                                    segmented using the same algorithm as for the training data.
select the one that explains the most model points.
                                                                    Each obtained part activated the best two vocabulary entries.
    Before this model and its pose can be used for various
applications, it first needs to be checked in order to filter out   A. Recognition of Objects in Real Environments
false positives. We first check if the model covers less than          The first experiment was carried out in an office of our
50% of the points of the parts, and reject such detections (e.g.    floor at TUM. The corresponding segmented 3D point cloud
the chair in column two of Fig. 8). The threshold of 50% is tied    is shown in Fig. 4. This office contained two tables, different
to how well the CAD models and the real objects match. The          armchairs and a sideboard. We would like to point out that the
real chair and the best fitting model are not identical; however,   objects located in the office were similar to but not the same
all CAD models we used cover much more than 50% of the              as the 3D models we downloaded from the Web. In particular,
points if a good match is found.                                    the table in the middle of the chairs was round and we did
    We then check if the identified pose contradicts the mea-       not have any round table in our training set, and the chairs
surements, i.e. if it has faces that should have been visible       around the table were different from the training models. This
while scanning, but the laser returned points behind them.          setting aimed to demonstrate that our approach is well-suited
This can be done efficiently by building one occupancy grid         for detecting categories of objects instead of concrete instances
per scan, in which each voxel is labeled as free, occupied or       only.
unknown [33]. We reject models that have large parts in free           We set the thresholds for the final hypotheses to 1.0 for
space, e.g. the sideboard in the first column of Fig. 8. Such       tables, 0.6 for chairs, and 1.4 for sideboards. These values
a grid is needed for the operation of the robot for tasks like      were selected as desired working points in classification per-
collision avoidance and path planning. Thus it is natural to use    formance plots (Fig. 5). The result of applying our detector is
it for the verification of model fittings attempts, as we did in    shown in Fig 4. The two tables were correctly detected and the
our experiments involving smaller objects as well [20].             system was able to detect 5 chairs out of 7, although including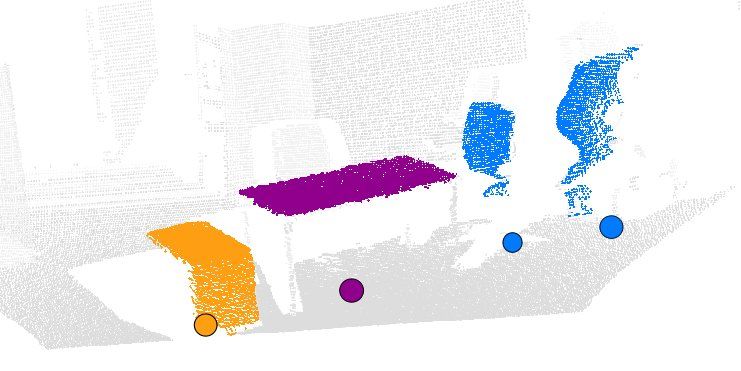
(a) Segmented scan                         (b) Detected object parts                               (c) Segmented scan                              (d) Detected object parts

                     (e) Ground truth                                  (f) Detected centers                                (g) Ground truth                              (h) Detected centers
                                                                                        Table           Chair                  Sideboard

Fig. 4. The segmented scans of an office and a seminar room are depicted in (a) and (c) respectively. The detections of the objects’ parts for the office are
shown in (b), and for the seminar in (d). In (e) and (g) we can see the ground truth of the positions for the objects’ centers in the office and seminar room
(bird’s eye view). The detected centers obtained by our method are shown in (f) and (h), where bigger circles indicate a bigger weight. Best viewed in color.

           1                                                  1                          Vo                           1                                                  1
                                                                                         Re
          0.8                                                0.8                        NN.                          0.8                                               0.8
 Recall

                                                    Recall

                                                                                                            Recall

                                                                                                                                                              Recall
          0.6                                                0.6                                                     0.6                                               0.6

          0.4                                                0.4                                                     0.4                       20                      0.4
                                                                                                                                               40                                               16
                                     Vo                                                                                                        80                                               32
          0.2                        Re                      0.2                                                     0.2                      120                      0.2                      40
                                    NN.                                                                                                       150                                               80
           0                                                  0                                                       0                                                  0
                0     0.2    0.4    0.6   0.8   1                  0      0.2    0.4    0.6   0.8   1                      0    0.2    0.4    0.6   0.8   1                  0   0.2    0.4    0.6   0.8   1
                            1-Precision                                         1-Precision                                           1-Precision                                      1-Precision

Fig. 5. Classification results for the office (left) and seminar (right) using                            Fig. 6. Left: Classification performance using different number clusters k and
our approach (Vo), nearest neighbor (NN), and a reduced set of features (Re).                             a fixed number of 16 views. Right: Classification performance using different
More details are given in the main text. Best viewed in color.                                            number of views and fixed number of clusters k=40. Best viewed in color.

                                                                                                          scans of the seminar obtained from different viewpoints. The
one false positive. An additional experiment was carried out
                                                                                                          resulting plots are shown in Fig. 5. In each plot we additionally
in a seminar room containing a big table and 15 chairs around
                                                                                                          compare our approach based on a vocabulary of parts (Vo) with
it. The resulting classifications are also shown in Fig. 4.
                                                                                                          two simplified versions: a version in which only the nearest
    Data acquisition using our laser takes 10 s. Smoothing,                                               neighboring part in the training data is used for voting (NN);
segmenting and extracting the features takes another 7.12                                                 and a version with a reduced number of features (ignoring
s on average using C++ code on a single core. The time                                                    features 4, 7 and 8) (Re). This last version aims to show the
needed to select the final hypotheses for an object center                                                importance of all the features in the final classification. In both
mainly depends upon the total number of parts in the scene                                                scenes our approach outperforms the simplified ones.
and the number of clusters in the vocabulary (since each of                                                  We also analyzed the influence of the vocabulary size in the
the parts should activate the closest clusters). It also depends                                          classification performance. Results are shown in the left image
on the number of final selected hypotheses because they are                                               of Fig. 6. Finally, in the right image of Fig. 6 we analyzed
checked for inconsistencies (see Sect. VI-B). Using our current                                           the performance of the classifier when increasing the number
configuration, and without any optimization, our approach                                                 of training views. Interestingly, using 16 views for training
took 0.20 s for the office, and 0.24 s for the seminar using                                              gives slightly better results than using more. This could
Matlab on an Intel Core i5.                                                                               be because the segmentation and features produce similar
    To quantitatively evaluate the performance of our approach,                                           patches. Improving the feature extraction is on our agenda,
we generated recall vs (1-precision) plots for the two previous                                           thus exploiting our classification to the fullest. However, the
scenes. Different false positive values were obtained by in-                                              results are quite similar for the different parameters.
creasing the threshold for the final hypotheses selection. A true
positive is obtained when the distance between the detected                                               B. Model Fitting and Verification
center and the original center is less than half of the width of                                             In this section we present results on applying model fitting
the object. The test set included two scans of the office and two                                         for the final verification of the detected objects. In the first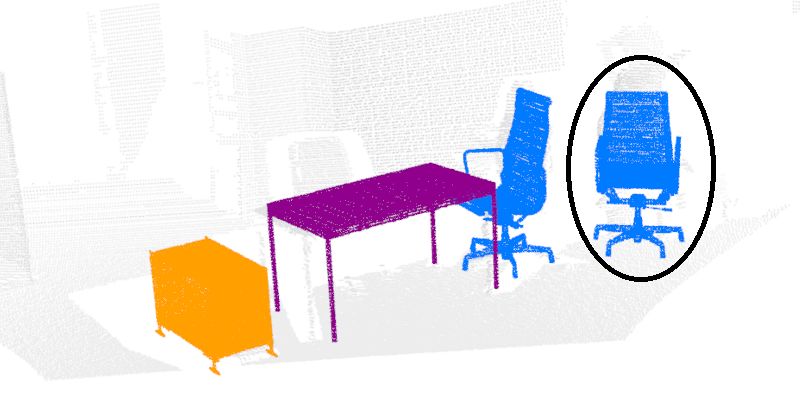
experiment we used the classification results obtained in the
previous section for the office and seminar environments. The
classification outputs consist of the center of the detected
objects together with the parts that contributed to its detection
(see Fig. 4). Using these outputs we fitted the best original
CAD model for each final hypothesis using the correspond-
ing retrieved parts and verifying the fitting as described in
Sect. VI-C. The results are shown in Fig. 7.

           Fig. 7.   Model fitting in the scenes from Fig. 4.

                                                                        Fig. 8.    Two examples of the whole process (see legend in Fig. 4).
   The poses are good for most of the objects and a subsequent
ICP step would improve them further. However, here we focus
on the possibility of using it to reject false positives. The two
false positives in the right side of the seminar room were
indeed removed, but the four chairs in the walls of the office
and seminar room could not be filtered, as they covered the
parts (which were quite small) well and were in occluded
space. These could be filtered for example by having a 2D
floor map available, as they are outside the boundaries of the
rooms. False positive rejection is also shown in Fig. 8.
   There were four occasions where the fitted models were
incorrect. One chair in the office and one in the seminar room
are oriented backwards because their seats were occluded and        Fig. 9. The two scenes from Fig. 8 are shown in a common coordinate system,
the best matching CAD model that was available fits the data        along with the detected object centers after merging the corresponding voting
best when it is rotated in the wrong direction. Because of the      spaces (see legend in Fig. 4 for center colors).
large occlusions, these orientations could not be filtered. Two
other chairs in the left part of the scans had very small parts
(31 and 32 points), rendering correct matching impossible. In                     VIII. C ONCLUSIONS AND F UTURE W ORK
the office the bad orientation was preserved due to the high
                                                                       In this paper, we have presented an approach that allows a
occlusion, but in the seminar room it was rejected.
                                                                    robot to learn models of office objects downloaded from the
C. Recognition Using Multiple Views                                 Web and to use them to detect and localize instances of these
   In the following experiment we showed how to take ad-            types of objects in new scenes represented by 3D point clouds.
vantage of multiple views of the same scene to alternatively           We believe that our method is a step in the right direction –
improve the final detection of objects. We used the two scenes      a step towards using a WWW for robots in a scalable way. In
of Fig. 8 and applied the voting approach on each of the            addition, the set of possible models can be limited in multiple
scenes as in the previous experiment. We then translated the        ways, even obtaining a list of furniture pieces for a given
resulting voting spaces into a common coordinate system.            environment is conceivable. Our next steps will be to extend
This process is equivalent to the alignment of the two scenes       the method for more object types, and to take advantage of the
and the simultaneous voting in both of them. As shown               possibility of multiple segmentations per scan to increase the
in Fig. 9, after merging both voting spaces the system is           accuracy. Applying this approach to smaller objects with six
able to reject both false positives detections: the sideboard       degrees of freedom is possible, as the parts can be learned in a
sharing place with the chair in the first scene; and the shadow     rotationally invariant manner. However, the effectiveness of the
of the man in the second scene (see previous experiment).           probabilistic voting in 3D and the computational complexity
The improvement in the recognition is a consequence of              of precise model fitting remains to be tested.
the simultaneous accumulation of evidence from both views.             Nowadays, typical indoor objects like chairs, tables or
Correct detected objects received a much higher weight since        sideboards are found all over the world and globalization
they are detected twice, whereas false positives objects get        makes it likely to find the same objects in different places.
evidence from only one view.                                        The ultimate goal would be to enable a robot to download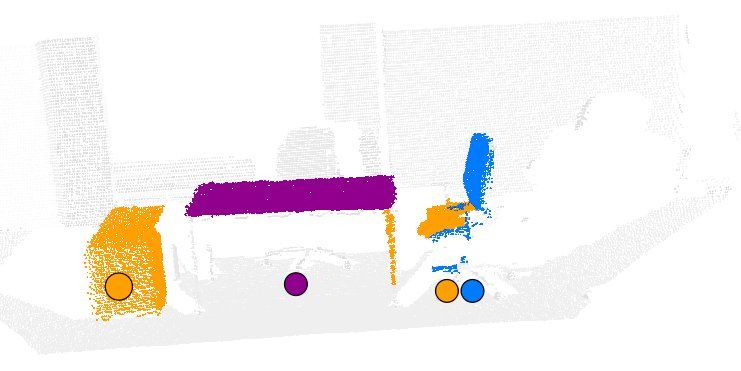
3D models of objects from the WWW and to learn general                           [9] A. Frome, D. Huber, R. Kolluri, T. Bulow, and J. Malik, “Recognizing
representations of them in order to be able to recognize similar                     objects in range data using regional point descriptors,” in Europ. Conf.
                                                                                     on Computer Vision, 2004.
objects in a new environment somewhere else in the world.                       [10] Z. Wu, Y. Wang, and G. Pan, “3D face recognition using local shape
Taking the idea one step further, robots could also map their                        map,” in IEEE Int. Conf. on Image Processing, 2004.
environments, and the point clouds corresponding to high-                       [11] A. Nüchter, K. Lingemann, J. Hertzberg, and H. Surmann, “Accurate
                                                                                     object localization in 3D laser range scans,” in Int. Conf. on Advanced
scoring detections could be used for training and verification or                    Robotics, USA, 2005, pp. 665–672.
could even be shared with other robots, thus enriching existing                 [12] K. Klasing, “Aspects of 3D perception, abstraction, and interpretation in
databases by distributed world modeling.                                             autonomous mobile robotics,” Ph.D. dissertation, Technische Universität
                                                                                     München, 2010.
   What is needed, however, is the initial set of training                      [13] D. Huber, A. Kapuria, R. R. Donamukkala, and M. Hebert, “Parts-
examples, in an easily accessible way. As previously pointed                         based 3D object classication,” in Conf. on Computer Vision and Pattern
out by other authors [25], one of the main problems when                             Recognition, 2004.
                                                                                [14] S. Ruiz-Correa, L. G. Shapiro, and M. Meila, “A new paradigm for
working with 3D point clouds is the availability of labeled                          recognizing 3-D object shapes from range data,” in Int. Conf. on
training data. Model representation needs to be enriched as                          Computer Vision, 2003.
well, to account for different measurement units and orienta-                   [15] S. Agarwal and D. Roth, “Learning a sparse representation for object
                                                                                     detection,” in Europ. Conference on Computer Vision, 2002.
tions. Not to mention the problems arising from different data                  [16] B. Leibe, A. Leonardis, and B. Schiele, “Robust object detection with
formats. Fortunately, there are efforts to solve these issues, and                   interleaved categorization and segmentation,” International journal of
additional data can be obtained by shape morphing – e.g. using                       computer vision, vol. 77, no. 1-3, pp. 259–289, 2008.
                                                                                [17] M. Sun, B. Xu, G. Bradski, and S. Savarese, “Depth-encoded hough vot-
techniques such as the one from Hillenbrand [35].                                    ing for joint object detection and shape recovery,” in Europ. Conference
   In conclusion, by taking advantage of the explosion in the                        on Computer Vision, 2010.
                                                                                [18] Z. C. Marton, R. B. Rusu, D. Jain, U. Klank, and M. Beetz, “Probabilis-
number of WWW resources that is driven by industry, we can                           tic Categorization of Kitchen Objects in Table Settings with a Composite
avoid instrumentation to a large degree and allow robots to act                      Sensor,” in Proceedings of the IEEE/RSJ Int. Conf. on Intelligent Robots
successfully in unknown environments.                                                and Systems, USA, October 11-15 2009.
                                                                                [19] R. Schnabel, R. Wahl, and R. Klein, “Efficient RANSAC for Point-
                                                                                     Cloud Shape Detection,” Computer Graphics Forum, vol. 26, no. 2, pp.
                        ACKNOWLEDGMENTS                                              214–226, June 2007.
                                                                                [20] Z.-C. Marton, D. Pangercic, N. Blodow, J. Kleinehellefort, and M. Beetz,
   This work was supported by the DFG excellence initiative                          “General 3D Modelling of Novel Objects from a Single View,” in
research cluster CoTeSys, by Grants-in-Aid for JSPS Fellows                          IEEE/RSJ Int. Conf. on Intelligent Robots and Systems, Taiwan, 2010.
                                                                                [21] A. S. Mian, M. Bennamoun, and R. A. Owens, “Matching tensors
number 22-00362, and by the PR2 Beta Program of Willow                               for automatic correspondence and registration,” in Europ. Conf. on
Garage, Menlo Park, CA. Zoltan Csaba Marton gratefully                               Computer Vision, 2004.
acknowledges the support of the TUM Graduate Schools                            [22] R. B. Rusu, N. Blodow, and M. Beetz, “Fast point feature histograms
                                                                                     (fpfh) for 3d registration,” in IEEE Int. Conf. on Robotics and Automa-
Thematic Graduate Center Cognition for Technical Systems                             tion, Japan, 2009.
at the Technische Universität München. We would also like to                  [23] H.-P. Chiu, L. Kaelbling, and T. Lozano-Perez, “Virtual training for
thank our colleague Dejan Pangercic for his valuable support,                        multi-view object class regnition,” in IEEE Comp. Soc. Conf. on Com-
                                                                                     puter Vision and Pattern Recognition, 2007.
and Vitra Furnishnet for granting us access to their model                      [24] A. Toshev, A. Makadia, and K. Daniilidis, “Shape-based object recog-
database.                                                                            nition in videos using 3d synthetic object models,” in IEEE Comp. Soc.
                                                                                     Conf. on Computer Vision and Pattern Recognition, 2009.
                                                                                [25] K. Lai and D. Fox, “3D laser scan classification using web data and
                             R EFERENCES                                             domain adaptation,” in Robotics: Science and Systems, USA, 2009.
                                                                                [26] Z. C. Marton, R. B. Rusu, and M. Beetz, “On Fast Surface Recon-
 [1] R. B. Rusu, Z. C. Marton, N. Blodow, A. Holzbach, and M. Beetz,                 struction Methods for Large and Noisy Datasets,” in IEEE Int. Conf. on
     “Model-based and Learned Semantic Object Labeling in 3D Point Cloud             Robotics and Automation, 2009.
     Maps of Kitchen Environments,” in IEEE/RSJ Int. Conf. on Intelligent       [27] Google 3D Warehouse. [Online]. Available: http://sketchup.google.com/
     Robots and Systems, USA, 2009.                                                  3dwarehouse/
 [2] D. Kragic and M. Vincze, “Vision for robotics,” Found. Trends Robot,       [28] Vitra Furnishnet. [Online]. Available: http://www.vitra.com
     vol. 1, no. 1, pp. 1–78, 2009.                                             [29] EasternGraphics. [Online]. Available: http://portal.pcon-catalog.com
 [3] A. Johnson, “Spin-images: A representation for 3-D surface matching,”      [30] R. B. Rusu, Z. C. Marton, N. Blodow, M. Dolha, and M. Beetz, “Towards
     Ph.D. dissertation, Carnegie Mellon University, USA, 1997.                      3D Point Cloud Based Object Maps for Household Environments,”
 [4] R. Triebel, R. Schmidt, O. M. Mozos, and W. Burgard, “Instace-based             Robotics and Autonomous Systems, vol. 56, no. 11, pp. 927–941, 2008.
     AMN classification for improved object recognition in 2D and 3D laser      [31] G. Csurka, C. R. Dance, L. Fan, J. Willamowski, and C. Bray, “Visual
     range data,” in Int. Joint Conference on Artificial Intelligence, India,        categorization with bags of keypoints,” in ECCV Workshop on Statistical
     2007, pp. 2225–2230.                                                            Learning in Computer Vision, 2004.
 [5] P. A. de Alarcon, A. D. Pascual-Montano, and J. M. Carazo, “Spin           [32] A. Coates, H. Lee, and A. Y. Ng., “An analysis of single-layer networks
     images and neural networks for efficient content-based retrieval in 3D          in unsupervised feature learning,” in NIPS Workshop on Deep Learning
     object databases,” in Int. Conf. on Image and Video Retrieval, 2002.            and Unsupervised Feature Learning, 2010.
 [6] B. Steder, R. B. Rusu, K. Konolige, and W. Burgard, “NARF: 3D range        [33] N. Blodow, R. B. Rusu, Z. C. Marton, and M. Beetz, “Partial View
     image features for object recognition,” in IROS Workshop on Defining            Modeling and Validation in 3D Laser Scans for Grasping,” in IEEE-
     and Solving Realistic Perception Problems in Personal Robotics, 2010.           RAS Int. Conf. on Humanoid Robots, France, 2009.
 [7] D. Anguelov, B. Taskar, V. Chatalbashev, D. Koller, D. Gupta, G. Heitz,    [34] P. J. Besl and N. D. McKay, “A method for registration of 3-D shapes,”
     and A. Ng, “Discriminative learning of markov random elds for seg-              IEEE Transactions on Pattern Analysis and Machine Intelligence,
     mentation of 3D scan data,” in Conf. on Computer Vision and Pattern             vol. 14, no. 2, pp. 239–256, February 1992.
     Recognition, 2005.                                                         [35] U. Hillenbrand, “Non-parametric 3D shape warping,” in Proc. Int. Conf.
 [8] R. Triebel, K. Kersting, and W. Burgard, “Robust 3D scan point clas-            on Pattern Recognition, 2010.
     sification using associative markov networks,” in Int. Conf. on Robotics
     and Automation, 2006.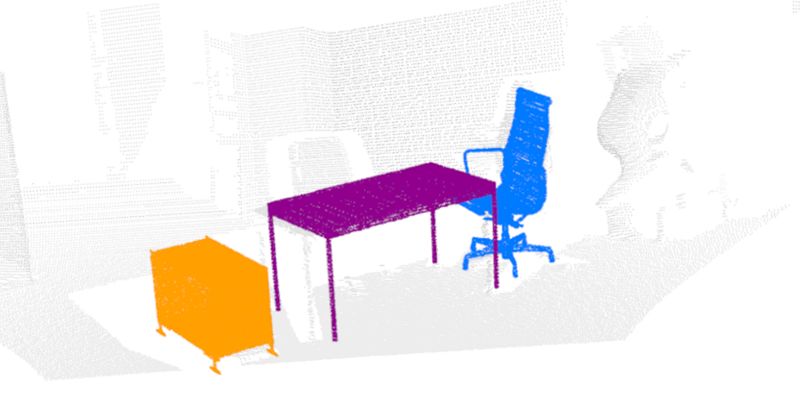
You can also read