Future climate projections for Tasmanian IBRA regions A report to the Independent Verification Group for the Tasmanian Forest Agreement
←
→
Page content transcription
If your browser does not render page correctly, please read the page content below
IVG Forest Conservation Report 6

    Future climate projections for Tasmanian IBRA regions

     A report to the Independent Verification Group for the
                  Tasmanian Forest Agreement

Produced by M. Grose, R.Harris and G.Lee, ACE CRC, Jan 2012, using material from the set of
             Technical reports of the Climate Futures for Tasmania project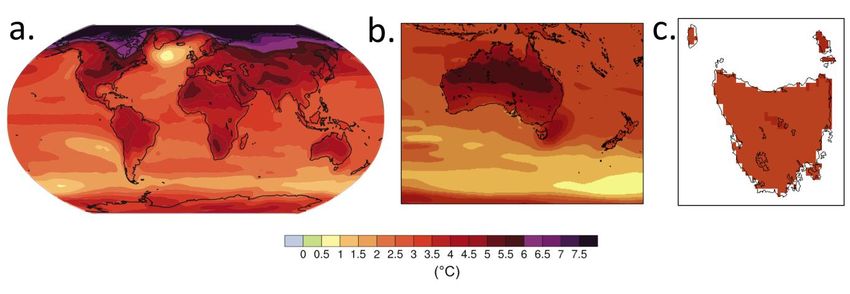
IVG FC Report 6                                                                                Future climate projections

Future climate projections for Tasmanian IBRA regions
The Climate Futures for Tasmania (CFT) project generated climate projections specific to Tasmania to the year
2100 using the most recent climate modelling techniques available. Fine-scale climate modelling was achieved
using CSIRO’s Conformal Cubic Atmospheric Model (CCAM) to dynamically downscale outputs from the
most recent set of global climate model (GCM) simulations. Downscaling retains the projection of global
change indicated by the GCMs, and adds relevant detail at the regional scale, making the outputs appropriate
for distinguishing different regions of Tasmania. A full account of the modelling strategy and methods used are
presented in the CFT modelling technical report (Corney et al 2011).

Fine-scale model projections of Tasmanian climate were made for two hypothetical but plausible scenarios of
human emissions for the 21st Century (taken from the special report on emissions scenarios (SRES) from the
Intergovernmental Panel on Climate Change (IPCC)). The scenarios are of ongoing high emissions, A2, and
one where emissions plateau and fall, B1. The climate response under the two scenarios is similar through the
first half of the century, but the changes under the higher emissions scenario become much stronger than the
lower scenario in the latter half of the 21st Century. The last decades of the century show a rapidly rising
temperature under the high emissions scenario, but a levelling off under the low emissions scenario.

The CFT project produced multi-model ensemble simulations based on downscaling of six GCMs which were
reported on in the IPCC Fourth Assessment Report (CSIRO-Mk3.5, GFDL-CM2.0, GFDL-CM2.1, ECHAM5/
MPI-OM, UKMO-HadCM3 and MIROC3.2 (medres)). The six models were chosen for their performance over
the Australian region. The focus in this report will be on the results of the ensemble of all the models rather
than any one particular simulation, because multi-model ensemble simulations generally provide more robust
information than simulations from any single model (Meehl et al 2007). Corney et al 2011 provide a full
discussion of the uncertainties associated with modelling climate projections.

The Climate of Tasmania

Tasmania has a temperate maritime climate where temperature is moderated by the surrounding seas. There is
an average daily temperature range of approximately 7°C at the coast, increasing to around 14°C inland.
The seasonal temperature range is relatively small, with mean maximum temperatures of 18°C to 23°C in
summer and 9°C to 14°C in winter (Bureau of Meteorology 1993).

Tasmania is mountainous in the west, central and north-east regions, affecting the flow of air over land and
maintaining three distinct rainfall zones, of roughly equal size, in the east, west and north. Mean annual
rainfall varies from less than 600 mm in the central midlands to more than 3000 mm near the west coast. There
is a steep gradient in total annual rainfall from the western region across the eastern central plateau, resulting in
a rain shadow region over the central midlands, east coast and south east regions. The midlands receives the
lowest rainfall of any region in Tasmania. The west coast has a distinct seasonal cycle with the highest rainfalls
in winter and early spring. There is a smaller but still distinct annual cycle in rainfall in the north, with the peak
of the rainfall cycle occurring through autumn to winter. There is no distinct annual cycle in the eastern zone,
with approximately 50 mm to 70 mm falling each month of the year.

                                                                                                                            1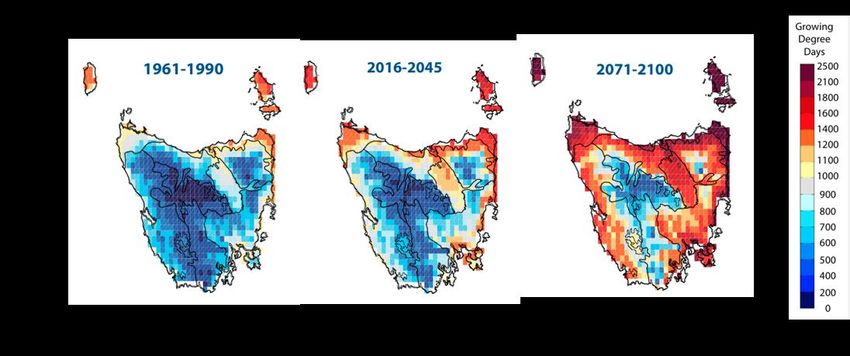
IVG FC Report 6 Future climate projections
Interim Biogeographic Regionalisation for Australia (IBRA regions)
The Bureau of Meteorology divides Tasmania into seven forecast districts representing distinct climate zones.
The IBRA regions broadly align with these climate zones, but with greater boundary detail and the addition of
the Southern Ranges and Northern Slopes regions, and the separation of the coastal strip of the Flinders Region
on the north-east Tasmanian coast.
There is considerable variability both within and between the 9 IBRA regions in Tasmania in terms of current
and projected future climate conditions. Following an overview of the broad changes projected for Tasmania,
we provide a summary by IBRA region. The short descriptions of the Tasmanian bioregions were derived from
unpublished information provided by the Department of Primary Industries, Parks, Water & Environment. We
report on mean values of six model simulations, as a ‘central estimate’ of changes within each region. A box
plot is provided to summarize the projections for rainfall for current (1961-1990) and future (2070-2099) time
periods for each region. In these figures the box indicates the interquartile range, the bar provides the median,
the whiskers extend up to 1.5 times the interquartile range and outliers are shown explicitly. These graphs
provide an indication of the variability between the models.
Climate Projections for Tasmania (from CFT project)
a) Temperature
Tasmanian temperatures have risen at an average rate of 0.1°C per decade since the 1950’s (Figure 1).
This is a lower rate than for mainland Australia (0.16°C), and the global average (~0.17°C). Under the
higher emissions scenario (A2), Tasmania is projected to experience a rise in average temperatures of
2.6 to 3.3°C over the entire 21st Century (Figure 1). This change is also less than for mainland Australia
and the global average (Figure 2). The rise in daily minimum temperature is expected to be slightly
greater than daily maximum temperature. Temperature change is projected to be fairly uniform
between the IBRA regions within Tasmania, and fairly similar in the different seasons (Table 1). Under
the lower emissions scenario (B1), the projected change over the entire century is 1.3 to 2.0°C
Rises in mean temperature are projected to be similar in all of the IBRA regions. Daily minimum
temperatures are projected to rise slightly more than daily maximum temperatures
Figure 1. Tasmanian average temperature in observations (black) and model projections for the A2 scenario (red) and the
B1 scenario (blue), all series are smoothed (11-year running average), shading shows the range of model projections.
Changes under the higher scenario by the very end of the century (box) are discussed in the examples below
2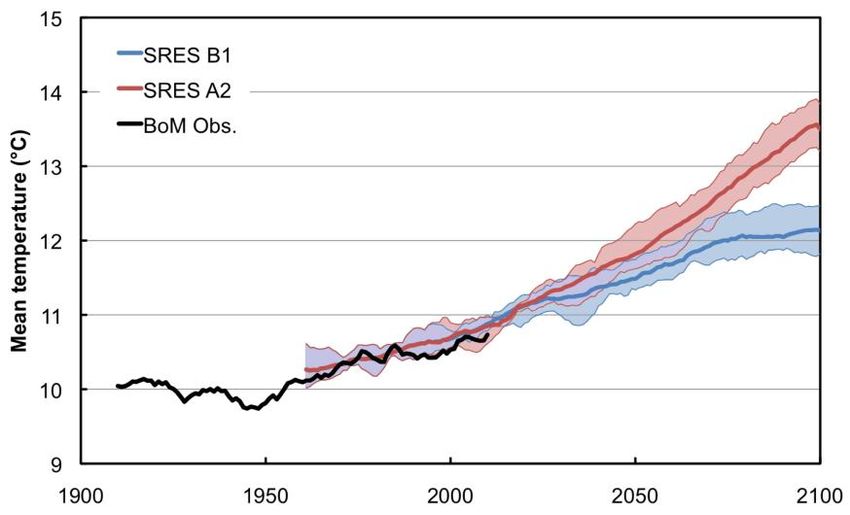
IVG FC Report 6 Future climate projections
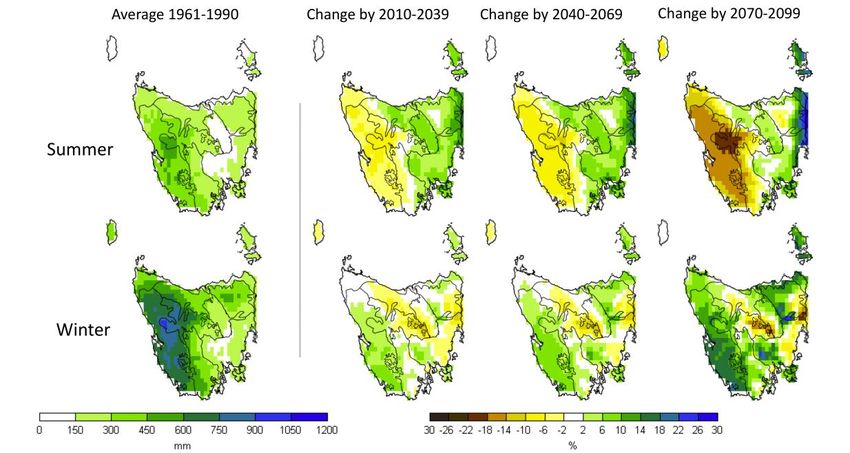
Figure 2. Projected difference in mean temperature between 1980-1999 and 2090-2099, a) the mean of 23 GCMs for the
globe (adapted from IPCC 2007), b) for the Australian region, mean of six 0.5 ° resoluton models, CFT project, c) for the
Tasmanian land area, mean of six 0.1 ° models, CFT project
Table 1. Projected change in mean temperature (°C ) in the Tasmanian IBRA regions between 1961-1990 to 2070-2099
under the A2 emissions scenario, multi-model mean of six models made in the CFT project *Note different time period to
above
Region Code J F M A M J J A S O N D
Ben Lomond BEL 2.8 2.8 2.9 2.8 2.8 2.6 2.4 2.4 2.3 2.6 3.0 2.9
Tas. Northern TNM 3.0 2.8 2.8 2.7 2.7 2.5 2.4 2.4 2.3 2.5 2.9 3.0
Midlands
Tas. South East TSE 2.7 2.6 2.6 2.5 2.7 2.6 2.5 2.5 2.4 2.6 2.8 2.7
Tas. West TWE 2.7 2.7 2.6 2.4 2.5 2.4 2.3 2.2 2.0 2.2 2.5 2.5
Tas. Southern TSR 2.7 2.6 2.5 2.4 2.6 2.5 2.4 2.3 2.2 2.4 2.6 2.6
Ranges
Tas. Central TCH 3.1 2.9 2.8 2.7 2.7 2.5 2.4 2.3 2.2 2.5 3.0 3.0
Highlands
Tas. Northern Slopes TNS 3.0 2.9 2.9 2.7 2.6 2.4 2.3 2.2 2.1 2.3 2.8 2.8
King KIN 2.7 2.8 2.7 2.5 2.4 2.3 2.1 2.1 2.0 2.1 2.5 2.5
Flinders FLI 3.0 3.0 3.1 2.9 2.8 2.7 2.5 2.5 2.4 2.6 2.9 2.9
3IVG FC Report 6 Future climate projections
b) Rainfall
The model projections indicate that the general long-term influence of climate warming by the end of
the century is for mean annual rainfall across Tasmania to remain within the historical range of 1390 ±
200 mm, but with significant changes in the spatial and seasonal patterns of rainfall across the state
There is projected to be increased annual rainfall over the coastal regions and reduced annual rainfall
over central and northwest Tasmania
The changes in seasonal rainfall are much greater than for annual total rainfall. The west coast of
Tasmania shows a steadily emerging pattern of increased rainfall in winter and decreased rainfall in
summer (changes under A2 scenario is shown in Figure 3). The central plateau district shows a steady
decrease in rainfall in every season throughout the 21st century. A narrow strip along the northern east
coast shows a steady increase in autumn and summer rainfall (Figure 3)
The projected pattern of change to rainfall and runoff is similar in nature between the B1 and A2
scenarios, but stronger by the end of the century under the A2 scenario
There is a tendency for heavier rainfalls interspersed by longer dry periods, and for greater extremes,
but this varies in different areas
The long-term effect of greenhouse warming is on top of the usual cycles of rainfall, including
droughts, termed ‘natural variability’. The model projections indicate that the recent dry conditions of
the ‘big dry’ drought is not a new ongoing climate average state
Figure 3. Average rainfall in summer and winter – the left hand side plots show the average rainfall in the baseline
period (1961-1990), the plots to the right show the proportional change (%) from that amount in various periods in the
st
21 century in the average of six climate model projections under the A2 (higher) emissions scenario. Lines show the
boundaries of the IBRA regions.
4IVG FC Report 6 Future climate projections
c) Cloud, Radiation, Relative humidity and Evaporation
Total cloud cover over Tasmania is projected to decrease slightly (< 5%) by the end of the century
under the A2 scenario, with a spatially complex pattern of change. The response is different in each
season, with the greatest reduction in cloud cover over the west coast in summer. These changes lead to
corresponding changes in radiation, including an increase in radiation in the west in summer
Annual average relative humidity under the A2 emissions scenario is projected to increase slightly over
much of Tasmania (0.5 to 1.5%), except for the Central Highland region where a slight decrease is
projected. There is a different spatial pattern of change in summer compared to winter
Pan evaporation is projected to increase across Tasmania, by up to 19% under the A2 scenario by the
end of the century, driven by the increases in temperature but also changes to relative humidity, wind
speeds, cloudiness and radiation
Actual evapotranspiration from the land surface given the modelled water availability is also projected
to increase through the century. The increase is greatest over a strip along some coasts. This increase is
proportionally greater in winter than in summer when there is more water to evaporate. There is a slight
decrease in evapotranspiration near the west coast in summer where evapotranspiration becomes more
water-limited
d) Runoff and River Flows
Changes to rainfall and evaporation lead to changes in water runoff and river flows. This in turn has
impacts on the inflows into dams and water storages. Changes to mean runoff show the same sign of
change as rainfall, but changes are generally magnified (where a small change in rainfall leads to a
proportionally larger change in runoff)
Mean runoff in the western region is projected to decrease in summer and increase in winter, with the
largest changes possibly exceeding 60%. Mean runoff in the midlands and east coast regions is
projected to increase in most seasons, again with changes exceeding 60% possible
Runoff amounts during high events are projected to increase in much of the midlands and coastal
regions, which is likely to have effects on erosion and local flooding. Runoff during low events is
projected to decrease in much of the western region
River flows and inflows to dams and power stations are projected to stay the same or increase in many
coastal sites, but generally decrease in the highlands. The seasonality of many river flows is projected
to change
e) Extremes indices
As expected with an increase in mean temperature, there is projected to be an increase in the number of
hot days, warm spells and hot days, as well as an increase in the temperature of the hottest days and the
length of warm spells. Conversely, there is projected to be a decrease in the number of frosts, cold
days, cold waves and a decrease in the length of cold spells, and an increase in the temperature of the
coldest days
There is projected to be a large decrease in the number of frost-risk days (where daily minimum
temperature at the surface is less than 0°C), through the century. The greatest decreases are projected at
higher elevations that currently experience the highest number of frosts (e.g. frost-risk days decrease at
Miena/Liawenee by 63 days per annum (50%) by 2070-2099 under the A2 scenario)
There is projected to be a large increase in the number of summer days (daily maximum temperature
>25°C) across the whole of Tasmania, with larger increases occurring at lower elevations particularly
throughout the midlands, which are projected to experience up to a threefold increase
5IVG FC Report 6 Future climate projections
As mentioned above, the projections indicate with a warming climate there is a tendency for heavier
rainfalls interspersed with longer dry periods. This is expressed as less rain days per year (up to 15 days
per year less for some areas), more rainfall per rain day (up to 1.5 mm/day), higher instantaneous
rainfall rates (up to 30%), generally more very wet days (up to 7.5 days more), and more rainfall on wet
days (up to 45%)
Extreme rainfalls are projected to increase. Rainfall brought by Average Recurrence Intervals (ARI) is
projected to increase (from ARI-10 through to ARI-500). The areas that already experience the most
extreme rainfalls are projected to encounter the greatest increases – e.g. at St Helens the baseline ARI-
200 of 145 mm is projected to increase by 92% by the end of the century
f) Extreme sea level events
High water events causing coastal inundation comes from a combination of sea level, tide, storm surge
and wind waves. Sea level has been rising at a rate of 3.3 ±0.4 mm/year in the recent period, and is
expected to continue rising with further climate warming. The last IPCC assessment report gave a
central estimate of a rise of 0.82 m global average sea level by 2100 under a high emissions scenario.
Projected sea level rise varies in different locations, and for the coasts of Tasmania the sea level rise for
this scenario is close to the global average
The contribution of extreme tide height and storm surge to extreme sea level events varies around the
coast of Tasmania. The climate change projections indicate that effects from changes to storm surges
are likely to be negligible compared to that of sea level rise. The sum of all effects means that a present
100 year event is projected to be a 2 to 6 year event in many places
g) Adaptation potential
There is growing evidence that plant and animal species are able to respond to increases in temperature by
moving poleward and upward in elevation (Hughes 2000, 2003; Root et al 2003). Parmesan and Yohe (2003)
report on a systematic poleward shift of species of around 6.1 km per decade. Within Tasmania, there are
limited options to respond to changes in temperature profiles through latitudinal shifts. However, the potential
exists for mobile species to offset increases in temperature at low elevations by shifting to higher, cooler
elevations. Opportunities for movement to higher elevations will depend not only on changed temperature
profiles but also on adequate rainfall, suitable soils and a suitable topography.
Plant and animal communities already restricted to high altitudes (e.g. on the Central Highlands) will be under
increasing threat as temperatures at higher altitudes increase.
At the same time, increased temperatures and more growing degree days at higher elevations will provide
opportunities for crops and pastures to spread into previously unsuitable higher elevation areas, potentially
leading to pressure for land use change. Holz et al (2010) identified several areas that are currently primarily
temperature-limited but with soils and topography capable of supporting higher intensity agricultural
production under warmer temperatures. Some of these areas include a strip along the north-west coast, parts of
the north-east above Ringarooma, parts of central Tasmania from Bothwell across to Tarraleah and limited
areas in the Huon. For example, modelling of Growing Degree Days (GDD) along an altitudinal gradient from
Burnie to Waratah suggest that cropping will become possible to altitudes of 450 m asl. by 2030 and greater
than 500m asl. by 2050.
6IVG FC Report 6 Future climate projections
h) Growing Degree Days
In the absence of a specific growth model for particular organisms, Growing Degree Days (GDD) can be used
to relate temperature and biological response. GDD is a cumulative thermal unit, calculated from daily
minimum and maximum air temperature, used to indicate the time available for development above a
temperature threshold (commonly 10ºC). There is projected to be a gradual increase in annual GDD across
Tasmania from 1961 to 2100 (Figure 4). The growing season is also projected to begin earlier in the year.
Although commonly used for agricultural applications, changes in GDD are also likely to have significant
implications for native vegetation due to changes in, for example, growth rates of vegetation. They are likely to
change the competitive advantage of different plant species. This change in competitive advantage is likely to
lead to changes in the distributions of species and of communities. The projections suggest that the higher
elevation sites will experience the greatest relative increases in GDD. This is particularly likely to have an
impact on those species that exist within narrow elevation intervals. There are also likely to be other indirect
impacts on native plant communities through changes to the population dynamics of herbivores, particularly
insects, and on the parasites that feed on those herbivores. These are complex changes that are difficult to
predict with any certainty, and need to be evaluated case by case.
Figure 4. Annual growing degree days (GDD, 10 °C) for three periods in the average of six climate model projections under
the A2 (higher) emissions scenario. Lines show the boundaries of the IBRA regions.
7IVG FC Report 6 Future climate projections
IBRA Region: King
The King region comprises King Island and the north-western tip of Tasmania. It is
a region of subdued topography and low relief, and is significant for flora, fauna
and geoconservation.
Approximately 58% of the King bioregion is covered by native vegetation. It is dominated on King Island by
low closed forests and closed shrublands, heath, the grasslands group and small areas of eucalypt open forests
and eucalypt woodlands. The main island portion of the bioregion is dominated by eucalypt tall open forests,
eucalypt open forests, rainforest, the grasslands group and other forests and woodlands.
Current Climate
The King IBRA region has an average annual rainfall ranging from 750 – 2000mm across the region. It has a
temperate climate with average winter minimum temperatures ranging from 4 to 8°C across the region, and
average summer maximum temperatures ranging from 19 to 21°C.
Future scenarios
To give an impression of the strongest climate change signal that is projected, we report on results under the A2
(higher) emissions scenario by the end of the century. Results from the lower emissions scenario considered
(B1) and earlier time periods show a weaker response than this.
1. Temperature
The projected change in average temperatures is similar to the rest of Tasmania (2.6 to 3.3°C)
The projected change in average temperature is accompanied by a change in the frequency, intensity and
duration of hot and cold extremes of temperature. For the King IBRA Region:
o The average number of Summer Days (>25°C) per year generally doubles: on King Island from
around 15 days per year to more than 30 days per year, and on the north coast from less than 10
days per year to more than 25 days per year
o Warm spells (days in a row where temperatures are in the top 10% of baseline levels), which
currently last around 4-7 days, are projected to last from 6-18 days longer, with the greatest
increase occurring on the north coast of Tasmania
o Tropical nights (nights with a minimum temperature >20°C), which are currently rare events, are
projected to occur 5 or more times per year
o Frost- risk days remain at a very low frequency
2. Rainfall, runoff and rivers
Monthly average rainfall over the entire region is shown in the figure below. For King Island there is a
projected decrease in rainfall in spring, summer and autumn (generally 0 to -10%), with little change in
winter. This decreased rainfall is linked to an increase in drought frequency and severity, a decrease in
mean runoff during summer (10 to 15%) and a decrease in runoff during low events (>20%)
In contrast, rainfall on the northwest coast of mainland Tasmania is projected to follow the changes in the
western district in response to changes in the westerly circulation, which is decreased rainfall in summer
and autumn but increased rainfall in winter and spring (changes of up to 10%). The decreased rainfall in
summer and autumn is associated with decreases in runoff (of up to 30%), and an increase in the frequency
and severity of droughts
8IVG FC Report 6 Future climate projections
Changes to rainfall and runoff lead to slight decreases in the average annual flows in rivers on King Island
(central estimate -2%) and slight increases in rivers near Smithton (-2 to 7%)
Six-model summary of monthly rainfall (mm) across the King IBRA region under the A2 emission
scenario for the baseline (1961-1990) and future periods (2070-2099).
3. Growing Degree Days
GDD for King Island is projected to increase from a current annual GDD of 1328 to 2174 GDD
annually. The equivalent change near Smithton is for 1036 to 1840 GDD. As a proportion, the change
in GDD ranges across the region from 60-100% (Figure 4)
9IVG FC Report 6 Future climate projections
IBRA Region: Furneaux (Flinders sub-region)
The Furneaux IBRA region includes the Furneaux Group of islands, coastal
northeastern Tasmania and Wilsons Promontory. The Flinders sub-region is the
Tasmanian portion of the Furneaux bioregion.
The Flinders sub-region is characterized by coastal plains and a granitic island chain, as well as open slopes and
rugged hills and ranges. Approximately 62% of the Flinders sub-region is covered by native vegetation,
including heath, eucalypt open forests, low closed forests and closed shrublands, eucalypt woodlands, other
grasslands group and tussock grasslands and some eucalypt tall open forests. The coastal plains of northeastern
Tasmania have been heavily modified by agriculture (grazing and dairy).
Current Climate
Most of the Flinders sub-region has an average annual rainfall of 625 -1000 mm. It has a temperate climate
with average winter minimum temperatures ranging from 3 to 8°C across the region, and average summer
maximum temperatures ranging from 17 to 23°C (average 21°C across the region).
The Flinders sub- region is projected to have the greatest increase in annual rainfall across Tasmania.
Future scenarios
To give an impression of the strongest climate change signal that is projected, we report on results under the A2
(higher) emissions scenario by the end of the century. Results from the lower emissions scenario considered
(B1) and earlier time periods show a weaker response than this.
1. Temperature
The projected change in average temperatures is similar to the rest of Tasmania (2.6 to 3.3°C)
The projected change in average temperature is accompanied by a change in the frequency, intensity and
duration of hot and cold extremes of temperature. For the Flinders IBRA region the projections indicate:
o The number of Summer Days (>25°C) increases considerably. The greatest increase occurs on the
north coast near Bridport, where the number of Summer days per year rises from less than 20 days,
to more than 45 days per year
o Tropical nights (minimum temperature >20°C), which are currently rare events, are projected to
occur regularly, especially on Flinders Island (from less than 2 nights per year to up to 20), but also
on the north coast of Tasmania
o An increase in the mean annual maximum temperature by around 3°C. The mean annual minimum
temperature increases by a similar amount on Flinders Island, but to a lesser extent on the north
coast of Tasmania (around 2°C)
o Warm spells (days in a row where temperatures are in the top 10% of baseline levels), which
currently last around 5 days, are projected to last from 6-18 days longer, with the greatest increase
occurring on the north coast of Tasmania (e.g. At Devonport, warm spells last for approximately 25
days per year, up from 6 days per year)
2. Rainfall, runoff and rivers
Monthly average rainfall over the entire region is shown in the figure below. There is a projected increase
in annual average rainfall across much of the region (between 2 - 14%), and an increase in rainfall in all
seasons (generally in the 5-20% range), with some large localized increases in summer and the most
widespread increases occurring Winter (Figure 3)
10IVG FC Report 6 Future climate projections
A decrease in the long term drought frequency and severity is projected across the Flinders region due to
the higher average rainfall
Slightly fewer rain days per year on average is projected, but significantly more rain per rain day
Up to 7 more very wet days each year (where rainfall exceeds the baseline 95th percentile) is projected
The increase in rainfall leads to large increases in average annual runoff (up to 60%), with an increase in all
seasons, leading to large increases in river flows (e.g. Flinders Island rivers (central estimate +46%)
A marked increase in extreme rainfall amounts is projected (e.g. a 92% increase in the 200-year ARI at St
Helens), and runoff during high events (up to 60% in some places), but with no change to runoff during
low events
Six-model summary of monthly rainfall (mm) across the Flinders sub- region under the A2 emission
scenario for the baseline (1961-1990) and future periods (2070-2099).
11IVG FC Report 6 Future climate projections
IBRA Region: Tasmanian Southern Ranges
The Southern Ranges IBRA region is an inland region covering a large and diverse
area, from the mountainous and wet southwest, to the drier southeastern region near
Hobart. As such, it has a large gradient of prevailing temperature and local rainfall
climates.
The Southern Ranges feature a suite of landforms which are believed to have provided glacial refugia for fauna
and flora during past climate changes (Leithbridge Hill, New River Lagoon, Middle Weld – Picton – Huon
River valleys) (Australian Natural Resources Atlas, Department of the Environment, Water, Heritage and the
Arts).
Approximately 85% of the Southern Ranges bioregion is covered by native vegetation. The region is
dominated by eucalypt tall open forests, eucalypt open forests, rainforest and vine thickets, eucalypt
woodlands, tussock grasslands, the grasslands group and other forests and woodlands. Small areas of heath and
other low closed forests and closed shrublands occur.
Current Climate
Most of the Southern Ranges IBRA region has an average annual rainfall ranging from 625-2000 mm.
Average winter minimum temperatures range from -2 to 4 °C across the region, with average summer
maximum temperatures ranging from 12 to 23°C (average 18°C across the region).
Future scenarios
To give an impression of the strongest climate change signal that is projected, we report on results under the A2
(higher) emissions scenario by the end of the century. Results from the lower emissions scenario considered
(B1) and earlier time periods show a weaker response than this.
1. Temperature
The projected change in average temperatures is similar to the rest of Tasmania (2.6 to 3.3°C)
The projected change in average temperature is accompanied by a change in the frequency, intensity
and duration of hot and cold extremes of temperature. For the Southern Ranges IBRA Region:
o The number of Summer Days (>25°C) increases considerably. The greatest increase occurs
near the coast, e.g. at Southport summer days increase from around 15 days per year to more
than 30 days per year
o The mean annual maximum and minimum temperatures increase by around 3°C
o The number of frost-risk days reduces considerably. For example, at a site of 95 m above sea
level in the Huon Valley the number of frost-risk days declines from around 40 days per year
to less than 10 days per year
o Warm spells (days in a row where temperatures are in the top 10% of baseline levels) that
currently last about five days, are projected to last up to five days longer.
2. Rainfall, runoff and rivers
Monthly average rainfall over the entire region is shown in the figure below. A decrease is projected in
summer and autumn rainfall of up to 20% in the western part of the region, and increases in winter and
spring rainfall of up to 15% (Figure 3)
12IVG FC Report 6 Future climate projections
Changes in rainfall are linked to a projected decrease in mean runoff during summer (up to 15%) and a
decrease in runoff during low events (up to 15%). Average runoff decreases in the highest altitude
areas in all seasons, by more than 20% in some seasons
Drought frequency and severity are projected to remain similar to that experienced in the twentieth
century. In the Huonville area drought frequency may decrease due to increased average rainfall in this
area
Mean flows in the Huon, Russell and Little Denison Rivers are projected to remain unchanged
Six-model summary of monthly rainfall (mm) across the Southern Ranges IBRA region under the A2
emission scenario for the baseline (1961-1990) and future periods (2070-2099).
3. Growing Degree Days
The projected change in mean annual GDD ranges from 60-140% across the region, with the greatest increases
projected to occur in the southern part of the region (Figure 4)
13IVG FC Report 6 Future climate projections
IBRA Region: Northern Slopes
The northern slopes is a geologically diverse region with large areas of coastal
plains, open slopes and low hills. Approximately 54% of the Northern Slopes
region is covered by native vegetation. The region is dominated by eucalypt tall
open forests, eucalypt open forests, rainforest and small areas of eucalypt
woodlands, the grasslands group, low closed forests and closed shrublands and heath.
Current Climate
Most of the Northern Slopes region has an average annual rainfall ranging from 750 – 2000 mm. Average
winter minimum temperatures range from -2 to 5°C across the region. The region has mild summers, with
average summer maximum temperatures ranging from 14 to 23°C (average 20°C).
Future scenarios
To give an impression of the strongest climate change signal that is projected, we report on results under the A2
(higher) emissions scenario by the end of the century. Results from the lower emissions scenario considered
(B1) and earlier time periods show a weaker response than this.
1. Temperature
The projected change in average temperatures is similar to the rest of Tasmania (2.6 to 3.3°C)
Temperature limitation higher up the slopes will reduce, allowing altitudinal changes in biological
groups, and could lead to increasing land-use pressure further up the hill
The projected change in average temperature is accompanied by a change in the frequency, intensity
and duration of hot and cold extremes of temperature. For the Northern Slopes IBRA Region the
projections show:
o The number of Summer Days (>25°C) more than doubles across the region, for example at
Devonport the number increases from around 10 to around 30
o The mean annual maximum and minimum temperatures increase by 2.5- 3°C
o A decline in the number of frost-risk days is projected in areas where frosts currently occur
o A considerable increase in the warm spell duration index (annual count of days exceeding 5 in
a row where temperatures are in the top 10% of baseline levels), e.g. Devonport the number is
projected to increase from 6 days to almost 20 days
o Heat waves (>3 consecutive days exceeding 28°C) do not occur frequently in the region
2. Rainfall, runoff and rivers
Monthly average rainfall over the entire region is shown in the figure below. For the Northern Slopes
region there is a projected increase in rainfall in summer and winter (generally 0 to 10%), a slight
decrease in spring, and little change in autumn (Figure 3). There is little change in mean runoff during
summer or during low events
Drought frequency and severity is not projected to change substantially
The changes to rainfall and runoff lead to very slight decreases in the average annual flows in some
rivers (e.g. Mersey River (central estimate -1%); and slight increases in others (e.g. Rubicon River
(7%))
14IVG FC Report 6 Future climate projections
Six-model summary of monthly rainfall (mm) across the Northern Slopes IBRA region under the A2
emission scenario for the baseline (1961-1990) and future periods (2070-2099).
3. Evapotranspiration
Increases to total annual evapotranspiration occur along the coastal strips in this region. The increases
are proportionately greater in winter than summer
4. Growing Degree Days
There is a projected increase in Growing Degree Days (GDD) across the region (Figure 4). For
example, at Kindred (central part of the region) annual GDD (10°C) increases from the baseline level
of 964 GDD to 1755 GDD. At Deloraine, annual GDD (10°C) doubles, from 760 GDD to 1447 GDD
15IVG FC Report 6 Future climate projections
IBRA Region: Ben Lomond
The Ben Lomond bioregion, situated in Tasmania's inland north-east, is
characterized by humid cool/cold mountain ranges surrounded by open slopes and
plains. Approximately 68% of the region is covered by native vegetation. Lowland
vegetation comprises mainly open sclerophyll woodlands and heath while the
upper slopes consist of wet sclerophyll forests, some rainforest, and alpine
vegetation in the highest areas.
Current Climate
Most of the Ben Lomond region has an average annual rainfall ranging from 750 to 1500 mm. Average winter
minimum temperatures range from -2 to 5°C across the region, with average summer maximum temperatures
ranging from 12 to 23°C (average 20°C across the region).
Future scenarios
To give an impression of the strongest climate change signal that is projected, we report on results under the A2
(higher) emissions scenario by the end of the century. Results from the lower emissions scenario considered
(B1) and earlier time periods show a weaker response than this:
1. Temperature
The projected change in average temperatures is similar to the rest of Tasmania (2.6 to 3.3°C)
The projected change in average temperature is accompanied by a change in the frequency, intensity and
duration of hot and cold extremes of temperature. For the Ben Lomond IBRA Region the projections show:
o The number of Summer Days (>25°C) more than doubles in many locations in the region, with
the greatest increases in the lower elevation areas (e.g. from 10-15 days up to more than 30
days per year)
o The mean annual maximum and minimum temperatures increase by more than 3°C (more than
the mean temperature increase). Extreme daily maximum temperatures increase by up to 4°C
in Spring
o The number of frost-risk days declines considerably. The most extreme example is from
around 70 days per year, to less than 20 days per year at the highest altitudes
o A considerable increase in the warm spell duration index (annual count of days exceeding 5 in
a row where temperatures are in the top 10% of baseline levels) in the northern part of the
region
o A large increase in the number of warm nights – up to 28% more nights above the current 90th
percentile temperature
2. Rainfall, runoff and rivers
Monthly average rainfall over the entire region is shown in the figure below. There is a projected
increase in rainfall in winter and spring of up to 10% (Figure 3). In summer and autumn rainfall
declines in the high altitude areas of the region by up to 10%, and increases towards the east coast (by
up to 10%)
This is linked to a decrease in mean runoff during summer (up to 15%) and a decrease in runoff during
low events (up to 15%)
There is no substantial change in drought frequency and severity across the region as a whole but a
slight decrease in the north-east
16IVG FC Report 6 Future climate projections
Changes to rainfall and runoff lead to increased mean river flows (e.g. the North Esk River (central
estimate 7%), South Esk River (12%)
Six-model summary of monthly rainfall (mm) across the Ben Lomond IBRA region under the A2
emission scenario for the baseline (1961-1990) and future periods (2070-2099).
3. Growing Degree Days
There is a projected increase in Growing Degree Days (GDD) across the region (Figure 4). For example, in
Scottsdale annual GDD (10°C) increases from the baseline level of 1009 GDD to 1803 GDD
17IVG FC Report 6 Future climate projections
IBRA Region: Central Highlands
The Central Highlands region is characterized by an elevated undulating plateau
and rugged mountain ranges towards the west. Approximately 86% of the Central
Highlands bioregion is covered by native vegetation. There is a high diversity of
vegetation including eucalypt open forests, eucalypt woodlands, rainforest and vine thickets, the grasslands
group, eucalypt tall open forests, tussock grasslands, heath, low closed forests and closed shrublands and other
forests and woodlands. Alpine heath is abundant on much of the Central Plateau and alpine areas of the Central
Highlands.
Current Climate
Most of the Central Highlands bioregion has an average annual rainfall ranging from 625 to 2500 mm. Of the
Tasmanian IBRA regions, the Central Highlands region has the coolest winter temperatures with average
winter minimum temperatures ranging from -2 to 3°C (average 0.3°C) across the region. Average summer
maximum temperatures range from 12 to 22°C (average 18°C across the region).
The Central Highlands region is the region with the most marked reduction in rainfall projected to occur in
Tasmania. The impact of increasing temperatures on high altitude areas is also likely to be important.
Future scenarios
To give an impression of the strongest climate change signal that is projected, we report on results under the A2
(higher) emissions scenario by the end of the century. Results from the lower emissions scenario considered
(B1) and earlier time periods show a weaker response than this.
1. Temperature
The projected change in average temperatures is similar to the rest of Tasmania (2.6 to 3.3°C)
The projected change in average temperature is accompanied by a change in the frequency, intensity and
duration of hot and cold extremes of temperature. For the Central Highlands IBRA Region, the projections
show:
o An increase in the number of Summer Days (>25°C) from less than 5 days per year to around 12
days per year across most of the region
o A decrease in the mean annual maximum and minimum temperatures by approximately 3°C
o The number of frost-risk days declines considerably. The most extreme declines occur in the
highest altitudes areas, where the number of frost-risk days decline from around 120 days per year
to around 60 days per year
o A decline on the duration and frequency of cold spells. For example, at Miena there are currently
around 2 ‘cold waves’ per year, but these are projected to be rare events by the end of the century
o
o An increase in the day-night temperature difference in all months, unlike on the coasts, due to the
higher altitude of the region, and the reduction in cloud and rainfall
o Heat waves (>3 days >28°C) will still be very rare events
2. Rainfall, runoff and rivers
Monthly average rainfall over the entire region is shown in the figure below. In the western part of the
region rainfall is projected to decrease in all seasons (generally by up to 10%, and up to 20% in Summer)
(Figure 3)
18IVG FC Report 6 Future climate projections
Change in rainfall is linked to a decrease in mean runoff in all seasons (up to 30% in Summer) and a
decrease in runoff during low events (up to 30%)
An increase in drought frequency and severity in the western part of the region is projected
The reduction in rainfall and runoff will lead to reductions in flows (e.g. Iris River (central estimate -9%),
Forth River above Lemonthyme Power Stn (-6%), Nive River (-12%))
Six-model summary of monthly rainfall (mm) across the Central Highlands IBRA region under the A2
emission scenario for the baseline (1961-1990) and future periods (2070-2099).
19IVG FC Report 6 Future climate projections
IBRA Region: West
The West is the largest IBRA region in Tasmania (> 1.5 million hectares),
including most of coastal and inland western Tasmania. 87% of its area is in the
National Reserve System. The region is characterized by lowlands, low hills and
rugged dissected inland mountain ranges.
Approximately 95% of the West region is covered by native vegetation. The region is dominated by the
grasslands group, rainforest and vine thickets, low closed forests and closed shrublands, eucalypt open forests
with small areas of heath, eucalypt tall open forests and eucalypt woodlands.
Current Climate
The West region has a cool, superhumid climate, and is the wettest of Tasmania’s regions, with most of the
region having an average annual rainfall ranging from 1250 mm to over 2500 mm. Average winter minimum
temperatures range from -2 to 6°C across the region. The region has the coolest summers, with average summer
maximum temperatures ranging from 13 to 21°C (average 18°C across the region).
The West region exhibits the largest projected changes to seasonal rainfall across Tasmania, linked to changes
in the mid-latitude westerly circulation and storm tracks. Increases in Winter and Spring rainfall contrast with
decreases in Summer and Autumn.
Future scenarios
To give an impression of the strongest climate change signal that is projected, we report on results under the A2
(higher) emissions scenario by the end of the century. Results from the lower emissions scenario considered
(B1) and earlier time periods show a weaker response than this.
1. Temperature
The projected change in average temperatures is similar to the rest of Tasmania (2.6 to 3.3°C)
The projected change in average temperature is accompanied by a change in the frequency, intensity and
duration of hot and cold extremes of temperature. For West IBRA Region, the projections show:
o A significant increase in rainfall in winter and a significant decrease in summer rainfall after 2050
o An increase in the number of Summer Days (>25°C) by 4-20 days per year across much of the
region, with increases of up to 28 days per year at the most easterly extent (to more than 40 days
per year). For example, in Strahan the number of Summer days increases from 19 per year to more
than 42 days; in Strathgordon the increase is from a baseline of around 14 Summer days to more
than 30 days per year
o An increase in the mean annual maximum and minimum temperatures by around 3°C
o A reduction in the number of frost-risk days (e.g. In Strahan the number of frost-risk days declines
from around 6 per year to about 1 per year. At Strathgordon it declines from over 15 days per year
to less than 3)
o Warm spells (days in a row where temperatures are in the top 10% of baseline levels), which
currently last around 5 days, are projected to last up to 6 days longer (3 days longer in both Strahan
and Strathgordon)
2. Rainfall, runoff and rivers
Monthly average rainfall over the entire region is shown in the figure below. There is a projected decrease
in rainfall in summer and autumn (by over 10 to 20%) but an increase in winter and spring (by up to 20%)
(Figure 3)
20IVG FC Report 6 Future climate projections
No significant change to drought frequency and severity is projected across the region as a whole, but there
is a tendency to decreasing drought frequency and severity in the far south-west
An increase in the frequency of extreme precipitation events in winter and early spring is projected,
combined with a decrease in summer events, leading to more intense and heavy downpours interspersed
with longer dry periods
Projections of increased rainfall in winter and spring and lower rainfall in summer and autumn result in
only small changes to average annual river flows. (e.g. the Collingwood River (central estimate is -3%), the
Davey River (+2%), the upper part of the Franklin River (-5%), Lost Creek (+4%) and the Stitt River
(+1%). However, there is a projected change to the seasonality of flows
Six-model summary of monthly rainfall (mm) across the West IBRA region under the A2 emission
scenario for the baseline (1961-1990) and future periods (2070-2099).
3. Evapotranspiration
Total annual evapotranspiration will increase, but there is a slight decrease in summer when
evapotranspiration becomes more water limited
21IVG FC Report 6 Future climate projections
IBRA Region: South East
The South East IBRA region encompasses much of coastal eastern Tasmania, the
Midlands and the lower Derwent Valley. The region has a highly indented
coastline, large areas of open slopes, plains and hills and low mountain ranges.
Approximately 65% of the South East bioregion is covered by native vegetation. The region is dominated by
eucalypt woodlands, eucalypt open forests and tall open forests and the grasslands group. Smaller areas of
rainforest, eucalypt open woodlands, heath, chenopod and samphire shrublands, low closed forests and closed
shrublands, casuarina communities and tussock grasslands occur. Extensive areas of vegetation have been
converted to improved pasture and cropland.
Current Climate
The South East region has a subhumid, warm climate. Most of the region has an average annual rainfall ranging
from 375 to 1000 mm, with the rainfall occurring uniformly through the year. Average winter minimum
temperatures range from -1 to 6°C across the region. The region has mild summers with average summer
maximum temperatures ranging from 13 to 23°C (average 19°C across the region).
Future scenarios
To give an impression of the strongest climate change signal that is projected, we report on results under the A2
(higher) emissions scenario by the end of the century. Results from the lower emissions scenario considered
(B1) and earlier time periods show a weaker response than this.
1. Temperature
The projected change in average temperatures is similar to the rest of Tasmania (2.6 to 3.3°C)
The projected change in average temperature is accompanied by a change in the frequency, intensity
and duration of hot and cold extremes of temperature. For the South East IBRA Region, the projections
show:
o An increase in the number of Summer Days (>25°C). For example in Hobart, the number
increases from 18 days per year to around 40 days per year. In Swansea the number increases
from 17 days per year to around 44 days per year
o The mean annual maximum and minimum temperatures increase by approximately 3°C
o The number of frost-risk days declines considerably. For example in Hobart, the number
decreases from 5 days per year to around 1 day per year. In Swansea, frost-risk days decline
from a current 9 days per year to less than 1 day per year
o The incidence of heat waves (>3 consecutive days exceeding 28°C) increases, to occur every
year or two
o The average hottest day of the year, which is high in the southeast compared to most places in
Tasmania (up to 36°C), is projected to increase by up to 3°C
2. Rainfall, runoff and rivers
Monthly average rainfall over the entire region is shown in the figure below. Average rainfall is projected
to increase in Autumn and Summer (up to 10%) and decrease in Spring (up to 5%). In winter, rainfall is
projected to decrease in the northern part of the region (up to 5%) and increase in the south and west (up to
10%) (Figure 3)
Changes in rainfall are linked to an increase in mean annual runoff, with a substantial increase in Summer
(up to 30%) and Autumn (> 60%). There is little change to runoff during low events
22IVG FC Report 6 Future climate projections
No marked change to drought frequency and severity is projected to occur across much of the region,
except in the south-east where there will be a slight decrease
The increase in rainfall and runoff will lead to increases to river flows (e.g. The Derwent Estuary (central
estimate 10%), Little Swanport River (15%), Prosser River (12%))
Six-model summary of monthly rainfall (mm) across the South East IBRA region under the A2
emission scenario for the baseline (1961-1990) and future periods (2070-2099).
3. Growing Degree Days
There is a projected increase in Growing Degree Days (GDD) across the region (Figure 4). For example, in the
Coal Valley, annual GDD (10°C) increases from the baseline level of 1154 GDD to 1905 GDD
23IVG FC Report 6 Future climate projections
IBRA Region: Northern Midlands
The Northern Midlands region is an extensive lowland plain bordered in the east
and west by hilly topography. Extensive agriculture is supported in the region.
Approximately 35% of the area of the Northern Midlands region remains under
native vegetation. There are eucalypt open forests, eucalypt woodlands and open
woodlands, other grasslands, tussock grasslands and other shrublands. Of the Tasmanian IBRA regions, the
Northern Midlands region has the lowest area in the National Reserve System (5% as of June 2009).
Current Climate
The Northern Midlands region has an average annual rainfall ranging from 375 to 1000 mm across the region.
Average winter minimum temperatures range from 0 to 3°C across the region. This region has the warmest
summer temperatures of all Tasmanian IBRA regions, with average summer maximum temperatures ranging
from 18 to 24°C (average 22°C across the region).
The Northern midlands region is in the rain shadow of the Great Western Tiers and has the lowest rainfall of
any region in Tasmania. This makes it a difficult area to model, and biases tended to be higher than in other
regions of Tasmania.
Future scenarios
To give an impression of the strongest climate change signal that is projected, we report on results under the A2
(higher) emissions scenario by the end of the century. Results from the lower emissions scenario considered
(B1) and earlier time periods show a weaker response than this.
1. Temperature
The projected change in average temperatures is similar to the rest of Tasmania (2.6 to 3.3°C)
The projected change in average temperature is accompanied by a change in the frequency, intensity and
duration of hot and cold extremes of temperature. For the Northern Midlands IBRA Region, the projections
show:
o The number of Summer Days (>25°C) increases considerably across the region. The Northern
midlands shows the greatest increase in the state. For example, at Launceston the frequency of
summer days is projected to increase from around 29 per year to over 70 per year
o An increase in the mean annual maximum and minimum temperatures by approximately 3°C
o A marked decline in the number of frost-risk days
o Heat waves (>3 consecutive days exceeding 28°C) occur around twice every year
o The mean annual maximum temperature, currently amongst the highest in Tasmania, increases by
around 3°C. The mean annual minimum temperature increases by 2-3°C
2. Rainfall, runoff and rivers
Monthly average rainfall over the entire region is shown in the figure below. Average rainfall is projected
to increase in all seasons (up to 10%) (Figure 3)
Increased rainfall leads to an increase in mean annual runoff (up to 20%). There is no substantial change to
runoff during low events
No marked change in drought frequency and severity is projected
24IVG FC Report 6 Future climate projections
There are projected increases to river flows (e.g. Macquarie River (central estimate 17%), South Esk River
(12%)
Six-model summary of monthly rainfall (mm) across the South East IBRA region under the A2
emission scenario for the baseline (1961-1990) and future periods (2070-2099).
25IVG FC Report 6 Future climate projections
report, 23 Dec 2010
Appendix – details of climate projections Grose MR, Barnes-Keoghan I, Corney SP, White CJ, Holz GK,
Greenhouse gas emissions have an influence on the Earth’s Bennett JC, Gaynor SM & Bindoff NL 2010, Climate
climate system, along with other human activities such as Futures for Tasmania: general climate impacts
technical report, Antarctic Climate and Ecosystems
the emission of ozone-depleting substances, emission of Cooperative Research Centre, Hobart, Tasmania
aerosol (particles) and changing the land cover (e.g.
deforestation). Sophisticated model simulations can be Holz GK, Grose MR, Bennett JC, Corney SP, White CJ, Phelan
D, Potter K, Kriticos D, Rawnsley R, Parsons D, Lisson
used to project the likely effect of these influences into the
S, Gaynor SM & Bindoff NL 2010, Climate Futures for
future given our current state of knowledge. It is impossible Tasmania: impacts on agriculture technical report,
to predict exactly what future human emissions will be, so Antarctic Climate and Ecosystems Cooperative
models are run under a set of plausible hypothetical Research Centre, Hobart, Tasmania
emissions scenarios. A model simulation shows the likely Hughes L 2000, ‘Biological consequences of global
effect if we follow that scenario, so it is not a single warming: is the signal already apparent?’,
‘prediction’ of the future. The simulation can’t include the Trends in Ecology & Evolution, vol. 15, pp.
effect of things that are impossible to predict (such as major 56‑61
volcanic eruptions) McInnes KL, O’Grady JG, Hemer M, Macadam I, Abbs DJ,
Climate warming causes many complex changes to the White CJ, Bennett JC, Corney SP, Holz GK, Grose
MR, Gaynor SM & Bindoff NL In Press, Climate
earth’s climate system. These changes include alterations to Futures for Tasmania: extreme tide and sea level
ocean currents, average atmospheric circulation and ocean- events technical report, Antarctic Climate and
atmosphere cycles such as the El Niño Southern Ecosystems Cooperative Research Centre, Hobart,
Oscillation. Projected effects that are relevant to Tasmania Tasmania
include a continued extension of the East Australia Current Meehl, G. A., et al.: 2007 Global Climate Projections. In:
bringing warmer waters off the east and northeast coast of Solomon, S. et al., Climate Change 2007: The
Tasmania, a pole-ward shift of the subtropical ridge of high Physical Science Basis. Contribution of Working
pressure and shifts in the mid-latitude westerlies (the Group I to the Fourth Assessment Report of the
‘Roaring 40s’), and a change in remote climate drivers such Intergovernmental Panel on Climate Change.
Cambridge, United Kingdom, Cambridge University
as atmospheric blocking, the El Niño Southern Oscillation Press
and the Southern Annular Mode. The position of Tasmania
adjacent to the Southern Ocean means that the effect of Parmesan C & Yohe G 2003, ‘A globally coherent
climate warming is not as severe as other more continental fingerprint of climate change impacts
regions. across natural systems’, Nature, vol. 421, pp.
37‑42
The results presented in this report were made using
Root TL, Price JT, Hall KR, Schneider SH, Rosenzweig
established methods, including: C & Pounds JA 2003, ‘Fingerprints of global
warming on wild animals and plants’,
Extreme value distribution fitting in a generalized
Nature, vol. 421, pp. 57‑60
Pareto distribution to calculate the average recurrence
intervals (ARIs) White CJ, Sanabria LA, Grose MR, Corney SP, Bennett JC,
Holz GK, McInnes KL, Cechet RP, Gaynor SM &
Hydrology runoff models developed and calibrated for Bindoff NL 2011, Climate Futures for Tasmania:
the Tasmanian Sustainable Yields project to estimate extreme events technical report, Antarctic Climate and
the runoff, river flows and inflows to storages Ecosystems Cooperative Research Centre, Hobart,
Tasmania
10 °C threshold to calculate Growing Degree Days The material in this report is based on computer modelling
projections for climate change scenarios and, as such, there are
All information is drawn from the Climate Futures for inherent uncertainties involved. While every effort has been
Tasmania Technical reports. Please see these reports for made to ensure the material in this report is accurate, Antarctic
more details, and to cite in other written work. Climate & Ecosystems Cooperative Research Centre (ACE)
provides no warranty, guarantee or representation that material
is accurate, complete, up to date, non-infringing or fit for a
Reference list particular purpose. The use of the material is entirely at the risk
Bennett JC, Ling FLN, Graham B, Grose MR, Corney SP, White of a user. The user must independently verify the suitability of
CJ, Holz GK, Post DA, Gaynor SM & Bindoff NL 2010, the material for its own use.
Climate Futures for Tasmania: water and catchments To the maximum extent permitted by law, ACE, its participating
technical report, Antarctic Climate and Ecosystems organisations and their officers, employees, contractors and
Cooperative Research Centre, Hobart, Tasmania agents exclude liability for any loss, damage, costs or expenses
whether direct, indirect, consequential including loss of profits,
Corney SP, Katzfey JJ, McGregor JL, Grose MR, Bennett JC, opportunity and third party claims that may be caused through
White CJ, Holz GK, Gaynor SM & Bindoff NL 2011, the use of, reliance upon, or interpretation of the material in this
Climate Futures for Tasmania: climate modeling report.
technical report, Antarctic Climate and Ecosystems
Cooperative Research Centre, Hobart, Tasmania
Entura Consulting, 2010, Climate Futures for Tasmania Flood
inundation mapping, Entura Consulting Technical
26You can also read