FUTURE OF SOLAR PHOTOVOLTAIC - Deployment, investment, technology, grid integration and socio-economic aspects - IRENA
←
→
Page content transcription
If your browser does not render page correctly, please read the page content below
FUTURE OF
SOLAR PHOTOVOLTAIC
Deployment, investment,
technology, grid integration and
socio-economic aspects

A Global Energy Transformation paper
© IRENA 2019
Unless otherwise stated, material in this publication may be freely used, shared, copied, reproduced, printed and/or stored,
provided that appropriate acknowledgement is given of IRENA as the source and copyright holder. Material in this publication
that is attributed to third parties may be subject to separate terms of use and restrictions, and appropriate permissions from
these third parties may need to be secured before any use of such material.

ISBN 978-92-9260-156-0

Citation
IRENA (2019), Future of Solar Photovoltaic: Deployment, investment, technology, grid integration and socio-economic
aspects (A Global Energy Transformation: paper), International Renewable Energy Agency, Abu Dhabi.

This document presents additional findings from Global energy transformation: A roadmap to 2050 (2019 edition) available
for download from www.irena.org/publications. For further information or to provide feedback, please contact IRENA
at info@irena.org.

About IRENA
The International Renewable Energy Agency (IRENA) is an intergovernmental organisation that serves as the principal
platform for co-operation, a centre of excellence, a repository of policy, technology, resource and financial knowledge,
and a driver of action on the ground to advance the transformation of the global energy system. IRENA promotes the
widespread adoption and sustainable use of all forms of renewable energy, including bioenergy, geothermal, hydropower,
ocean, solar and wind energy, in the pursuit of sustainable development, energy access, energy security and low-carbon
economic growth and prosperity.

Acknowledgements
This report benefited from input and review of experts: Anshu Bhaeadwaj, Jain Pratah, Ghosh Saptak (Centre for Study of
Science, Technoogy and Policy), Raed Bkayrat (Clean Tech Advisor & Entrepreneur), Nabih Cherradi (Desert Technologies),
Stefan Nowak (International Energy Agency Photovoltaic Power System Programme), Rajeev Gyani, Rakesh Kumar,
Remesh Kumar, Arun Misra, Seth Shishir, Upendra Tripathy (International Solar Alliance), Dave Renne (International Solar
Energy Society), Christian Thiel and Arnulf Jaeger-Waldau (Joint Research Centre), Kristen Ardani, David Feldman and
Robert Margolis (National Renewable Energy Laboratory), Aurelie Beauvais, Bruce Douglas, Raffaele Rossi, Michael
Schmela (Solar Power Europe), Frank Haugwitz (Solar Promotion International GmbH), George Kelly (Sunset Technology).
Valuable review and feedback were provided by IRENA colleagues: Francisco Boshell, Paul Komor, Neil MacDonald,
Pablo Ralon, Michael Taylor and IRENA’s Policy Team. The editor of this report was James French-Brooks.

Contributing authors: This report was developed under the guidance of Dolf Gielen and Ricardo Gorini
and was authored by Elisa Asmelash and Gayathri Prakash, with additional contributions and support from
Rodrigo Leme and Giacomo Gallina.

IRENA is grateful for the generous support of the Federal Ministry for Economic Affairs and Energy of Germany,
which made the publication of this report a reality.

Disclaimer
This publication and the material herein are provided “as is”. All reasonable precautions have been taken by IRENA to verify
the reliability of the material in this publication. However, neither IRENA nor any of its officials, agents, data or other third-
party content providers provides a warranty of any kind, either expressed or implied, and they accept no responsibility or
liability for any consequence of use of the publication or material herein.
The information contained herein does not necessarily represent the views of the Members of IRENA. The mention of
specific companies or certain projects or products does not imply that they are endorsed or recommended by IRENA in
preference to others of a similar nature that are not mentioned. The designations employed, and the presentation of material
herein, do not imply the expression of any opinion on the part of IRENA concerning the legal status of any region, country,
territory, city or area or of its authorities, or concerning the delimitation of frontiers or boundaries.
CONTENTS
FIGURES                                                                   4

ABBREVIATIONS                                                             6

EXECUTIVE SUMMARY                                                         7

1	ENERGY TRANSFORMATION PATHWAYS AND SOLAR PV                           12

    1.1 Pathways for the Global Energy Transformation                    12
    1.2 The Energy Transformation Rationale                              13
    1.3 Global Energy Transformation: The role of solar PV               15

2	THE EVOLUTION AND FUTURE OF SOLAR PV MARKETS                          19

    2.1 Evolution of the solar PV industry                               19
    2.2 Solar PV outlook to 2050                                         21

3	TECHNOLOGICAL SOLUTIONS AND INNOVATIONS TO INTEGRATE RISING SHARES
   OF SOLAR PV POWER GENERATION                                          34

4 SUPPLY-SIDE AND MARKET EXPANSION                                       39

    4.1 Technology expansion                                             39

5 FUTURE SOLAR PV TRENDS                                                 40

    5.1 Materials and module manufacturing                               40
    5.2 Applications: Beyond fields and rooftops                         44
    5.3 Operation and maintenance                                        48
    5.4 End-of life management of solar pv                               50

6	SOCIO-ECONOMIC AND OTHER BENEFITS OF SOLAR PV IN THE CONTEXT OF
   THE ENERGY TRANSFORMATION                                             54

    6.1	Solar pv sector employment and local value chains               54
    6.2	Clustering with other low-carbon technologies: hybrid system    58

7	STRUCTURING PV BUSINESS MODELS ACCORDING TO HOW THEY COMPETE WITH
   OTHER GENERATION SOURCES                                              59

8	ACCELERATING SOLAR PV DEPLOYMENT: BARRIERS AND SOLUTIONS              61

    8.1 Deployment policies                                              63
    8.2 Integrating policies                                             64
    8.3 Enabling policies                                                67

REFERENCES                                                               68

                                                     -3-
FIGURES
Figure ES 1. Status and future of Solar Photovoltaics (PV) - Tracking progress to accelerate
solar PV deployment to achieve Paris Climate targets 10
Figure 1: Pressing needs and attractive opportunities are driving the ongoing
energy transformation 14
Figure 2: Renewables and efficiency measures, boosted by substantial electrification,
can provide over 90% of the necessary CO₂ emission reductions by 2050 15
Figure 3: Solar PV would have the largest installed capacity expansion by 2050 17
Figure 4: Solar pv would contribute to 4.9 Gt of CO₂ emissions reductions in 2050, representing
21% of the energy-sector emissions reductions needed to meet paris climate goals 18
Figure 5: Major milestones achieved by the solar industry 20
Figure 6: Compared to 2018 levels, cumulative solar PV capacity is expected to grow
SIXFOLD by 2030, with a CAGR of nearly 9% UP TO 2050 22
Figure 7: Among the world’s regions, Asia is poised to dominate global solar PV installations
in the remap scenario, followed by North America and Europe 24
Figure 8: Annual Global solar PV additions are expected to reach to 270 GW in 2030 and
372 GW in 2050 under the remap scenario, compared with 94 GW in 2018 25
Figure 9: Global power capacity, off-Grid solar PV, 2008–18 Source: IRENA (2019a). 26
Figure 10: There has been a rapid decline in total installed costs of solar PV,
with costs expected to further decline by 2050 27
Figure 11: Total installed cost of utility-scale solar PV, selected countries, 2010–18 28
Figure 12: The levelized cost of e^lectricity (LCOE) for solar PV is already competitive now compared
to all fossil fuel generation sources and would be fully competitive in a few years. 29
Figure 13: The LCOE for projects and global weighted average values for solar PV, 2010–20 30
Figure 14: Scaling up solar PV energy investment is key to accelerate the pace of
global solar PV installations over the coming decades. 31
Figure 15: Regional annual investment in solar PV capacity (new and replacement),
2019–50 (USD billion/yr) 32
Figure 16: Solar generation projections in 2040 and 2050 global energy scenarios 33
Figure 17: The Higher penetration of solar power in electricity grids is foreseen in
various countries by 2030 and 2050 35
Figure 18: Power system flexibility enablers in the energy sector 36
Figure 19: Additional investments are required in grids, generation adequacy and
some flexibility measures (such as storage) across the entire electricity system
to integrate raising shares of variable renewable sources. 37
Figure 20: The four dimensions of innovation 38
Figure 21: Solar PV value chain 40
-4-Figure 22: Solar PV technology status 41
Figure 23: The solar PV industry employed 3.6 million people worldwide in 2018 and this
number is expected to rise further to 18.7 million people by 2050 in the REmap case 55
Figure 24: Women in STEM, NON-STEM Technical and administrative jobs in the Energy Sector. 55
Figure 25: Materials required for a 1 MW solar pv plant 56
Figure 26: Distribution of human resources and occupational requirements along the
value chain (50 MW solar PV) 57
Figure 27: Existing barriers to fostering solar PV deployment 61
Figure 28: The policy framework for a just transition 62
BOXES
Box 1: Practical options for global energy decarbonisation 12
Box 2: Deployment of rooftop solar PV systems for distributed generation 23
Box 3: Solar PV for off-grid solutions 26
Box 4: Current Auction and PPA data for solar PV and the impact on driving down LCOEs 30
Box 5: The future potential of solar: Comparison with other energy scenarios 33
Box 6: Power system flexibility to integrate a rising share of VRE 36
Box 7: Innovation landscape to integrate high shares of VRE 38
Box 8: Solar PV performance under extreme weather events 52
Box 9: The importence of standards in the solar PV industry 53
Box 10: IRENA’S work on gender balance in the energy sector 55
Box 11: Hybrid renewables developments 58
Box 12: PV business models 59
Annual global temperatures from 1850–2017 Warming Stripes, by Ed Hawkins, climate scientist in the
National Centre for Atmospheric Science (NCAS) at the University of Reading.
The visualisation illustrates the changes witnessed in temperatures across the globe over the past century and
more. The colour of each stripe represents the temperature of a single year, ordered from the earliest available
data at each location to now. The colour scale represents the change in global temperatures covering 1.35 °C.
-5-ABBREVIATIONS
HVDC high-voltage direct current
APV agrophotovoltaic
IRENA International Renewable Energy Agency
BoS balance of system
IPCC Intergovernmental Panel on Climate Change
BNEF Bloomberg New Energy Finance
ITRPV International Technology Roadmap for
BIPV building-integrated photovoltaic Photovoltaic
CAGR compound annual growth rate kW kilowatt
CAPEX capital expenditure kWh kilowatt hour
CdTe cadmium telluride LCOE levelised cost of electricity
CIGS copper-indium-gallium-diselenide m2 square metre
CO₂ carbon dioxide MW megawatt
C-Si crystalline silicon MWh megawatt hour
CSP concentrating solar power NREL US National Renewable Energy Laboratory
DC direct current O&M operations and maintenance
DER distributed energy resources OPEX operating expenditure
DG distributed generation PERC passivated emitter and rear cell/contact
DSO distribution system operator PPA power purchase agreement
EMEA Europe, the Middle East and Africa PV photovoltaic
EU European Union PV-T photovoltaic-thermal
EV electric vehicle R&D research and development
FIT feed-in tariff REmap IRENA’s renewable energy roadmap
G20 Group of Twenty STEM science, technology, engineering and
mathematics
GBP British pound
TW terawatt
GCC Gulf Cooperation Council
TWh terawatt hour
Gt gigatonne
VPP virtual power plant
GW gigawatt
VRE variable renewable energy
GWEC Global Wind Energy Council
USD US dollar
HVAC high-voltage alternating current
W watt
-6-FUTURE OF SOLAR PV EXECUTIVE SUMMARY
EXECUTIVE
SUMMARY
THE DECARBONISATION OF THE ENERGY SECTOR AND THE REDUCTION OF CARBON EMISSIONS TO LIMIT
CLIMATE CHANGE ARE AT THE HEART OF THE INTERNATIONAL RENEWABLE ENERGY AGENCY (IRENA)
ENERGY TRANSFORMATION ROADMAPS. These roadmaps examine and provide an ambitious, yet technically
and economically feasible, pathway for the deployment of low-carbon technology towards a sustainable and
clean energy future.
IRENA HAS EXPLORED TWO ENERGY DEVELOPMENT OPTIONS TO THE YEAR 2050 AS PART OF THE 2019
EDITION OF ITS GLOBAL ENERGY TRANSFORMATION REPORT. The first is an energy pathway set by current
and planned policies (Reference Case). The second is a cleaner climate-resilient pathway based largely on more
ambitious, yet achievable, uptake of renewable energy and energy efficiency measures (REmap Case), which
limits the rise in global temperature to well below 2 degrees and closer to 1.5 degrees, aligned within the envelope
of scenarios presented in the 2018 report of the Intergovernmental Panel on Climate Change (IPCC).
THE PRESENT REPORT OUTLINES THE ROLE OF SOLAR PHOTOVOLTAIC (PV) POWER IN THE TRANSFORMATION
OF THE GLOBAL ENERGY SYSTEM BASED ON IRENA’S CLIMATE-RESILIENT PATHWAY (REMAP CASE),
specifically the growth in solar PV power deployment that would be needed in the next three decades to achieve
the Paris climate goals.
This report’s findings are summarised as follows:
n ACCELERATED DEPLOYMENT OF RENEWABLES, COMBINED WITH DEEP ELECTRIFICATION AND
INCREASED ENERGY EFFICIENCY, CAN ACHIEVE OVER 90% OF THE ENERGY-RELATED CARBON DIOXIDE
(CO₂) EMISSION REDUCTIONS NEEDED BY 2050 TO SET THE WORLD ON AN ENERGY PATHWAY TOWARDS
MEETING THE PARIS CLIMATE TARGETS. Among all low-carbon technology options, accelerated deployment
of solar PV alone can lead to significant emission reductions of 4.9 gigatonnes of carbon dioxide (Gt CO₂) in
2050, representing 21% of the total emission mitigation potential in the energy sector.
n ACHIEVING THE PARIS CLIMATE GOALS WOULD REQUIRE SIGNIFICANT ACCELERATION ACROSS A
RANGE OF SECTORS AND TECHNOLOGIES. By 2050 solar PV would represent the second-largest power
generation source, just behind wind power and lead the way for the transformation of the global electricity
sector. Solar PV would generate a quarter (25%) of total electricity needs globally, becoming one of
prominent generations source by 2050.
-7-FUTURE OF SOLAR PV EXECUTIVE SUMMARY
n SUCH A TRANSFORMATION IS ONLY POSSIBLE BY SIGNIFICANTLY SCALING UP SOLAR PV CAPACITY IN
NEXT THREE DECADES. This entails increasing total solar PV capacity almost sixfold over the next ten years, from
a global total of 480 GW in 2018 to 2 840 GW by 2030, and to 8 519 GW by 2050 – an increase of almost eighteen
times 2018 levels.
n THE SOLAR PV INDUSTRY WOULD NEED TO BE PREPARED FOR SUCH A SIGNIFICANT GROWTH IN THE
MARKET OVER THE NEXT THREE DECADES. In annual growth terms, an almost threefold rise in yearly solar
PV capacity additions is needed by 2030 (to 270 GW per year) and a fourfold rise by 2050 (to 372 GW per
year), compared to current levels (94 GW added in 2018).
Thanks to its modular and distributed nature, solar PV technology is being adapted to a wide range of off-grid
applications and to local conditions. In the last decade (2008–18), the globally installed capacity of off-grid
solar PV has grown more than tenfold, from roughly 0.25 GW in 2008, to almost 3 GW in 2018. Off-grid solar
PV is a key technology for achieving full energy access and achieving the Sustainable Development Goals.
n AT A REGIONAL LEVEL, ASIA IS EXPECTED TO DRIVE THE WAVE OF SOLAR PV CAPACITY INSTALLATIONS,
BEING THE WORLD LEADERS IN SOLAR PV ENERGY. Asia (mostly China) would continue to dominate solar PV
power in terms of total installed capacity, with a share of more than 50% by 2050, followed by North America (20%)
and Europe (10%).
n SCALING UP SOLAR PV ENERGY INVESTMENT IS CRITICAL TO ACCELERATING THE GROWTH OF
INSTALLATIONS OVER THE COMING DECADES. Globally this would imply a 68% increase in average annual
solar PV investment from now until 2050 (to USD 192 billion/yr). Solar PV investment stood at USD 114 billion/
yr in 2018.
n INCREASING ECONOMIES OF SCALE AND FURTHER TECHNOLOGICAL IMPROVEMENTS WILL CONTINUE
TO REDUCE THE COSTS OF SOLAR PV. Globally, the total installation cost of solar PV projects would continue
to decline in the next three decades. This would make solar PV highly competitive in many markets, with the
average falling in the range of USD 340 to 834 per kilowatt (kW) by 2030 and USD 165 to 481/kW by 2050,
compared to the average of USD 1 210/kW in 2018.
The levelised cost of electricity (LCOE) for solar PV is already competitive compared to all fossil fuel generation
sources and is set to decline further as installed costs and performance continue to improve. Globally, the
LCOE for solar PV will continue to fall from an average of USD 0.085 per kilowatt-hour (kWh) in 2018 to
between USD 0.02 to 0.08/kWh by 2030 and between USD 0.014 to 0.05/kWh by 2050.
n THE SOLAR PV INDUSTRY IS A FAST-EVOLVING INDUSTRY, CHANGING RAPIDLY THANKS TO INNOVATIONS
ALONG THE ENTIRE VALUE CHAIN AND FURTHER RAPID COSTS REDUCTIONS ARE FORESEEN. First-
generation technologies remain the principal driver of solar industry development and still hold the majority of
the market value. Tandem and perovskite technologies also offer interesting perspectives, albeit in the longer
term several barriers still need to be overcome. The emergence of new cell architectures has enabled higher
efficiency levels. In particular, the most important market shift in cell architecture has resulted from bifacial cells
and modules, driven by the increased adoption of advanced cell architecture, such as passive emitter and rear cell
(PERC), and by its compatibility with other emerging innovations, such as half-cut cells and others.
n TAKING ADVANTAGE OF FAST-GROWING SOLAR PV CAPACITY ACROSS THE GLOBE, SEVERAL RESEARCH
PROJECTS AND PROTOTYPES ARE ONGOING TO STIMULATE FUTURE MARKET GROWTH BY EXPLORING
INNOVATIVE SOLAR TECHNOLOGIES AT THE APPLICATION LEVEL. One example is building-integrated
photovoltaic (BIPV) solar panels. BIPV solutions offer several advantages, such as multifunctionality (they
can be adapted to a variety of surfaces), cost-efficiency (savings on roofing material, labour/construction,
refurbishment and renovation costs), versatility and design flexibility in size, shape and colour.
-8-FUTURE OF SOLAR PV EXECUTIVE SUMMARY
Solar panels have improved substantially in their efficiency and power output over the last few decades. In
2018, the efficiency of multi-crystalline PV reached 17%, while that of mono-crystalline reached 18%. This
positive trend is expected to continue through to 2030. Yet, as the global PV market increases, so will the
need to prevent the degradation of panels and manage the volume of decommissioned PV panels leading to
circular economy practises. This includes innovative and alternative ways to reduce material use and module
degradation, and opportunities to reuse and recycle PV panels at the end of their lifetime.
n TECHNOLOGICAL SOLUTIONS AS WELL AS ENABLING MARKET CONDITIONS ARE ESSENTIAL TO
PREPARE FUTURE POWER GRIDS TO INTEGRATE RISING SHARES OF SOLAR PV. To effectively manage
large-scale variable renewable energy sources, flexibility must be harnessed in all sectors of the energy system,
from power generation to transmission and distribution systems, storage (both electrical and thermal) and,
increasingly, flexible demand (demand-side management and sector coupling). Some countries, particularly
in Europe, have achieved much higher shares in 2017: the VRE share in Denmark reached 53%, in South
Australia 48%, and in Lithuania, Ireland, Spain and Germany over 20%. Globally, to integrate 60% variable
renewable generation (of which 25% from solar PV) by 2050, average annual investments in grids, generation
adequacy and some flexibility measures (storage) would need to rise by more than one-quarter to USD 374
billion/year, compared to investments made in electricity networks and battery storage in 2018 (USD 297
billion/year).
n INNOVATIVE BUSINESS MODELS AND COST COMPETITIVENESS OF SOLAR PV ARE DRIVING THE
REDUCTIONS IN SYSTEM PRICES. The deployment of rooftop solar PV systems has increased significantly
in recent years, in great measure thanks to supporting policies, such as net metering and fiscal incentives-
which in some markets make PV more attractive from an economic point of view than buying electricity from
the grid- PV-hybrid minigrid, virtual power plants and utility PPA. The competitiveness of distributed solar
power is clearly evident amid rising deployment in large markets, such as Brazil, China, Germany and Mexico,
however important differences remain between countries, which highlight the further improvement potential.
n IF ACCOMPANIED BY SOUND POLICIES, THE TRANSFORMATION CAN BRING SOCIO-ECONOMIC BENEFITS.
The solar PV industry would employ more than 18 million people by 2050, five times more than the 2018 jobs
total of 3.6 million. To maximise outcomes of the energy transition, however, a holistic policy framework is
needed. Deployment policies will need to co-ordinate and harmonise with integration and enabling policies.
Under the enabling policy umbrella, particular focus is needed on industrial, financial, education and skills
policies to maximise the transition benefits. Education and skills policies can help equip the workforce with
adequate skills and would increase opportunities for local employment. Similarly, sound industrial policies
that build upon domestic supply chains can enable income and employment growth by leveraging existing
economic activities in support of solar PV industry development.
n U NLEASHING THE MASSIVE POTENTIAL OF SOLAR PV IS CRUCIAL TO ACHIEVE CLIMATE TARGETS.
This is only possible by mitigating the current barriers at different scales (policy; market and economic;
technology; regulatory, political and social). Grid integration and grid flexibility, economies of scale, access
to finance, lack of standards and quality measures, consumer awareness are among the key barriers that
could hinder the deployment of solar PV capacities in the next three decades. Mitigating the existing barriers
immediately, through a range of supportive policies and implementation measures including innovative
business models, financial instruments is vital to boost future deployment of solar PV capacities to enable
the transition to a low-carbon, sustainable energy future.
-9-FUTURE OF SOLAR PV EXECUTIVE SUMMARY
Figure ES 1. Status and future of solar photovoltaics (PV) - Tracking progress to
accelerate solar PV deployment to achieve Paris Climate targets
ON/OFF
2010 2018 2030 2050
TRACK
CO2 EMISSIONS (ENERGY-RELATED) AND REDUCTION POTENTIAL BY SOLAR PV POWER
Energy-related CO2 emissions under
current plans and planned policies
(Reference Case) (Gt CO2 /yr)
29.7 34.5 35 33.1
Energy-related CO2 emissions under
IRENA‘s climate resilient pathway
(REmap Case) (Gt CO2 /yr)
29.7 34.5 24.9 9.8 Off track
Avoided emissions due to accelerated
deployment of solar PV coupled with
deep electrification (Gt CO2/yr)
(REmap Case)
4.9
REMAP CASE ON/OFF
2010 2018
2030 2050 TRACK
SOLAR PV POWER IN TOTAL GENERATION MIX
Solar PV generation share (%)
0.2 % 2% 13 % 25 %
Progress
TOTAL INSTALLED CAPACITY
Solar PV (GW)
Off track
39 480 2 840 8 519
ANNUAL DEPLOYMENT
Solar PV (GW/yr)
94 270 372
17 Progress
TOTAL INSTALLATION COST
Solar PV (USD/kW)
Progress
4 621 1 210 834 – 340 481 – 165
LEVELIZED COST OF ELECTRICITY (LCOE)
- 10 -
Solar PV (USD/kWh)
0.37 0.085 0.08 – 0.02 0.05 – 0.01 On track0.2 % 2% 13 % 25 %
Progress
FUTURE OF SOLAR PV EXECUTIVE SUMMARY
TOTAL INSTALLED CAPACITY
Solar PV (GW)
Off track
39 480 2 840 8 519
ANNUAL DEPLOYMENT
Solar PV (GW/yr)
94 270 372 ON/OFF
172010 2018 2030 2050 Progress
TRACK
TOTAL INSTALLATION COST
CO2 EMISSIONS (ENERGY-RELATED) AND REDUCTION POTENTIAL BY SOLAR PV POWER
Solar PV (USD/kW)
Energy-related CO2 emissions under Progress
current plans and planned policies 4 621 1 210 834 – 340 481 – 165
(Reference Case) (Gt CO2 /yr)
29.7 34.5 35 33.1
LEVELIZED COST OF ELECTRICITY (LCOE)
Energy-related CO2 emissions under
IRENA‘s climate resilient pathway
(REmap Case) (Gt CO2 /yr)
Solar PV (USD/kWh)
29.7 34.5 24.9 9.8 Off track
0.37 0.085 0.08 – 0.02 0.05 – 0.01 On track
Avoided emissions due to accelerated
deployment of solar PV coupled with
deep electrification (Gt CO2/yr)
AVERAGE ANNUAL INVESTMENT (REmap Case)
4.9
165 192
Solar PV (USD billion/yr)
77 114 REMAP CASE ON/OFF
2010 2018 Progress
2030 2050 TRACK
EMPLOYMENT
SOLAR PV POWER IN TOTAL GENERATION MIX
* The data denoted solar PV sector jobs by 2012
Solar PV (million)
Solar PV generation share (%) Progress
0.2 %
1.36* 2%
3.6 13 %
11.7 25 %
18.7
Progress
*The data denoted wind sector jobs by 2012
TOTAL INSTALLED CAPACITY
Solar PV (GW)
Off track
39 480 2 840 8 519
ANNUAL DEPLOYMENT
Solar PV (GW/yr)
94 270 372
17 Progress
TOTAL INSTALLATION COST
Solar PV (USD/kW)
Progress
4 621 1 210 834 – 340 481 – 165
LEVELIZED COST OF ELECTRICITY (LCOE)
- 11 -
Solar PV (USD/kWh)
0.37 0.085 0.08 – 0.02 0.05 – 0.01 On trackFUTURE OF SOLAR PV ENERGY TRANSFORMATION PATHWAYS AND SOLAR PV
1. E NERGY TRANSFORMATION PATHWAYS
AND SOLAR PV
1.1 PATHWAYS FOR THE GLOBAL ENERGY TRANSFORMATION
The International Renewable Energy Agency (IRENA) current and planned policies (the Reference Case),
has explored global energy development options from and the second is a cleaner, climate-resilient pathway
two main perspectives to the year 2050 as part of the based largely on a more ambitious, yet achievable,
2019 edition of its Global Energy Transformation report uptake of renewable energy and energy efficiency
(IRENA, 2019a). The first is an energy pathway set by measures (the REmap Case).1
Box 1. PRACTICAL OPTIONS FOR GLOBAL ENERGY DECARBONISATION
IRENA’s renewable energy roadmap, or REmap approach¹ and analysis, includes several key steps (IRENA, 2019a):
• Identifying the current plans for global energy development as a baseline scenario (or Reference Case) as far
as 2050. This presents a scenario based on governments’ current energy plans and other planned targets and
policies, including climate commitments made since 2015 in Nationally Determined Contributions under the
Paris Agreement.
• Assessing the additional potential for scaling up or optimising low-carbon technologies and approaches, including
renewable energy, energy efficiency and electrification, while also considering the role of other technologies.
• Developing a realistic, practical energy transformation scenario, referred to as the “REmap Case”. This calls for
considerably faster deployment of low-carbon technologies, based largely on renewable energy and energy
efficiency, resulting in a transformation in energy use to keep the rise in global temperatures this century well
below 2 °C and closer to 1.5 °C compared to pre-industrial levels. The scenario focuses primarily on cutting
energy-related carbon-dioxide (CO₂) emissions, which make up around two-thirds of global greenhouse gas
emissions.
• Analysing the costs, benefits and investment needs of low-carbon technologies worldwide to achieve the
envisaged energy transformation.
Note: The findings in this report consider policy targets and developments until April 2019. Any new policy changes and targets
announced since then are not considered in the analysis and therefore could influence the findings presented in this report.
The findings in this report are based on IRENA’s climate-resilient
pathway (REmap Case), which is well below 2 °C and closer to the 1.5 °C
carbon budget levels provided in the IPCC Special Report on Global
Warming of 1.5 °C (SR1.5).
1 For more on the global roadmap and its underlying analysis, see www.irena.org/remap.
- 12 -FUTURE OF SOLAR PV ENERGY TRANSFORMATION PATHWAYS AND SOLAR PV
1.2 THE ENERGY TRANSFORMATION RATIONALE
Reducing energy-related CO₂ emissions is at the heart Second, air quality improvements. Air pollution
of the energy transformation. Rapidly shifting the is a major public health crisis, mainly caused by
world away from the consumption of fossil fuels that unregulated, inefficient and polluting energy sources,
cause climate change and towards cleaner renewable (e.g. fossil fuel combustion, chemical-related
forms of energy is critical if the world is to reach the emissions). The switch to clean renewable energy
climate goals agreed in Paris. There are many drivers sources would improve the air quality in cities and bring
behind this transformation (Figure 1). greater prosperity by reducing ill health and increasing
productivity. With the rise in usage of renewables,
First, the rapid decline in renewable energy costs. drop in net energy subsidies, would potentially lead to
The global weighted average cost of electricity decline in health costs from air pollution and climate
from all commercially available renewable power effects. The savings from reduced externalities with
generation technologies continued to fall in 2018. For respect to air pollution and climate change along with
example, the fall in the cost of electricity from utility- avoided subsidies outweigh the additional energy
scale solar photovoltaic (PV) projects since 2010 system. For every dollar invested in transforming the
has been remarkable – between 2010 and 2018 the global energy system over the period to 2050, there is
global weighted average levelised cost of electricity a payoff of at least USD 3 and potentially more than
(LCOE) from solar PV declined by 77%. Recent USD 7, depending on how externalities are valued
record low auction outcomes for solar PV in Abu (IRENA, 2019a).
Dhabi, Chile, Dubai, Mexico, Peru and Saudi Arabia
have shown that an LCOE of USD 0.03 per kilowatt Thirdly, reduction of carbon emissions. The gap
hour (kWh) is possible in a wide variety of national between observed emissions and the reductions that
contexts (IRENA, 2018). Similarly, in Europe offshore are needed to meet internationally agreed climate
wind projects are now increasingly competing objectives is widening. The transformation of the
with fossil-fired sources on a subsidy-free basis in global energy system needs to accelerate substantially
wholesale electricity markets (e.g. subsidy-free bids to meet the objectives of the Paris Agreement, which
in Germany and the Netherlands), while in the United aim to keep the rise in average global temperatures
States non-hydropower renewable energy resources to closer to 1.5 degrees Celsius (°C) in the present
such as solar PV and wind are expected to be the century, compared to pre-industrial levels. A 70%
fastest-growing source of electricity generation in reduction in energy-related emissions would needed
the next two years. by 2050 compared to current levels (IRENA, 2019a).
- 13 -FUTURE OF SOLAR PV ENERGY TRANSFORMATION PATHWAYS AND SOLAR PV
Then, transforming the global energy system would Finally, transforming the global energy system would
also improve energy security and enhance affordable also bring significant socio-economic benefits,
and universal energy access. For countries heavily which are crucial to influencing any political decision.
dependent on imported fossil fuels, energy security The development of a local renewable energy industry
is a significant issue. Renewables can provide an has the potential to create jobs that can accommodate
alternative by increasing the diversity of energy men and women from all disciplines and backgrounds.
sources through local generation, thus contributing to Should local industries not be developed, countries
the flexibility of the system and resistance to shocks. with energy security problems would just move from
Similarly, energy access is an area of great inequality importing fossil fuels to importing renewable energy
and renewable energy technologies can be applied in equipment (IRENA, 2019a; IRENA, 2019b).
rural areas where the grid has yet to reach, harnessing
rural electrification, community energy initiatives and
distributed energy resources (DER).
Figure 1: Pressing needs and attractive opportunities are driving the ongoing energy transformation
REDUCED FALLING
CARBON EMISSIONS ENERGY COSTS
70% lower Renewables
fully competitive
REDUCED
IMPACT, GREATER
ECONOMIC GAIN ENERGY JOB CREATION
USD 3-7 payoff TRANSFORMATION 7 million
for each by 2050 more jobs
USD 1 spent economy-wide
IMPROVED FULL ENERGY
ENERGY SECURITY ACCESS
-64% demand 100% energy
of fossil fuels access
Note: The key drivers for energy transformation presented in this figure is based on IRENA’s REmap Case by 2050 compared to current levels.
Source: (IRENA, 2019b)
CO₂ EMISSION REDUCTIONS AS A MAJOR GOAL
Decarbonising the energy sector and reducing carbon emissions to
limit climate change are at the heart of IRENA’s energy transformation
roadmaps, which examine and provide an ambitious, yet technically
and economically feasible, pathway for the deployment of low-carbon
technology towards a sustainable and clean energy future.FUTURE OF SOLAR PV ENERGY TRANSFORMATION PATHWAYS AND SOLAR PV
1.3 GLOBAL ENERGY TRANSFORMATION: THE ROLE OF SOLAR PV
Climate change has become a major concern of this reductions needed by 2050. If additional reductions
century. The Paris Agreement establishes a mechanism from direct use of renewables are considered, the
to limit global temperature rise to “well below 2 °C”, share increases to 75%. When adding energy efficiency,
and ideally to 1.5 °C, compared to pre-industrial levels. the share increases to over 90% of the energy-related
The profound transformation of the global energy CO₂ emission reductions needed to set the world on
landscape is essential to realise the agreement’s a pathway to meeting the Paris Agreement targets
climate targets. Such a transformation is possible with (Figure 2) (IRENA, 2019a).
the rapid deployment of low-carbon technologies in
place of conventional fossil fuel generation and uses. The energy transformation would also boost gross
domestic product by 2.5% and total employment
To set the world on a pathway towards meeting the by 0.2% globally by 2050. In addition, it would bring
aims of the Paris Agreement, energy-related CO₂ broader social and environmental benefits. Health,
emissions need to be reduced by around 3.5% per subsidy and climate-related savings would be worth as
year from now until 2050, with continued reductions much as USD 160 trillion cumulatively over a 30-year
thereafter. The transition to increasingly electrified period. Thus, every dollar spent in transforming the
forms of transport and heat, when combined with global energy system provides a payoff of at least
increases in renewable power generation, would USD 3 and potentially more than USD 7, depending on
deliver around 60% of the energy-related CO₂ emission how externalities are valued (IRENA, 2019a).
Figure 2: Renewables and efficiency measures, boosted by substantial electrification, can provide over 90% of
the necessary CO₂ emission reductions by 2050
Energy related CO2 emissions (Gt/yr)
35
CURRENT PLANS 33 Gt in 2050
Buildings Electrification
30 of heat and
Buildings transport w/RE: Renewable
Transport 36% energy and
25 electrification
District heat deliver 75%
Transport 70% emission
reductions
Renewable of emission
energy:
20 resulting reductions
Power 39%
District heat from the
Energy
15 Transformation Energy
Industry efficiency
and others:
Power
25%
10
ENERGY TRANSFORMATION
9.8 Gt in 2050
5
Industry
0
2010 2015 2020 2025 2030 2035 2040 2045 2050
Note: “Renewables” implies deployment of renewable technologies in the power sector (wind, solar PV, etc.) and direct end-use applications (solar
thermal, geothermal, biomass). “Energy efficiency” includes efficiency measures deployed in end-use applications in the industrial, buildings
and transport sectors (e.g. improving insulation of buildings or installing more efficient appliances and equipment). “Electrification” denotes
electrification of heat and transport applications, such as deploying heat pumps and electric vehicles (EVs); Gt = gigatonne; w/RE = with
renewable energy.
Source: (IRENA, 2019a)
- 15 -FUTURE OF SOLAR PV ENERGY TRANSFORMATION PATHWAYS AND SOLAR PV
Scaling up electricity from renewables is crucial buildings would double. In transport, it would increase
for the decarbonisation of the world’s energy from just 1% today to over 40% by 2050 (IRENA, 2019a).
system. The most important synergy of the global
energy transformation comes from the combination Solar, along with wind energy, would lead the way
of increasing low-cost renewable power technologies in the transformation of the global electricity sector.
and the wider adoption of electricity for end-use Wind power would be one of the major electricity
applications in transport and heat. To deliver the energy generation sources, supplying more than one-third of
transition at the pace and scale needed would require total electricity demand. Solar PV power would follow,
almost complete decarbonisation of the electricity supplying 25% of total electricity demand, which would
sector by 2050. The REmap Case sets a pathway to represent over a tenfold rise in the solar PV share of
achieve a share of 86% for renewables in the power the generation mix by 2050 compared to 2016 levels.
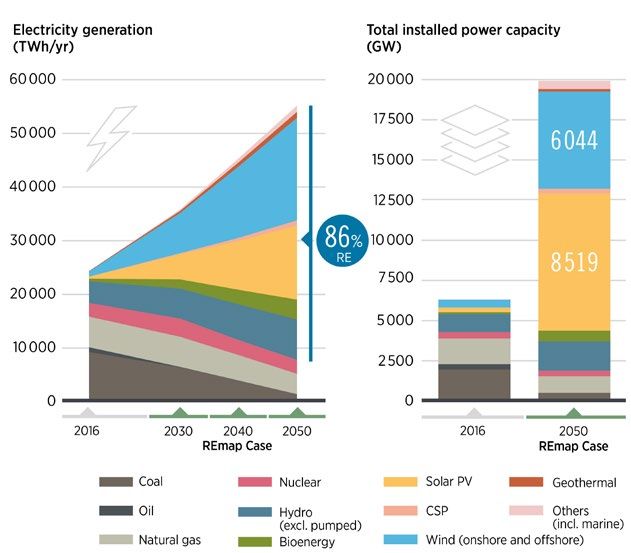
generation mix by 2050 (Figure 3). On the end use side, In the context of total installed capacity by 2050,
the share of electricity in final energy consumption much greater capacity expansion would be needed for
would increase from just 20% today to almost 50% by solar PV (8 519 gigawatts [GW]) as compared to wind
2050. The share of electricity consumed in industry and (6 044 GW).2
SOLAR PV- A PROMIENT GENERATION SOURCE BY 2050
Alongside wind energy, solar PV would lead the way in the transformation
of the global electricity sector. Cumulative installed capacity of solar PV
would rise to 8 519 GW by 2050 becoming the second prominent source
(after wind) by 2050.
2 A similar forthcoming IRENA working paper on wind explores the role of wind in the context of the global energy transformation to 2050 and will
available to download: www.irena.org/publications.
- 16 -FUTURE OF SOLAR PV ENERGY TRANSFORMATION PATHWAYS AND SOLAR PV
Figure 3: Solar PV would have the largest installed capacity expansion by 2050
Notes: CSP = concentrating solar power; TWh = terawatt hour.
Source: IRENA (2019a).
- 17 -FUTURE OF SOLAR PV ENERGY TRANSFORMATION PATHWAYS AND SOLAR PV
SOLAR PV: ITS POTENTIAL TO MITIGATE emissions reduction potential by 2050. This is mainly
ENERGY-RELATED CARBON EMISSIONS due to the significant deployment of solar power
replacing conventional power generation sources by
Deploying more than 8 500 GW of solar power utilising the ample resource availability with the best
– capable of generating more than 25% of total technological solutions at better resource locations
electricity needs in 2050 – can potentially mitigate across various regions and benefiting from drastic
a significant amount of emissions (4.9 Gt CO₂). cost reductions, significant end-use electrification
This represents 21% of the total emission reduction of transport and heat applications, shifting energy
potential from renewables and energy efficiency demand to electricity that can then be supplied by
measures (Figure 4). Among all low-carbon wind (either directly or indirectly, for example power-
technology options, solar PV contributes to major to-hydrogen) and rising socio-economic benefits.
Figure 4: Solar pv would contribute to 4.9 Gt of CO₂ emissions reductions in 2050, representing 21% of the
overall energy-sector emissions reductions needed to meet paris climate goals
2050: >90% emissions reductions from
Annual energy-related CO2 emissions (Gt CO2/yr)
renewables, energy efficiency measures
40 with substantial electrification.
34.5 Reduction potentials in 2050
35 33.1
Wind; 27%
30
Energy efficiency; 24%
25
Solar PV; 21%
20 Other RE (power)
and electrification of
15 heat and transport; 16%
10 Renewables
(direct end-use); 12%
5 9.8
0
Current plans and policies Energy Transformation
2018 2050 2050
ACCELERATED SOLAR PV DEPLOYMENTS CONTRIBUTES TO CO₂
EMISSIONS REDUCTIONS
Among all low-carbon technology options, accelerated deployment
of solar PV when coupled with deep electrification would contribute
to almost one-fifth of the total emissions reductions needed
(nearly 4.9 Gt CO₂) in 2050
- 18 -FUTURE OF SOLAR PV T HE EVOLUTION AND FUTURE OF SOLAR PV MARKETS
2. THE EVOLUTION AND FUTURE OF
SOLAR PV MARKETS
2.1 EVOLUTION OF THE SOLAR PV INDUSTRY
Rising concerns about climate change, the health The evolution of the solar PV industry so far has
effects of air pollution, energy security and been remarkable, with several milestones achieved
energy access, along with volatile oil prices in in recent years in terms of installations (including
recent decades, have led to the need to produce off-grid), cost reductions and technological
and use alternative, low-carbon technology advancements, as well as establishment of key solar
options such as renewables. Solar PV has been energy associations (Figure 5).
one of the pioneering renewable technologies over
the decades. The total installed capacity of solar Solar power will clearly continue to be an essential
PV reached 480 GW globally (excluding CSP) by renewables option in the coming decades. This
the end of 2018, representing the second-largest working paper sheds light on the prominent role of
renewable electricity source after wind. Last year, solar PV in transforming the global energy landscape
solar PV again dominated total renewable and power by 2050. The following sections present an accelerated
capacity additions, adding twice as much capacity deployment pathway for solar PV until 2050 under
as wind and more than all fossil fuels and nuclear the REmap Case from IRENA’s global energy
together, solar PV additions reaching around 94 GW transformation roadmap, together with perspectives
(IRENA, 2019c). on cost reductions, technology trends and the need to
prepare future grids for rising shares of solar PV.
- 19 -FUTURE OF SOLAR PV T HE EVOLUTION AND FUTURE OF SOLAR PV MARKETS
Figure 5: Major milestones achieved by the solar industry
1941 1963
• First silicon monocrystalline cell is created • Mass production of solar cells begins
1973
• The first solar building
1954 “Solar One” is
• International Solar Energy Society is formed constructed and
running on a hybrid
supply of solar thermal
and solar PV power.
1985
2012 • The University of
South Wales achieves
• The world’s cumulative PV electricity capacity
20% efficiency for
surpasses 100 gigawatts (GW)
silicon cells
2010
• Global average solar PV auction price:
241 USD/MWh
2015
• The Global Solar Council, the International
Solar Alliance and Solar Power Europe are formed
KEY MILESTONES
IN SOLAR INDUSTRY
2016
• First solar plane flight
around the world 2018
• Global installed solar capacity: 480 GW
• Global average solar PV auction price 85 USD/MWh
• Off-grid solar PV reaches 2.94 GW (0.25 GW in 2008)
2017
• 4.5 million jobs in solar energy sector
• Global PV capacity ~400 GW
SOLAR PV: A FAST-GROWING AND MATURE RENEWABLE
ENERGY TECHNOLOGY
Solar PV is one of the fastest-growing, most mature and
cost-competitive renewable energy technologies.
- 20 -FUTURE OF SOLAR PV T HE EVOLUTION AND FUTURE OF SOLAR PV MARKETS
2.2 SOLAR PV OUTLOOK TO 2050
ACCELERATED UPTAKE AND EMERGING is expected to continue driving overall renewables
MARKETS growth in several regions over the next decade.
From today’s levels, IRENA’s REmap analysis shows
The deployment of renewables has been growing that solar PV power installations could grow almost
at a rapid pace in recent years, reaching record six fold over the next ten years, reaching a cumulative
levels and outpacing annual conventional power capacity of 2 840 GW globally by 2030 and rising
capacity additions in many regions. Among all to 8 519 GW by 2050.3 This implies total installed
renewable technologies, solar PV power installations capacity in 2050 almost eighteen times higher than
have been dominating the renewables industry in 2018 (Figure 6). At a global level, around 60% of
for many years. As of the end of 2018, the global total solar PV capacity in 2050 would be utility scale,
capacity of installed and grid-connected solar PV with the remaining 40% distributed (rooftop). While
power reached 480 GW (Figure 6), representing 20% utility-scale projects still predominate in 2050,
year-on-year growth compared to 2017 (386 GW) the REmap analysis expects distributed solar PV
and a compound annual growth rate (CAGR) of installations to grow more rapidly, driven by policies
nearly 43% since 2000 (IRENA, 2019c). and supportive measures, as well as consumer
engagement in the clean energy transformation.
Considering ample resource availability, significant Recent trends in distributed solar PV and its benefits
market potential and cost competitiveness, solar PV are explored in Box 1 below.
3 In the REmap analysis, installed solar PV capacity includes utility-scale (60–80%), distributed rooftop (40–20%) and increased electricity access.
- 21 -FUTURE OF SOLAR PV T HE EVOLUTION AND FUTURE OF SOLAR PV MARKETS
Figure 6: Compared to 2018 levels, cumulative solar PV capacity is expected to grow sixfold by 2030,
with a CAGR of nearly 9% up to 2050
9 000
Historical Projections 8 519 (2050)
43% 8.9%
CAGR 2000–18 CAGR 2019–50
8 000
7 000
Cumulative installed capacity (GW)
6 000
5 000
4 000
2 840 (2030)
3 000
2 000
480 (2018)
1 000
1 (2000)
0
2000 2005 2010 2015 2020 2025 2030 2035 2040 2045 2050
Sources: Historical values based on IRENA’s renewable energy statistics (IRENA, 2019c) and future projections based on IRENA’s analysis (2019a).
RAPID GROWTH IN SOLAR PV INSTALLATIONS TO 2050
The global installed capacity of solar PV would rise six-fold by
2030 (2 840 GW) and reach 8 519 GW by 2050 compared to installations
in 2018 (480 GW).
- 22 -FUTURE OF SOLAR PV T HE EVOLUTION AND FUTURE OF SOLAR PV MARKETS
Box 2. D EPLOYMENT OF ROOFTOP SOLAR PV SYSTEMS
FOR DISTRIBUTED GENERATION
Distributed energy resources (DER) are small or medium-sized power sources that are mainly connected to
the lower voltage levels of the system (distribution grid), near the end users. They can potentially provide
services to the power system (European Commission, 2015). In the context of solar PV, distributed generation
comes from plants connected at low and medium voltages, such as solar PV panels on rooftops.
The deployment of rooftop solar PV systems has increased significantly in recent years, as has distributed
storage, in great measure thanks to supporting policies, mainly net metering and fiscal incentives, and falling
costs. For example, behind-the-meter storage business models allow consumers to store the electricity
generated by rooftop solar PV and consume it later when needed or sell it to the grid.
In 2018 distributed-scale solar PV capacity additions amounted to approximately 43 GW (IEA, 2018a). China
represents the leading solar market not only in Asia, but also in the world, with distributed plants contributing
47% of the capacity installed in 2018. Distributed solar has been growing in India as well, where installed
rooftop capacity reached 6 GW in 2018, representing the addition of over 2.5 GW over the previous year
(SolarPower Europe, 2019a). This increase, however, is marginal when compared to utility-scale installations
in India, which represented 82% of cumulative installed capacity, while distributed represented just 10%.
As such, policy support is required to intensify off-grid and rooftop installations across the country.
Another player in the region is the Republic of Korea, which has made the expansion of distributed power
production a policy goal for its energy planning. This is to overcome issues related to its mountainous
terrain, which makes the development of large utility-scale PV plants difficult. The national energy plan aims
to increase distributed power generation to reach 18.4% of total generation by 2030, compared to the current
11.2% (SolarPower Europe, 2019a).
In Latin America, Mexico has witnessed strong growth in installed solar capacity, also thanks to a boom in
distributed solar – it currently has more than 100 000 solar roofs on homes and on industrial and commercial
buildings. The competitiveness of distributed solar is supported by its low installation costs and savings of
up to 95% per month on the electricity rates paid by users (SolarPower Europe, 2019a). Distributed solar PV
has grown significantly in Brazil as well, where newly added capacity amounted to 390 MW in 2018, mainly
due to the increasing competitiveness of the net-metering regulation throughout the country. According to
the Brazilian Solar Energy Association (ABSOLAR), this growth is expected to more than double in 2019
(SolarPower Europe, 2019a)
Globally investment in small-scale distributed solar PV systems (smaller than 1 megawatt [MW]) amounted
to USD 36.3 billion in 2018, a decrease of 15% from 2017 levels. Whilst Germany, Australia, India, Japan
and the Netherlands remained significant markets at over USD 1 billion each, the United States, which
is the biggest market for small-scale solar, witnessed a decrease of 15% year on year to USD 8.9 billion
(REN21, 2019).
There are several examples of DER increasingly being deployed globally. For instance, the sonnenCommunity
is an aggregator in Germany consisting of about 10 000 customers with solar PV generation, battery storage,
or both. The aggregator was launched in 2015 mostly for peer-to-peer trading as a virtual power plant
(VPP), but as of 2017 the VPP became available to the power grid to provide grid services such as frequency
regulation. Compared to alternatives, such as pumped hydro storage, this distributed “virtual” storage
resource can react very quickly (in sub-seconds), making it a great provider of primary frequency services
to grid operators. A small part of this storage is made available to the German power grid. This reduces both
variability in renewable generation and expensive grid expansion requirements (IRENA, 2019d).
- 23 -FUTURE OF SOLAR PV T HE EVOLUTION AND FUTURE OF SOLAR PV MARKETS
The global solar market in 2018 was dominated by Europe would represent the third-highest region by
Asia, accounting for over half of the world’s addition 2030, with 291 GW of solar PV capacity installed. A
of solar capacity. The region’s installed solar capacity similar picture is expected on a 2050 horizon, when
reached 280 GW by the end of 2018, dominated by Asia would still dominate the scene at almost half of
China with 175 GW. The European Union represented the cumulative global capacity installed (4 837 GW).
the world’s second-largest solar PV market, mainly Within Asia, China would dominate the scene, with a
driven by Germany with 45 GW cumulative installed CAGR of 9% after 2018 leading to projected capacity
capacity by the end of 2018, followed by North of around 2 803 GW by 2050. North America would
America with 55 GW (Figure 7), of which the United still have the second-largest installed capacity,
States accounted for 90% (IRENA, 2019a). reaching 1 728 GW by 2050, with the United States
still dominating the region. Europe could still hold
Under the REmap scenario Asia would continue the third place among regions in 2050, with 891 GW
to lead global solar PV installations, with 65% of of total solar PV capacity installed. More than 22%
the total capacity installed by 2030 (Figure 7). of these installations would be in Germany, where
Within Asia significant deployment would be seen the installed capacity is projected to reach around
in China, where installed capacity is projected to 200 GW by 2050. Even though installed capacity may
reach around 1 412 GW by 2030. North America remain highest in Asia, North America and Europe,
would have the second-highest installed solar PV market growth seems likely to shift to other regions,
capacity, reaching 437 GW by 2030, with more with large markets also expected to emerge in South
than 90% of these installations in the United States. America and Africa.
Figure 7: Among the world’s regions, Asia is poised to dominate global solar PV installations in the REmap
scenario, followed by North America and Europe
Solar PV installed capacities (GW) 4 837
1 728
1 860
891
437 291
121
55
2018 2030 2050 280
2018 2030 2050
EUROPE
NORTH AMERICA 2018 2030 2050
ASIA
673
8 131
2018 2030 2050
281 MIDDLE EAST
7 97
AND AFRICA
2018 2030 2050
LATIN AMERICA 10 25 109
AND CARIBBEAN
2018 2030 2050
OCEANIA
Disclaimer:
The designations employed and the presentation of material herein do not imply the expression of any opinion on the part of IRENA concerning
the legal status of any region, country, territory, city or area or of its authorities, or concerning the delimitation of frontiers or boundaries
Sources: Historical values based on IRENA’s renewable energy statistics (IRENA,2019c) and future projections based on IRENA’s analysis (2019a).
- 24 -FUTURE OF SOLAR PV T HE EVOLUTION AND FUTURE OF SOLAR PV MARKETS
Figure 8: Annual Global solar PV additions are expected to reach to 270 GW in 2030 and 372 GW in 2050
under the REmap scenario, compared with 94 GW in 2018
400
Historical Projections 2050 Total additions
(incl. replacements) of 372 GW
350
2030 Replacement of
existing capacity begins
Annual deployments (GW/yr)
300
250
200
2018 Record year of
150 maximum historical annual
additions (94 GW)
100
50
0
2000 2005 2010 2015 2020 2025 2030 2035 2040 2045 2050
Source: Historical values based on IRENA (2019b) and future projections based on IRENA (2019a).
Annual solar PV capacity gradually increased until compared to current levels, and by 2050 are fourfold
2011, with a drop observed in 2012 (Figure 8). higher than additions in 2018 (372 GW vs 94 GW per
Then annual capacity growth rose and fell until the year) (Figure 8).
end of 2014. 2018 marked a record year, when
94 GW of solar PV were added to the global power Currently, annual additions are largely driven by
capacity mix, driven by tremendous cost reductions utility-scale projects, reflecting the policies and
due to technological enhancements, and policy and financial support in various countries. Whilst
supportive measures. distributed solar is picking up pace in a few countries,
such as Germany, at a global scale distributed levels
With continuous technological advancement and are still much lower. Mitigating existing barriers and
cost reductions, IRENA foresees the solar PV market promoting DER are important to scale up solar PV
growing rapidly over the next three decades. Along deployment in coming decades. On a positive note,
with capacity additions, replacement of solar panels the REmap analysis shows that after 2030, with
at the end of their lifetime is also essential and plays right market conditions for DER, distributed PV’s
a key role, especially with the benefit of old panels share of annual additions could start rising and even
giving way to advanced technologies. Annual capacity dominate total PV additions in some countries (see
additions would more than double by 2030 (270 GW) Box 3 above).
SIGNIFICANT GROWTH IN ANNUAL SOLAR PV ADDITIONS TO 2050
Annual capacity additions for solar PV would more than double to
270 GW in 2030, and reach more than 350 GW in the next 30 years,
compared to 94 GW added in 2018.
- 25 -FUTURE OF SOLAR PV T HE EVOLUTION AND FUTURE OF SOLAR PV MARKETS
Box 3. SOLAR PV FOR OFF-GRID SOLUTIONS
Off-grid (or stand-alone) applications are typically used where there is no electric grid or when the cost of
connecting to the grid is high. Applications are normally smaller than other system types and are often used
for small-scale projects in rural areas, as a solution in developing countries, as well as for residential households
willing to disconnect from the grid (typically not the most economic or efficient option) (IRENA, 2017a).
A key feature of off-grid renewable energy solutions is that they offer rapidly deployable, reliable and,
in many cases, the most economically sustainable option to address the need for energy access (IRENA,
2018b). They can efficiently increase the resilience of energy systems, improve energy security, empower
communities, reduce local and regional CO₂ emissions and, depending on which systems are adopted,
foster energy price decreases (IRENA, 2019e).
Thanks to its modular and distributed nature, solar PV can be adapted to a wide range of off-grid applications
and to local conditions, ranging from lanterns to household systems to village-powering mini-grids. In the last
decade (2008–18), the global installed capacity of off-grid solar PV has grown more than ten times, from roughly
0.25 GW in 2008, to 2.94 GW in 2018 (Figure 9). Currently, off-grid solar solutions constitute about 85% of all
off-grid energy installations, comprising of solar home systems (about 50%) and solar lanterns/solar lighting
systems (about 35%). This is followed by rechargeable batteries (10%) and mini-grids (2%) (IEA et al., 2019).
Figure 9: Global power capacity, off-grid solar PV, 2008–18
GW
3 2.94
2.56
Global annual capacity (GW)
t h
row 1.98
2 dg
fol
Ten
1.52
1.19
1 0.90
0.67
0.51
0.39
0.25 0.31
0
2008 2009 2010 2011 2012 2013 2014 2015 2016 2017 2018
Source: IRENA (2019a).
The convergence of several factors has enabled such rapid growth. Firstly, the rapid decrease of PV module
costs has meant that off-grid solar PV solutions are now a cost-competitive choice for expanding energy
access. Since 2009 such costs have fallen by more than 80%, while globally the cost of solar PV power
declined by 73% from 2010 to 2017 (IRENA, 2018b). Secondly, the decrease in technology costs has unlocked
innovation in the delivery models and financing models to make technologies and energy services accessible
and affordable over the long term. This is the case in East Africa (especially Kenya), which has devised
different delivery models to reach unelectrified communities. Smaller systems, such as solar lights, are
predominantly based on direct cash sales, while larger systems have been deployed through lease-to-own or
fee-for-service approaches (IRENA, 2018b). Thirdly, because of accelerated deployment, investment in the
off-grid renewables sector has also grown strongly. Since 2014 annual investment in the stand-alone sector
increased to reach USD 284 million by 2017, and investment in the mini-grid sector grew from USD 16 million
in 2015 to USD 81 million in 2018 (IRENA, 2018b).
In the REmap analysis 100% electricity access is foreseen by 2030, in line with the Sustainable Development
Goals, and solar PV would be the major contributor to this achievement.
- 26 -You can also read