FY19 Full Year Results - 24 June 2019 Championing Successful Independents - Fastly

Page created by Tim Washington
 
CONTINUE READING
FY19 Full Year Results - 24 June 2019 Championing Successful Independents - Fastly
FY19 Full Year Results
24 June 2019

     Championing Successful Independents

                                           FY19 Full Year Results   0
FY19 Full Year Results - 24 June 2019 Championing Successful Independents - Fastly
Group update and
divisional results

Jeff Adams
Group Chief Executive Officer
FY19 Full Year Results - 24 June 2019 Championing Successful Independents - Fastly
Our purpose   Our vision                          Our values

Championing     Best store in town              We believe:
                                                Independence is worth fighting

Successful      Passionate about independents
                                                for; in treating our people,
                                                retailers and suppliers the way
                                                we like to be treated; and in
Independents    A favourite place to work       giving back to the communities
                                                where we live and work
                Business partner of choice

                Support thriving communities

                                                               FY19 Full Year Results   2
FY19 Full Year Results - 24 June 2019 Championing Successful Independents - Fastly
Group overview

 Reported results reflect adoption of the new Accounting Standard AASB15
 Reported Group sales (which excludes charge-through sales) increased 1.8% to $12.7bn
     Group sales (including charge-through sales) increased 1.4% to $14.6bn

   Group EBIT declined 1.4% to $330.0m
     Food EBIT decreased 3.0% to $182.7m
     Liquor EBIT increased 1.3% to $71.2m
     Hardware EBIT increased 17.2% to $81.2m
     Corporate EBIT was -$5.1m (FY18: +$6.7m) – FY18 included the reversal of a provision against the NSW DC insurance claim settled in 1H18

                                                                                                                                     FY19 Full Year Results   3
FY19 Full Year Results - 24 June 2019 Championing Successful Independents - Fastly
Group overview (continued)

 Underlying profit after tax1 decreased 3.0% to $210.3m
     Reversal of provision against NSW DC insurance claim in FY18, and increase in finance costs due to the $150m share buy-back in 1H19
 Underlying EPS up 1.8% to 22.6 cents reflecting the benefit of the share buy-back
 Statutory profit after tax of $192.8m (FY18: Loss of $148.2m)
     FY18 included a charge of $345.5m (post tax) related to the impairment of goodwill and other net assets
   Solid operating cash flows and strong balance sheet
   Final dividend of 7.0 cents per share, fully franked
   Working Smarter program completed – cumulative savings ~$125m
   MFuture (our next 5 year vision) now underway

1. FY19 Underlying profit after tax excludes Working Smarter restructure costs and SA DC transition costs of $17.5m (post tax). FY18 underlying profit after tax excludes Working Smarter restructure costs and HTH integration costs
of $19.6m (post tax), and impairment of goodwill and other net assets of $345.5m (post tax).                                                                                                                                            FY19 Full Year Results   4
FY19 Full Year Results - 24 June 2019 Championing Successful Independents - Fastly
Results – overview by pillar

                                                                                                              FY19                     FY181                 Change
                                                                                                               $m                        $m                       %
                                                                                                                                                                                 Sales revenue (%)
Sales revenue (including charge-through sales)                                                                                                                              (including charge-through)
Food                                                                                                      8,794.3                   8,768.6                      0.3%
Liquor                                                                                                    3,666.9                   3,474.0                      5.6%            15%
                                                                                                                                                                                                           Food
Hardware                                                                                                  2,102.0                   2,120.1                    (0.9%)                                      Liquor
Total sales revenue (including charge-through sales)                                                     14,563.2                 14,362.7                       1.4%         25%           60%            Hardware

Less: Charge-through sales2                                                                             (1,902.9)                 (1,920.5)                    (0.9%)
Total sales revenue (Statutory Accounts)                                                                 12,660.3                 12,442.2                       1.8%

EBIT                                                                                                                                                                                 EBIT (%)
Food                                                                                                         182.7                     188.3                   (3.0%)
Liquor                                                                                                         71.2                      70.3                    1.3%            24%                       Food
Hardware                                                                                                       81.2                      69.3                  17.2%                                       Liquor
                                                                                                                                                                                            55%            Hardware
Business Pillars                                                                                             335.1                     327.9                     2.2%
                                                                                                                                                                               21%
Corporate3                                                                                                     (5.1)                       6.7                         -
Total EBIT                                                                                                   330.0                     334.6                   (1.4%)

1. The FY18 results have been adjusted to reflect the adoption of the new Accounting Standard AASB15: Revenue from Contracts with Customers. A reconciliation is provided
   in Appendix 3 and Appendix 4.
2. Sales revenue has been adjusted to exclude charge-through sales to comply with AASB15.
3. Corporate EBIT in FY18 included the reversal of a provision against the Huntingwood, NSW DC hail insurance claim following settlement.                                                                FY19 Full Year Results   5
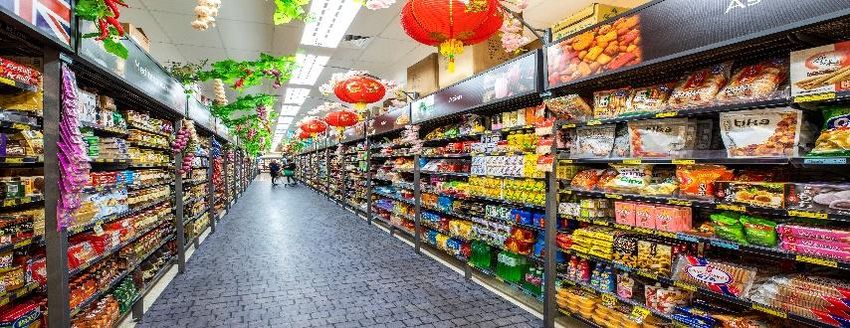
FY19 Full Year Results - 24 June 2019 Championing Successful Independents - Fastly
Food – sales
Supermarkets                                                                                                                                                                 FY19      FY18 Change
                                                                                                                                                                              $m        $m       %
 Total sales (including charge-through) declined 0.5% to $7.2bn
          Some improvement in highly competitive market conditions evident in 2H19                  Food
          Deflation1 continued to ease in 2H19 reflecting a reduction in the level of promotional   Supermarkets revenue (including charge-through)                     7,235.3    7,275.0          (0.5%)
           activity in the market                                                                    Charge-through sales                                                (957.9)     (936.8)           2.3%
           –    Deflation in 2H19 declined to -0.9% (1H19: -1.3%)                                    Supermarkets revenue (excluding charge-through)                     6,277.4    6,338.2         (1.0%)
           –    Deflation for the full year declined to -1.1% (FY18: -2.4%)                                                               3
                                                                                                     Convenience revenue                                                 1,559.0    1,493.6            4.4%
          Eastern seaboard delivered positive sales growth
                                                                                                     Total Food revenue as per Statutory Accounts                        7,836.4    7,831.8                  -
          WA remained challenging but there was an improvement in sales trajectory
          Increase in charge-through driven by higher Fresh sales
          Store closures reduced to 24 (FY18: 30) and were primarily in WA                                                                      Wholesale sales (ex tobacco)
          Store openings of 21 brings total openings over the past two years to 49. Store                                        0.0%
           openings are generally smaller format stores, in line with strategy.

                                                                                                            Rate of decline (%)
 Wholesale sales (ex tobacco) for the year declined by -1.5% (FY18: -3.6%)                                                       -1.0%

          2H19 decline of -1.3% represents the fourth consecutive half-year period of                                            -2.0%
           improvement in the rate of decline
 IGA retail LfL2 sales trajectory improved to -0.5% (FY18: -0.9%)                                                                -3.0%
 Teamwork score increased 80bps (~72%)                                                                                           -4.0%
 Continued improvement in retailer and supplier satisfaction scores
                                                                                                                                  -5.0%
Convenience                                                                                                                               1H17      2H17     1H18     2H18      1H19         2H19
 Total sales increased 4.4% to $1.6bn due to sales growth from major customers,
     increased tobacco sales and the addition of new customers.
1. Deflation excludes tobacco and produce.
2. Scan data from 1,118 IGA stores.
3. There were no AASB15 adjustments impacting Convenience revenue.                                                                                                                  FY19 Full Year Results       6
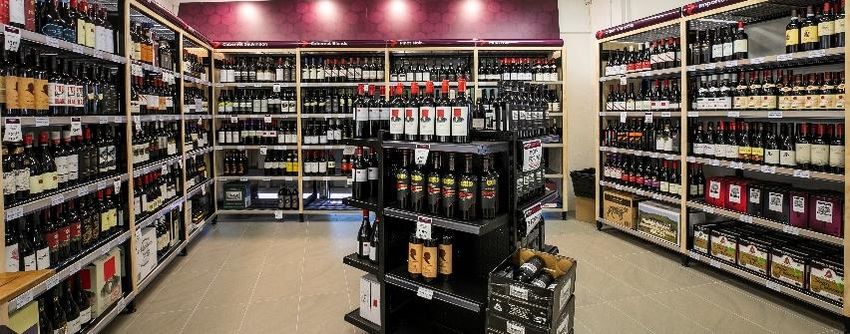
FY19 Full Year Results - 24 June 2019 Championing Successful Independents - Fastly
Food – EBIT

Food                                                                                                                                           FY19        FY18         Change
                                                                                                                                                $m          $m               %
 EBIT decreased $5.6m (3.0%) to $182.7m
                                                                                                 Total revenue1 (including charge-through)   8,794.3   8,768.6              0.3%
           The implementation of AASB15 had a $1.6m positive year-on-year impact on EBIT
                                                                                                 EBIT                                         182.7       188.3           (3.0%)
           The decline in wholesale sales (excluding tobacco) and an incremental investment     EBIT margin2                                  2.1%        2.1%                 -
            in MFuture initiatives of ~$10m (primarily trial of small convenience format store
            and Loyalty program) was partly offset by:
            – An incremental contribution from the resolution of onerous lease obligations of
              ~$7m, all of which occurred in 1H19
            – Improved earnings from Supermarket joint ventures
            – Working Smarter savings helped offset the impact of cost inflation
 Convenience business made a positive contribution to EBIT

                                                                                                  New DSA store: Ritchies, Rowville VIC
1. Total revenue includes charge-through sales of $957.9m (FY18: $936.8m).
2. EBIT margin: Reported EBIT / Total revenue (including charge-through sales).                                                                        FY19 Full Year Results   7
FY19 Full Year Results - 24 June 2019 Championing Successful Independents - Fastly
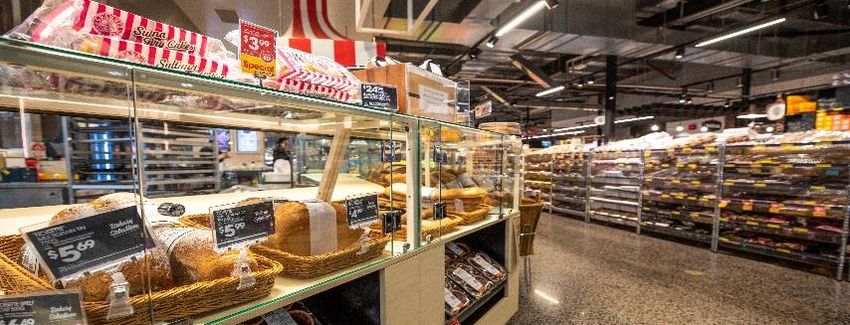
Food – initiatives update

    Retailer engagement                             Project Align                 Diamond Store Accelerator                           Community Co                             Small format offer
   Strategic direction endorsed by the       Implementation of new state-          A further 79 stores completed the         Now in all IGA and Supa IGA stores         First of proposed 10 store trial of
    National Retail Council (NRC)              based operational structure            program in FY19                            nationally                                  next generation IGA Express stores
   Working closely with retailer groups       completed                             Brings total stores that have             A further 100 products added in             opened at Bondi, NSW in May 2019
    (NRC & State boards)                      Business brought closer to             completed the program to ~400              FY19, total products in range ~280         Focus on Fresh including meal
   Establishment of National Retailer         customer for faster decision          Average sales growth ~10%                 Sales increased to ~$100m in FY19           solutions while also catering for a full
    Pricing and Promotions Committee           making                                                                                                                        grocery shop
                                                                                     Program now simplified to accelerate      Community Co Fresh launched
    to ensure competitive pricing             Logistics team repositioned –          roll-out from FY20                         including fresh chilled ready meals        More efficient operating model
   Significant improvement in retailer        driving improved performance
                                                                                     A further ~500 stores identified based     and fresh salads                            allows for more competitive pricing
    and supplier satisfaction surveys         Supports improvement in speed of       on demographic analysis                   Key new lines include Value Add            Shopper behaviour to date in-line
   Long-term supply agreements with           execution and sales
                                                                                     DSA program is core to delivery of         produce, sliced and specialty cheese,       with expectations
    retailers in SA, and new five year                                                brand strategy                             frozen chickens and ice cream              Number of customers up ~25%
    supply agreement with Drakes in                                                                                             Ten products received awards at            Fresh represents ~50% of total sales
    QLD                                                                                                                          “Product of the Year” recognition           (ready meals ~10%)
                                                                                                                                 event (five in FY18)
                                                                                                                                                                                          FY19 Full Year Results   8
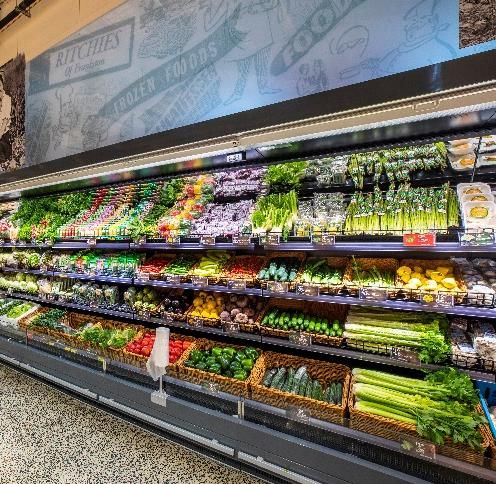
FY19 Full Year Results - 24 June 2019 Championing Successful Independents - Fastly
Liquor – sales

 Total sales (including charge-through) increased 5.6% to $3.7bn                                                                             FY19        FY18         Change
                                                                                                                                               $m          $m               %
          Continuation of ‘premiumisation’ trend                                                Total revenue as per Statutory Accounts    3,658.8   3,467.1              5.5%
          Modest improvement in sales volumes                                                   Charge-through sales                           8.1          6.9         17.4%
          Cycling addition of new contract customers in FY18                                    Total revenue (including charge-through)   3,666.9   3,474.0              5.6%

 Wholesale sales to IBA bannered network increased 5.3%
          Cycling conversion of contract customers to IBA banner (Thirsty Camel in SA and NT)
 LfL sales1 to IBA bannered network up 1.9% (FY18: 1.5%) supported by ‘Best Store
     in Town’ initiatives
 IBA bannered network has delivered six consecutive years of LfL sales growth,
     showing the strength of our IBA retailer network
 Proportion of sales through IBA bannered network in line with prior year at 55%
 Container Deposit Schemes rolled out in NSW, ACT and QLD with WA expected
     early 2020
          NSW 1 December 2017
          ACT 30 June 2018
          QLD 1 November 2018

                                                                                                 IGA Liquor, Strathfieldsaye, VIC
1. Scan data from 1,163 stores.                                                                                                                       FY19 Full Year Results   9
Liquor – EBIT

 Reported EBIT increased $0.9m (1.3%) to $71.2m                                                                                                                                                      FY19        FY18         Change
                                                                                                                                                                                                       $m          $m               %
 Implementation of AASB15 had a negative $1.9m1 year-on-year impact on EBIT                                                                       Total revenue2 (including charge-through)        3,666.9   3,474.0              5.6%
 EBIT margin declined 10bps to 1.9% due to:                                                                                                       Reported EBIT                                      71.2         70.3            1.3%
         Sales growth being largely value driven                                                                                                  EBIT margin3                                       1.9%        2.0%         (10bps)

         Some additional costs associated with the introduction and administration of CDS
          schemes and MFuture investments in the corporate store trial and mobilisation
          of the ‘on-premise’ team

 1. The year-on-year EBIT impact of AASB 15 is a result of a higher investment in the retail network in FY19, primarily store paint ups, some of
                                                                                                                                                   New Porters Liquor store: North Narrabeen, NSW
    which would previously have been capitalised under the old accounting standard.
 2. Total revenue includes charge-through sales of $8.1m (FY18: $6.9m).
 3. EBIT margin: Reported EBIT / Total revenue (including charge-through).                                                                                                                                    FY19 Full Year Results   10
Liquor – initiatives update

       Store investment                            Core range                          Private & exclusive labels                         On-premise
   Continued improvement in the          Focused on higher value premium             Continued to evolve and premiumise         Renewed focus on ‘on-premise’
    quality of IBA store network and       products (wine and spirits) and              private label range                         channel
    shopper experience                     aligned with consumption trends             SKUs increased to ~80 across wine,         Strengthening alignment between
   81 stores ‘refreshed’ in FY19         Range and programs tailored by               beer and spirit categories                  key partners including suppliers
    (total stores ‘refreshed’ ~330)        retail banner                               Wine category sales up 20% on FY18.         and customers
   110 cool room upgrades in FY19        Regional ranging strategy, with              Now represents 85% of private label        Better leverage of existing network
    (total cool room upgrades ~610)        retailer flexibility to deliver local        sales.                                     Investment in ‘on-premise’ team
                                           product offering                            Over 50 awards received across wine        New contract customers added
                                          Increase in coverage of ‘Cellar              range in FY19                               during the period (Compass,
                                           Selections’ premium range                   Increased retailer margins and basket       Sodexo)
                                           marketing program to ~250 stores             size
                                          IBA category and range extension
                                           program now in ~1,500 stores                                                                                 FY19 Full Year Results   11
Hardware – sales

 Total sales (including charge-through) decreased 0.9% to $2.1bn, negatively                                                                    FY19        FY18         Change
     impacted by:                                                                                                                                 $m          $m               %
                                                                                          Total revenue as per Statutory Accounts              1,165.1   1,143.3              1.9%
          Slowdown in construction activity
                                                                                          Charge-through sales                                  936.9       976.8           (4.1%)
          Loss of large HTH customer in QLD in 1H19
                                                                                          Total revenue (including charge-through)             2,102.0   2,120.1            (0.9%)
          Net closure of stores (primarily non profitable company-owned stores)
    Total sales increased 0.3% excluding impact of lost HTH customer in QLD
    Total wholesale LfL sales to IHG banner group1 increased 2.3%
    LfL retail sales in IHG banner group up 3.0%2
    Online sales continued to grow strongly
    Trade sales increased to ~65% of total sales (FY18: 63%)
    Rate of market slowdown varied across segments
          Largest decline in multi-dwellings – large tier 1 builders
          Housing starts declined but still at solid levels versus historical averages
          Renovations, additions and DIY less impacted
 IHG’s diversified portfolio of retailers and end customers help limit its exposure
     to any particular segment
                                                                                          Recent Sapphire store: Mitre 10 Mount Waverly, VIC
1. Includes sales to independent retailers and company-owned stores.
2. LfL sales growth based on a sample of 171 network stores that provide scan data.                                                                      FY19 Full Year Results   12
Hardware – EBIT

                                                                                                                                                 FY19        FY18         Change
 EBIT increased by $11.9m (17.2%) to $81.2m                                                                                                      $m          $m               %
          Implementation of AASB15 had a $0.1m positive year-on-year impact on EBIT        Total revenue1 (including charge-through)          2,102.0   2,120.1            (0.9%)
          Additional synergies in the year from HTH acquisition of ~$10m                   Reported EBIT                                        81.2         69.3          17.2%
           (cumulative gross realised synergies ~$34m)                                      EBIT margin2                                         3.9%        3.3%           60bps
          Increased earnings from company-owned stores primarily due to closure/sale of
           loss making stores
          Working Smarter cost savings helped offset inflation
          Wholesale margins negatively impacted by increased weighting of Trade in sales
           mix
 IHG wholesale sales margin 2.9%
 Total IHG EBIT margin increased to 3.9% (FY18: 3.3%) reflecting increased
     earnings in the retail business

                                                                                            Recent Sapphire store: Hume & Iser Mitre 10, VIC
1. Total revenue includes charge-through sales of $936.9m (FY18: $976.8m).
2. EBIT margin: Reported EBIT / Total revenue (including charge-through).                                                                                FY19 Full Year Results   13
Hardware – initiatives update

    Sapphire program                       Trade focus                     Hardings expansion                 Core range                        HTH integration
   Keeps stores modern and           Additional seven store             Strong market position        Continued to rollout core           HTH integration delivered a
    leading edge                       conversions in FY19, bringing       in Victoria                    ranging program                      further ~$10m of synergies
   A further 30 stores upgraded       total stores completed to 11       New in-store at Tooronga      Program rollout expanded             in FY19 (cumulative delivered
    in FY19. Total of 60 stores       Targeting 40 low-cost Trade         (“Design 289”)                 to HTH                               synergies ~$34m)
    now upgraded.                      stores by 2022                     Progressing rollout into      Sales growth of 7% to 23%           Additional savings through
   Average retail sales              Average Metcash investment          NSW and Tasmania               across categories (fasteners,        Working Smarter and
    improvement >15%                   of ~$120k per store                Commenced selling into         hand tools, power tools, paint       MFuture
   Expect to have ~200 stores                                             IHG network                    and cements)
    upgraded by 2022
   Up to 50% investment
    contribution by IHG (between
    $50k - $200k depending on
    store size)
                                                                                                                                                        FY19 Full Year Results   14
MFuture - next 5 years
Key growth initiatives
   Food
                Retail brand offer – right brand for store size
                Core range and price – better everyday value                               Our 5 year vision
                Acceleration of DSA program                                       Delivering a pathway to sustainable growth
                Small format convenience store trial
  Liquor                                                                                                Our strategy
                National rollout of Porters Liquor
                Corporate store trial                                             A balanced approach to revenue growth
                Grow share of ‘on-premise’ market                                 and cost out
                                                                                    Accelerating successful current initiatives
                Acceleration of digital capability
                                                                                    Following the shopper into new growth initiatives
                                                                                    Improving our infrastructure to enable simpler
                                                                                     and cheaper processes
 Hardware                                                                           Ensuring we have a sustainable cost base into the future
              Retail growth through acceleration of Sapphire program including
               Core Range                                                          Improved competitiveness for our retailer
              Trade growth through ‘Trade Only’ stores and ‘Whole of House’       networks
              Expand footprint of company-owned stores                               Product range
                                                                                      Service
                                                                                      Price
                                                                                      Location
 Cost out
              Our aim is to offset the impact of inflation                        Matching store formats to customer
              Initial savings identified of ~$50m over FY20 and FY21              shopping missions
                                                                                    Trial of new formats and ownership models

          Progress on MFuture key initiatives will be provided in future results
                                                                                                                              FY19 Full Year Results   15
Financials

Brad Soller
Group Chief Financial Officer
Profit & Loss
                                                                                                                                                  FY19      FY181    Change
                                                                                                                                                   $m         $m          %
Sales revenue                                                                                                                                  12,660.3   12,442.2     1.8%
EBITDA                                                                                                                                           386.4      391.2     (1.2%)
Depreciation and amortisation                                                                                                                    (56.4)     (56.6)    (0.4%)
EBIT                                                                                                                                             330.0      334.6     (1.4%)
Net finance costs                                                                                                                                (28.9)     (26.4)    (9.5%)
Profit before tax and NCI                                                                                                                        301.1      308.2     (2.3%)
Tax                                                                                                                                              (88.5)     (88.5)         -
Non-controlling interests                                                                                                                         (2.3)      (2.8)   (17.9%)
Underlying profit after tax                                                                                                                      210.3      216.9     (3.0%)
Working Smarter restructure costs and HTH integration costs (post tax)                                                                           (13.6)     (19.6)    30.6%
South Australia Distribution Centre costs (post tax)                                                                                              (3.9)          -         -
Impairment of goodwill and other net assets (post tax)                                                                                                -    (345.5)         -
Reported profit / (loss) after tax                                                                                                               192.8     (148.2)         -

EPS based on underlying profit after tax                                                                                                          22.6c      22.2c     1.8%

ROFE2                                                                                                                                            27.7%      24.4%    330bps

1. The FY18 results have been restated to reflect the adoption of the new Accounting Standard AASB15: Revenue from Contracts with Customers.
2. ROFE based on average of opening and closing funds employed.                                                                                                          FY19 Full Year Results   17
Working Smarter

 Three-year Working Smarter program now completed                                 Working Smarter makes doing business with
 Delivered significant cost savings and helped protect margins                    Metcash simpler for customers, suppliers and
                                                                                   our people through:
      Total annualised gross savings for program ~$125m (initial target ~$100m)
      Gross annualised savings in FY19 ~$30m ($25m delivered in FY19)
                                                                                            SMARTER BUYING
                                                                                            SMARTER BUYING
 FY19 opex implementation cost of $19m (pre tax)
 Total program opex implementation cost of $59m (pre tax)                                  SIMPLER WAYS
                                                                                                    WAYS OF
                                                                                                         OF
                                                                                            SIMPLER
 Key initiatives included:                                                                 WORKING
                                                                                            WORKING
      Supermarkets operating model redesign
      Convenience operating model consolidation
                                                                                            FOCUS ON
                                                                                            FOCUS ON OUR
                                                                                                     OUR SALES
                                                                                                         SALES
                                                                                            CHANNELS
                                                                                            CHANNELS
      Distribution Centre efficiencies
      Corporate cost savings                                                               BUILD THE POSITIVE
                                                                                            BUILD THEOFPOSITIVE
 MFuture program (next five year phase of strategy) now underway                           ASPECTS     OUR CULTURE
                                                                                            ASPECTS OF OUR CULTURE
                                                                                   By
                                                                                   By simplifying
                                                                                      simplifying the
                                                                                                  the way
                                                                                                      way we
                                                                                                           we operate
                                                                                                               operate we
                                                                                                                       we can
                                                                                                                          can meet
                                                                                                                               meet
                                                                                   the
                                                                                   the future needs of our customers, retailers and
                                                                                       future needs  of our customers, retailers and
                                                                                   suppliers.
                                                                                   suppliers.

                                                                                                                           FY19 Full Year Results   18
Cashflows

                                                                                                                                                                                                       FY19     FY181
                                                                                                                                                                                                        $m        $m
Net cash from operating activities2                                                                                                                                                                   244.9     276.3
Net cash used in investing activities                                                                                                                                                                 (47.9)    (43.8)
   Capital expenditure                                                                                                                                                                                (54.2)    (34.7)
   Proceeds from sale of businesses/assets and net loan movements                                                                                                                                      18.1       6.8
   Acquisitions of businesses                                                                                                                                                                         (11.8)    (15.9)
Dividends paid and other financing activities                                                                                                                                                        (132.4)   (108.9)
Off-market share buy-back                                                                                                                                                                            (150.3)         -
(Increase) / reduction in net debt                                                                                                                                                                    (85.7)    123.6

Cash realisation ratio3                                                                                                                                                                              91.8%     101.2%

Adjusted cash realisation ratio4                                                                                                                                                                     91.8%      96.2%

1. FY18 net cash from operating activities and net cash used in investing activities have been restated to reflect the adoption of the new Accounting Standard AASB15: Revenue from Contracts with
   Customers. Certain customer incentive payments which were previously classified as investing cash flows are now classified as operating cash flows under the new standard.
2. FY18 included ~$20m received on settlement of the Huntingwood, NSW DC insurance claim.
3. Cash flow from operations/underlying NPATDA (depreciation and amortisation not tax effected).
4. FY18 adjusted to exclude ~$20m received on settlement of the Huntingwood, NSW DC insurance claim.                                                                                                               FY19 Full Year Results   19
Balance Sheet

                                            30 April    30 April
                                               2019        2018
                                                $m          $m
Trade receivables and prepayments            1,472.5     1,458.6
Inventories                                    779.3       754.1
Trade payables and provisions               (2,210.5)   (2,170.2)
Net working capital                             41.3        42.5

Intangible assets                              793.5       792.3
Property, plant and equipment                  225.8       215.5
Equity accounted investments                    87.7        88.3
Customer loans and assets held for resale       48.2        50.9
Total funds employed                         1,196.5     1,189.5

Net (debt)/cash                                (42.9)       42.8
Tax, put options and derivatives                96.5       101.9
Net Assets / Equity                          1,250.1     1,334.2

                                                              FY19 Full Year Results   20
AASB16 – Leases
Implementation of AASB16 will not impact the Group’s cashflows, debt covenants or shareholder value; but will change reported results as follows:
Balance Sheet
 Recognition of ‘right of use’ asset, sublease receivable and offsetting liability
 Asset value estimated at $800m – $1,000m (includes ‘right of use’ assets and sublease receivable)
 Liability estimated at $800m – $1,000m (includes both Metcash occupied properties and back to back lease obligations)
Profit and Loss
 The new standard will result in a material increase in both EBIT and EBITDA
 This will be offset by higher depreciation and finance costs
 The impact on Net Profit After Tax is not expected to be material (< $15m)
Cashflows
 No impact on net cashflows
 Increase in reported operating cashflows offset by higher financing cashflows
Adoption date and comparatives
 AASB16 will be adopted in 1H20
 We will not be restating prior year comparatives

             Further details are contained in Appendix A of the FY19 statutory financial report

 Note: Whilst the Group has substantially completed its preliminary implementation assessment of the new standard, certain technical and judgmental aspects of the revised accounting policy remain   FY19 Full Year Results   21
 open which could have an impact on the estimates disclosed above.
Net (debt) / cash
   Net debt of $42.9m (FY18: Net cash $42.8m)                                                                                                        FY19            FY18
                                                                                                                                                       $m              $m
   $150m share buy-back in August 2018
                                                                         Net debt
   Average net debt of ~$310m (FY18: $150m)                             Gross debt                                                                (185.5)         (118.4)
   Refinanced $450m of debt facilities                                  Cash and cash equivalents                                                   142.6           161.2
        Syndicated facility with 3, 4 and 5 year tranches               Net (debt) / cash                                                           (42.9)            42.8
        Lower borrowing cost
   Cancelled ~$100m debt securitisation facility                        Debt metrics and ratios
   Average tenor of debt extended to 2.9 years                          Weighted average debt maturity                                           2.9 years     1.9 years
   Balanced debt maturity profile                                       Weighted average cost of debt1                                               3.4%            3.6%
   No debt maturities until FY21                                        % Fixed debt                                                                 50%              79%
                                                                         Interest coverage2                                                          25.2x           15.2x
                        Current Debt Maturity Profile                    Gearing ratio3                                                               3.3%                —
         250
                                                                         Underlying EBITDAR coverage4                                                 3.8x             3.5x
         200                                                             Gross debt coverage5                                                         0.5x             0.3x
         150
    $m

         100

          50
                                                                         1. Weighted average cost of debt over the period (excludes line fees).

           0                                                             2. Underlying EBITDA / Net Interest Expense.
                 FY21          FY22           FY23         FY24   FY25   3. Net Debt / (Shareholders’ Equity + Net Debt).
                                                                         4. Underlying EBITDAR / (Net Interest Expense + Net Rent Expense).
                        Syndicated Facility    Working capital
                                                                         5. Gross Debt / Underlying EBITDA.                                                   FY19 Full Year Results   22
Dividends

 FY19 final dividend
      7.0 cents per share, fully franked
      Ex-dividend date: 9 July 2019
      Record date: 10 July 2019
      Payment date: 7 August 2019
 Total dividends for FY19 of 13.5 cents per share, fully franked
 Dividend payout ratio of ~60% of underlying earnings per share

                                                                    FY19 Full Year Results   23
Group outlook

Jeff Adams
Group Chief Executive Officer
Group outlook

              In Supermarkets, there has been a continued improvement in the sales trajectory of wholesale sales (excluding tobacco) through the first seven weeks of FY20
              As announced, Metcash has entered into a five-year supply agreement with Drakes Supermarkets in Queensland. Metcash, however, expects to cease
               supplying Drakes Supermarkets in South Australia once their new DC becomes operational (expected to be 30 September 2019)
 Food         Supermarkets will continue to invest in growth initiatives through the MFuture program and expects related operating expenditure in FY20 to be in-line with
               that incurred in FY19
              The contribution to Supermarkets EBIT from the resolution of onerous lease obligations in FY20 is expected to be significantly lower than that reported in FY19
              Cost savings through the MFuture program in FY20 are expected to help offset inflation in the Food pillar

              Continuation of the ‘premiumisation’ consumption trend is expected to be the key driver of market growth in FY20
              The business is continuing to focus on key MFuture initiatives including building and improving the quality of its IBA network, growing its share of the ‘on-
               premise’ market, the trial of corporate stores, expanding private label and the rollout of Porters Liquor
Liquor

              Sales through the first seven weeks of FY20 are lower than the corresponding prior year period, reflecting the loss of a major customer in Queensland in
               1H19 and a slowdown in trade sales
              It is too early to say whether the changes in the economic environment for the residential housing sector will feed into construction and DIY activity in
Hardware       FY20, however there appears to be an improvement in the level of confidence in the network post the election
              Additional cost savings are expected to help mitigate the adverse impact of any further slowdown in construction activity in FY20

              We are encouraged by the commitment of our independent retailers across all Pillars to continue to invest in their stores

Network
investment                                                                                                                                                        FY19 Full Year Results   25
Appendices

1.   Financial history
2.   AASB15 – Revenue from contracts with customers
3.   Restatement of EBIT as a result of AASB15
4.   Restatement of sales revenue as a result of AASB15
5.   Bannered store numbers
1. Financial history
                                                                                                                                   FY19                        FY18                         FY17                FY16       FY15
Financial Performance
Sales revenue 1 ($m)                                                                                                            12,660.3                    12,442.2                     12,293.0             11,716.5   11,604.2
EBIT 2,3 ($m)                                                                                                                       330.0                       334.6                       304.8               286.7      310.6
Net finance costs 3 ($m)                                                                                                            (28.9)                     (26.4)                       (33.6)              (38.3)     (68.4)
Underlying profit after tax 2 ($m)                                                                                                  210.3                       216.9                       194.8               178.3      173.6
Reported profit after tax 2 ($m)                                                                                                    192.8                     (148.2)                       171.9               216.5     (384.2)
Operating cash flows ($m)                                                                                                           244.9                       276.3                       304.6               165.8      231.7
Cash realisation ratio (%)4                                                                                                          92%                        101%                        118%                  70%        97%
Financial Position
Shareholder’s equity 2 ($m)                                                                                                       1,250.1                     1,334.2                     1,583.2              1,369.1    1,156.6
Net debt / (cash)                                                                                                                    42.9                      (42.8)                         80.8              275.5      667.8
Gearing ratio5 (%)                                                                                                                   3.3%                            -                       4.7%               16.8%      36.6%
Return on funds employed 6 (%)                                                                                                     27.7%                       24.4%                        19.0%               17.2%      15.1%
Share Statistics
Fully paid ordinary shares                                                                                                          909.3                       975.6                       975.6               928.4      928.4
Weighted average ordinary shares                                                                                                    928.6                       975.6                       958.8               928.4      907.0
Underlying earnings per share (cents) 2                                                                                              22.6                        22.2                         20.3               19.2       19.1
                                  2
Reported earnings per share (cents)                                                                                                  20.8                      (15.2)                         17.9               23.3      (42.4)
Dividends declared per share (cents)                                                                                                 13.5                        13.0                          4.5                   -        6.5

1.   Sales revenue has been adjusted to reflect the new Accounting Standard AASB15 in all reporting periods.
2.   EBIT, Profit after tax, Shareholder’s equity and EPS have been adjusted to reflect AASB15 in FY19 and FY18. There have been no adjustments to earlier reporting periods.
3.   EBIT and Net finance costs for all reporting periods reflect the reclassification of the Customer Charge Cards Agreement, as disclosed in FY18. This adjustment had no impact on net profit after tax.
4.   Cash flows from operations / Underlying NPAT + Depreciation and Amortisation (depreciation and amortisation not tax effected)
5.   Net Debt / (Shareholders Equity + Net Debt)
6.   Underlying EBIT / Average funds employed                                                                                                                                                                                FY19 Full Year Results   27
2. AASB15 – Revenue from contracts with customers
   Effective from 1H19. Comparative period balances have been restated
   Key change is the derecognition of $1.9bn in charge-through revenue
   Impact on reported EBIT in both FY19 and FY18 was immaterial
   See Appendix 3 for reconciliation
   Details relating to this change are included in Appendix A of the FY19 statutory financial report
   Metcash will continue to include charge-through revenue in sales in future results presentations

                                                                                                        FY19 Full Year Results   28
3. Restatement of EBIT as a result of AASB15

                                                                                                         FY19                                                                     FY18                                 AASB15
                                                                                                                                                                                                                   adjustment
                                                                                                            AASB15                                                                 AASB15                         year-on-year
                                                                                  Pre AASB15            adjustment1            Post AASB15              Pre AASB15             adjustment1            Post AASB15       change
                                                                                         $m                     $m                     $m                      $m                      $m                     $m           $m
Food                                                                                       181.4                      1.3                 182.7                  188.6                    (0.3)                 188.3      1.6
Liquor                                                                                       71.2                        -                 71.2                    68.4                      1.9                  70.3    (1.9)
Hardware                                                                                     80.8                     0.4                  81.2                    69.0                      0.3                  69.3     0.1
Total Pillar EBIT                                                                          333.4                      1.7                 335.1                  326.0                       1.9                327.9     (0.2)
Corporate                                                                                   (5.1)                        -                 (5.1)                     6.7                      —                     6.7       -
Total EBIT                                                                                 328.3                      1.7                330.0                   332.7                      1.9                 334.6     (0.2)
Net finance costs                                                                          (28.9)                        -               (28.9)                  (26.4)                       —                 (26.4)        -
Tax                                                                                        (88.0)                   (0.5)                (88.5)                  (87.9)                   (0.6)                 (88.5)     0.1
Non-controlling interest                                                                    (2.3)                        -                 (2.3)                   (2.8)                      —                   (2.8)       -
Underlying profit after tax                                                                209.1                      1.2                210.3                   215.6                      1.3                 216.9     (0.1)

1. The FY19 and FY18 results have been adjusted to adopt the new Accounting Standard AASB15: Revenue from Contracts with Customers. Details relating to the change are included in the FY19 statutory financial report.     FY19 Full Year Results   29
4. Restatement of sales revenue as a result of AASB151

                                                                                                                   FY19                                                                           FY18
                                                                                                                    Sales revenue                                                                 Sales revenue
                                                                                    Sales Revenue Charge-through        (including                                Sales Revenue Charge-through        (including
                                                                                       (Statutory)          sales charge-through)                                    (Statutory)          sales charge-through)
                                                                                               $m             $m               $m                                            $m             $m               $m
Supermarkets                                                                                  6,277.4                      957.9                  7,235.3                    6,338.2                      936.8       7,275.0
Convenience                                                                                   1,559.0                             -               1,559.0                    1,493.6                             —    1,493.6
Food                                                                                          7,836.4                      957.9                  8,794.3                    7,831.8                      936.8       8,768.6
Liquor                                                                                        3,658.8                          8.1                3,666.9                    3,467.1                         6.9      3,474.0
Hardware                                                                                      1,165.1                      936.9                  2,102.0                    1,143.3                      976.8       2,120.1
Sales revenue                                                                               12,660.3                    1,902.9                  14,563.2                  12,442.2                    1,920.5       14,362.7

1. The FY19 and FY18 sales revenue have been adjusted to reflect the adoption of the new Accounting Standard AASB15: Revenue from Contracts with Customers. Details relating to the change are included in the
   FY19 statutory financial report.                                                                                                                                                                                       FY19 Full Year Results   30
5. Bannered store numbers

                                                                                            April          April
                                                                                            2019           2018
Pillar
Supermarkets                                                                                1,673          1,674
Campbells                                                                                     17             18
Liquor                                                                                      2,667          2,754
Hardware                                                                                     668            710
Total                                                                                       5,025          5,156

                                                        Supermarkets   Campbells   Liquor   Hardware       Total
Store movement
Number of stores at April 2018                                 1,674         18    2,754            710    5,156
Stores opened / joined banner group during the period            67            -     404              7     478
Stores closed / left banner group during the period             (68)         (1)    (491)           (49)   (609)
Number of stores at April 2019                                 1,673         17    2,667            668    5,025

                                                                                                             FY19 Full Year Results   31
5. Bannered store numbers

                                            April   April
                                            2019    2018
Supermarkets
Supa IGA                                      373     376
IGA                                           792     808
IGA-Xpress                                    220     209
Total IGA bannered stores                   1,385   1,393
Friendly Grocer / Eziway                      288     281
Total Supermarkets                          1,673   1,674

Liquor
Cellarbrations                                557     574
Bottle-O & Bottle-O Neighbourhood             237     239
IGA Liquor                                    467     458
Porters                                        22      24
Thirsty Camel (NSW/ACT, QLD, TAS, SA/NT)      150     158
Big Bargain                                    54      54
Other                                       1,180   1,247
Total Liquor                                2,667   2,754

Hardware
Mitre 10                                     308     299
Home Timber & Hardware and related brands    300     347
True Value Hardware                           60      64
Total Hardware                               668     710

                                                      FY19 Full Year Results   32
Disclaimer

This presentation contains summary information about Metcash Limited (ABN 32 112 073 480) (Metcash) and its activities current as at the date of this presentation. The information in this presentation is of general background and does
not purport to be complete. It should be read in conjunction with Metcash’s other periodic and continuous disclosure announcements filed with the Australian Securities Exchange, which are available at www.asx.com.au.
This presentation is for information purposes only and is not a prospectus or product disclosure statement, financial product or investment advice or a recommendation to acquire Metcash shares or other securities. It has been prepared
without taking into account the objectives, financial situation or needs of individuals. Before making an investment decision, prospective investors should consider the appropriateness of the information having regard to their own
objectives, financial situation and needs and seek legal and taxation advice appropriate to their jurisdiction. Metcash is not licensed to provide financial product advice in respect of Metcash shares or other securities. Past performance is
no guarantee of future performance.
No representation or warranty, expressed or implied, is made as to the fairness, accuracy, completeness or correctness of the information, opinions and conclusions contained in this presentation. To the maximum extent permitted by law,
none of Metcash and its related bodies corporate, or their respective directors, employees or agents, nor any other person accepts liability for any loss arising from the use of this presentation or its contents or otherwise arising in
connection with it, including, without limitation, any liability from fault or negligence on the part of Metcash, its related bodies corporate, or any of their respective directors, employees or agents.
This presentation may contain forward-looking statements including statements regarding our intent, belief or current expectations with respect to Metcash’s business and operations, market conditions, results of operations and financial
condition, specific provisions and risk management practices. When used in this presentation, the words “likely”, “estimate”, “project”, “intend”, “forecast”, “anticipate” ,”believe”, “expect”, “may”, “aim”, “should”, “potential” and similar
expressions, as they relate to Metcash and its management, are intended to identify forward-looking statements. Forward looking statements involve known and unknown risks, uncertainties and assumptions and other important factors
that could cause the actual results, performance or achievements of Metcash to be materially different from future results, performance or achievements expressed or implied by such statements. Readers are cautioned not to place undue
reliance on these forward-looking statements, which speak only as of the date thereof.

Contact details
For additional information contact:

Steve Ashe
Head of Corporate Affairs & Investor Relations
Phone:     +61 408 164 011
E-mail:    steve.ashe@metcash.com
Charmaine Lim
Investor Relations Manager
Phone:
Email:
            +61 427 219 871
            charmaine.lim@metcash.com
                                                                                   Visit our website:   www.metcash.com                                                                                                             FY19 Full Year Results   33
Championing Successful Independents
You can also read