FY19 Full Year Results Presentation - 23 August 2019 ASX Code: AMI - Aurelia Metals Ltd
←
→
Page content transcription
If your browser does not render page correctly, please read the page content below
FY19 Full Year Results Presentation
23 August 2019
ASX Code: AMI
Forward looking statements
This presentation has been prepared by Aurelia Metals Limited (“AMI” or the “Company”). It should not be considered as an offer or invitation to subscribe for or purchase any
securities in the Company or as an inducement to make an offer or invitation with respect to those securities. No agreement to subscribe for securities in the Company will be
entered into on the basis of this presentation.

This presentation contains forward-looking statements that are not based on historical fact, including those identified by the use of forward-looking terminology containing such
words as “believes”, “may”, “will”, “estimates”, “continue”, “anticipates”, “intends”, “expects”, “should”, “schedule”, “program” , “potential” or the negatives thereof and words of similar
import.

AMI cautions that these forward-looking statements are subject to risks and uncertainties that could cause actual events or results to differ materially from those expressed or
implied by the statements. The Company believes that the estimates are reasonable, but should not be relied upon.

AMI makes no representation, warranty (express or implied), or assurance as to the completeness or accuracy of these projections and, accordingly, expresses no opinion or any
other form of assurance regarding them. The Company does not intend to publish updates or revisions of any forward -looking statements included in this document to reflect
Aurelia’s circumstances after the date hereof or to reflect subsequent market analysis, other than to the extent required by law.

By its very nature, production and exploration for gold and base metals is a high risk business and is not suitable for certain investors. Potential investors should consult their
stockbroker or financial advisor. There are a number of risks, both specific to AMI and of a general nature which may affect the future operating and financial performance of AMI
and the value of an investment in AMI including and not limited to economic conditions, stock market fluctuations, commodity price movements, regional infrastructure constrains,
equipment availability, timing of approvals from relevant authorities, regulatory risks, operational risks, reliance on key p ersonnel and foreign currency fluctuations.

You should not act or refrain from acting in reliance on this presentation material. This presentation does not purport to be all inclusive or to contain all information which its
recipients may require in order to make an informed assessment of the Company’s prospects. You should conduct your own investigation and perform your own analysis in order to
satisfy yourself as to the accuracy and completeness of the information, statements and opinions contained in this presentation before making any investment decision.

2
Corporate snapshot                ASX code: AMI
                                  Share price (22 August 2019)                $0.515

                                  Shares on issue                             867.9m

    Major shareholders            Market capitalisation                      A$447m

    Colonial First State   8.0%
    Australian Super       7.5%   Board and management
    Van Eck                5.7%   Exec Chairman and Acting
                                                                     Cobb Johnstone
                                  CEO
                                  Executive Director and
                                                                     Michael Menzies
                                  Acting COO

                                                                      Lawrie Conway
                                                                        Susie Corlett
                                  Non-Executive Directors
                                                                          Paul Espie
                                                                         Paul Harris

                                  CFO & Company Secretary               Tim Churcher

                                  Additional Company
                                  Secretary                              Gillian Nairn

                                                                 Scott Ramsay – Hera
                                  General Managers
                                                                     Neal Valk – Peak
3
Investment highlights
Two major processing plants
Dominant position in the highly High-margin gold and base
with a combined capacity of
prospective Cobar Basin metals production profile
approx. 1.3Mtpa
Strong balance sheet: Upgrade and efficiency projects Recent drilling success
A$104m cash and no debt set to drive margin and highlights significant near-mine
(30 June 2019) operating life and regional upside
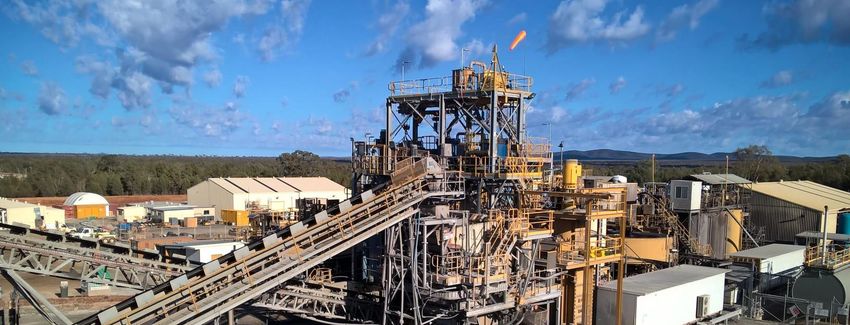
4Key assets
Located in the highly endowed and productive Cobar Region
Bourke
Endeavour Zn/Pb/Ag (CBH-
Toho) Australia
CSA Cu (Glencore)
NSW
Nyngan
Cobar Peak Au/Cu/Pb/Zn Mines
Cobar Nymagee Cu Project
Basin
Hera Au/Pb/Zn Mine
Federation Zn-Pb-Au-Cu-Ag
Wonawinta Ag
Mallee Bull Cu/Pb/Zn Project (Peel/CBH)
Newcastle
ORANGE
Parkes
Lithgow
Southern Nights (Peel)
Bathurst
100kms
SYDNEY
5Core strategy
A mining-for-value approach
1▪ Optimise existing operations
▪ Increased development rates and Pb/Zn circuit upgrade
▪ Mine life extension and ongoing efficiencies at Hera
2▪ Focus on returns
▪ Margin over volume or commodity preference
▪ Accelerating access to higher margin material for FY21
3▪ Leverage extensive UG and surface infrastructure: targeted near-mine drilling
▪ Identify new high-NSR material; and
▪ Extend asset operating lives
4▪ Unlock exceptional prospectivity: regional exploration to deliver the next major mine
6FY19 financial results summary
Investing in operational capacity and growth
Performance Indicators Units FY19 FY18 Change
▪ Gold production up 21% to 117,521 oz at higher AISC of
$1,045/oz Sales Revenue A$k 295,002 248,599 19%
Profit Before Tax A$k 51,018 92,306 (45%)
▪ Net Profit After Tax of $36.0M
Net Profit After Tax A$k 36,017 99,105 (64%)
▪ Revenue increased 19% to $295M driven by higher
EBITDA A$k 103,062 136,717 (25%)
production, offset by:
Cash A$k 104,302 66,925 56%
▪ Higher operating costs of $64M (12 months of Peak costs),
higher D&A (up $15M), higher tax (up $21.8M). Net Operating Cash Flow A$k 106,783 151,759 (30%)
▪ Higher gold marked-to-market loss (up $17M). $12M of the
derivative loss is unrealised. EBITDA Margin % 35 55 (36%)
AISC Margin $/oz 703 1,189 (41%)
▪ Tax expense moves from a tax benefit in FY18 to a net tax
expense in FY19. AISC $/oz 1,045 509 105%
▪ Cash increased 56% to $104.3M (FY18: $66.9M) Earnings Per Share cps 4.2 15.5 (73%)
Final Dividend (Fully Franked) cps 2.0 -
▪ Strong EBITDA of $103.0 million
▪ Hera EBITDA margin 46% (FY18: 55%)
NOTE:
▪ Strong Peak EBITDA margin 42% (FY18: 67%) All-in Sustaining Cost (AISC) is a non-IFRS data and is not audited. Group AISC includes Site
Costs (mining, processing, site administration and changes in inventory), royalty, transport & smelter
expenses, by-product credits (silver, copper, lead & zinc sales), sustaining capital, corporate
▪ Maiden 2.0 cents per share fully franked dividend declared administration costs. Divided by gold sold in the period.
7FY19 financial results
Maiden dividend declared
▪ Maiden 2.0 cents per share fully franked dividend declared
▪ 3.9% fully franked yield on a share price of 51.1c/share
▪ Payment reflects approximately 50% of net profit and net cash generation in FY19
▪ $17.4M dividend to be paid on 2 October 2019
▪ The existence and level of future dividend payments will be dependent on the future balance sheet position taking into
consideration commodity prices and growth capital requirements
Dividend Dates:
▪ Dividend declaration Friday, 23 August 2019
▪ Ex-Dividend date Friday, 30 August 2019
▪ Dividend record date Monday, 2 September 2019
▪ Dividend payment date Wednesday 2 October 2019
8FY19 financial results
Increased production at good margin
▪ Hera: Gold production maintained.
▪ Plant throughput increased 15% to 468kt (FY18: 407kt)
▪ Gold and base metal grades reduced 17% and 30% respectively
▪ Lower base metal production and realised prices resulted in
AISC increasing to $809/oz (FY18: $430/oz)
▪ Peak: Gold production increased (due to 12 months of production in
the period v 2.7 months in prior period)
▪ Gold grade reduced by 52% (depletion of extreme high gold
grade Chronos last period)
▪ Mining costs increased with significant ramp up in underground
operating mine development
▪ AISC increased to $1,143/oz – EBITDA margin remains strong
at 42%
▪ Increased Lead and Copper production, but at lower achieved prices
(Lead price down 13%, Copper price down 9% year on year)
Note: Site AISC $/oz excludes corporate general admin costs
9FY19 financial results
Key profit contributions
▪ Increased revenue from higher Gold, Copper and Lead production (Gold at 3% higher prices, base metals at 9-13% lower prices).
▪ Inclusion of a full year of Peak operating costs (at lower but still strong EBITDA margin of 42%, relative to the prior period).
▪ Increased Depreciation & Amortisation expense, Increased loss on gold hedge book ($12M of which is unrealised at 30 June 2019
(56,000 oz at $1,809/oz)) and a change from tax benefit to tax expense this year.
10FY19 financial results Revenue contribution ▪ Gold revenue remains dominant (67% of total revenue). ▪ Relatively even by-product contribution from copper, lead and zinc. ▪ Proportion of base metal revenue expected to increase in FY20 production outlook. 11
FY19 financial results
Cash flow

 ▪   Strong Hera cash flow of $55.1M, with lower sustaining capital but reduced base metal grades and realised prices.
 ▪   Peak cash flow strong $37.9M, despite large increase in sustaining mine development of $34M this year.
 ▪   Investment in growth of $22.9M (Peak Pb/Zn expansion and Exploration).
 ▪   First year of significant tax payments, $17.4M paid during the year.
 ▪   Stamp duty of $5.4M relating to Peak Mines acquisition paid during the year.

12
A look at the year ahead: FY20 by mine
Higher base metals output, lower gold production

 Peak                                                                                   Hera
 ▪   Gold production expected to be 52 – 59koz.                                         ▪     Gold production expected to be 33 – 36koz
 ▪   AISC expected to be higher than FY19; lower Au grade and                           ▪     AISC expected to be lower than FY19; lower Au grade forecast
     increased development                                                                    to be offset by lower operating costs and higher expected base
                                                                                              metal credits
 ▪   Processed throughput expected to be 580 – 610ktpa
                                                                                        ▪     Processed throughput expected to be similar to FY19
 ▪   Increased underground development rates
                                                                                        ▪     Reduced gold grades countered by higher base metals content
 ▪   Mining up-dip of Chronos – higher Pb/Zn, lower Au
                                                                                        ▪     Reduced unit costs and lower sustaining development
 ▪   Pb/Zn circuit upgrade target completion in Mar 2020 Quarter
                                                                                        ▪     Testing highly encouraging targets to extend operating life
 ▪   Increased mine and mill throughput from Jun 2020 Quarter
                                                                                              (Federation / Dominion and Main Southeast)
 ▪   Accelerated access to base of Kairos (Peak Deeps) – high
     margin tonnes, open
 ▪   Forecast reduction in unit opex per tonne from higher
     throughput, offset by impact of significantly increased operating
     underground development metres
 ▪   Exploring line-of-lode targets for Chronos and Perseverance
     style deposits

13              NOTE: This outlook is indicative only and subject to change in response to prevailing and/or expected operating and market conditions.
A look at the year ahead: FY20 group level
Investing in the business
FY19 actual FY20 outlook Estimated FY20 Group AISC of A$1,050 to A$1,250/oz is based on reference
Gold (koz) 118 85 – 95 base and silver metal prices equivalent to those used for the Company’s June
2019 Ore Reserves estimation: lead A$3,000/t, zinc A$3,421/t, copper
Lead (kt) 17.8 20 – 24 A$8,553/t and silver A$22/oz. Final AISC results will depend on the actual
Zinc (kt) 13.5 25 – 30 sales volumes, actual operating costs and actual prices of base metals
received over the outlook period.
Copper (kt) 4.3 4–6
Group AISC (A$/oz) 1,045 1,050 – 1,250
Group AISC is the total of on-site mining, processing and administrative costs, inventory adjustments, royalties, sustaining capital, corporate
Capex and exploration
general and administration expense, less by-product credits, divided by gold oz sold. By-product credits include silver, lead, zinc and copper
sales forecast over the outlook period. ▪ Growth capital: approx. A$40M, strongly weighted to 1H FY20
being predominantly the Pb/Zn plant upgrade at Peak (approx.
All-In-Sustaining Cost (AISC) A$38M capital in FY20).
▪ Significant quarterly variation expected driven by expected ▪ Sustaining capital: A$45-50M, with the majority associated with
throughput increases at Peak in 2H FY20 coupled with higher Peak mine development.
levels of base metal production from both operations.
▪ Exploration: current group FY20 budget of A$15M.
▪ Dec 2019 quarter expected to be particularly weak due to lower
forecast grades at Peak combined with partly restricted
throughput from planned tie-ins for the Pb/Zn plant upgrade.
Hedging
▪ Jun 2020 quarter should benefit from expected strong lift in ▪ 56koz gold hedged at an average of A$1,809/oz for FY20:
Peak throughput following targeted plant upgrade completion in
Mar 2020 quarter, with concurrent increase in high-grade ‒ 35koz at avg. A$1,748/oz to Nov 2019.
Chronos Pb/Zn ore processed. ‒ 21koz at avg. A$1,911/oz over remaining months to Jun
2020.
14 NOTE: This outlook is indicative only and subject to change in response to prevailing and/or expected operating and market conditions.A look at the year ahead: FY20 group level
D&A and impact of AASB16 - Leases
▪ D&A (Depreciation & Amortisation) in FY19 was $51.9M
▪ Based on asset values and planned mining and production levels, D&A for fixed assets in FY20 is expected to be 10-20% higher (excluding
AASB 16 Leases impact)
▪ AASB16 Leases Impact (adopted from 1 July 2019)
▪ Supply contract have been reviewed to determine if right to control the use of an ‘identified asset’ exists. For each ‘identified asset’ the
Company recognises a “Right of Use Asset” (ROUA) which is in simple terms is the present value of future lease payments implicit in
the supply contract, and a “Lease Liability” which is essentially the present value of future lease payments. The Company has identified
ROUAs totalling $18M, of which the majority relates to underground mining equipment owned by the mine contractor.
▪ The ROUA is amortised over the term of the lease (increasing reported depreciation) and the lease payment is removed from operating
costs and is applied against the lease liability (reducing reported Cost of Goods Sold). The ‘unwinding’ of the present value of the lease
liability is a finance charge, increasing reported finance costs.
▪ The forecast impact is additional D&A associated with the ROUA of $6-7M over the next 2 years, offset by reduced operating costs of
$5-6M and increased finance charges of $0.3-0.6M. See Appendix 4E and FY19 Financial statements for further detail.
▪ Reported AISC/oz is not expected to materially change based on the inclusion of lease costs in the calculation of AISC
15A look further ahead
FY21 and beyond
▪ Annual throughput at Peak in FY21 expected to be approaching nameplate 800ktpa capacity.
▪ Accelerated UG development expected to deliver access to the base of Kairos towards end of FY20; strong potential for prioritisation and
mining of high margin tonnes from Kairos in FY21.
▪ Growth capital expenditure in FY21 expected to reduce sharply following expected completion of the Peak Pb/Zn upgrade in 3Q FY20.
16 NOTE: This outlook is indicative only and subject to change in response to prevailing and/or expected operating and market conditions.CORPORATE INFORMATION: Aurelia Metals Limited ABN 37 108 476 384
Email: office@
ASX Code: AMI Website: www.aureliametals.com.au
FY19 financial results Registered Office: Level 2, 60-62 McNamara St Orange NSW
aureliametals.com.au
Tel: +61 (0)2 6363 5200
For further information please
Share Registry: Security Transfer Registrars Pty Ltd Tel: +61 (0)8 9315 2333
see Appendix 4E and FY19
Financial Statements released to Issued capital: 868M ord. shares, 9.2M unlisted perf. Rights
ASX on 23 August 2019 Substantial
Shareholders:
Colonial 8.0%, Australian Super 7.5%, Van Eck Global 5.7%
Interim Exec.
Chairman & Acting Cobb Johnstone
CEO:
Director & Interim
Mike Menzies
COO:
Non-Executive
Lawrie Conway, Susie Corlett, Paul Espie, Paul Harris
Directors
17You can also read