FY2018 OPERATING RESULTS - MAY 10, 2019 DENA CO., LTD - IR WEBCASTING
←
→
Page content transcription
If your browser does not render page correctly, please read the page content below

FY2018
Operating Results
May 10, 2019

DeNA Co., Ltd.

Financial Results Summary

(billion yen)                                                FY2017                                      FY2018                                FY2017      FY2018
                                                                                                                         QoQ           YoY                        YoY
                                              Q1       Q2          Q3        Q4     Q1      Q2      Q3       Q4         change       change                     change

Revenue (IFRS)                                  36.5     36.9         32.8   33.3    33.9    34.3    26.4     29.5          12%         -11%    139.4   124.1       -11%

Operating profit (IFRS)                          6.4         7.3      12.6    1.3     5.1     5.6     -2.1        4.9            -     288%      27.5    13.5       -51%

Operating profit (Non-GAAP)*                     7.4         7.2       2.3    1.2     4.6     5.4     -1.5        0.0            -      -97%     18.1     8.6       -53%

Profit before tax                                8.1         8.0      13.1    1.2     7.5     6.7     -2.5        6.5            -     436%      30.4    18.1       -41%

Profit for the period attributable to
                                                 5.3         5.0      12.4    0.2     5.2     4.4     -1.7        4.7            -    2189%      23.0    12.7       -45%
owners of the parent

EPS (Yen)                                     36.67     34.61      85.64     1.41   36.03   30.51   -11.43   32.36               -    2192%    158.34   87.47       -45%

Dividend Per Share (Yen)                                                                                                                        32.00   40.00       25%

Consolidated Dividend Payout Ratio (%)                                                                                                          20.2%   45.7%            -

(Reference) Financial results excl. highly seasonal Sports

Revenue                                         30.1     30.7         30.1   31.6    27.2    26.4    25.3     27.2           8%         -14%

Operating profit (Non-GAAP)*                     5.2         5.1       3.3    2.7     2.2     2.4      0.9        1.6       76%         -41%

                 *For full reconciliation of GAAP to Non-GAAP metrics, please see the reference materials at the end of the presentation.
                                                                                                                                                                         1
Reference: Financial Results Summary (Previous Segments)
•   Streamlined fixed costs, however Game business revenue and operating profit still declined year-on-year
•   The Sports business showed good performance
•   Strategic initiatives for new businesses broadly in line with initial plans
       (billion yen)                                         FY2017                                   FY2018                                     FY2017     FY2018
                                                                                                                        QoQ           YoY
                                                    Q1      Q2      Q3       Q4      Q1      Q2      Q3        Q4      change       change
                                                                                                                                                                   YoY

       Revenue                                      36.5    36.9      32.8   33.3    33.9    34.3    26.4      29.5      12%          -11%        139.4    124.1     -11%

         Game                                       24.3    24.4      24.2   25.1    21.5    21.2    19.8      21.1        7%         -16%         98.0     83.6     -15%

         E-commerce                                  4.0     4.0       3.8    4.3     3.4     2.7     2.9       3.3      16%          -23%         16.1     12.3     -24%

         Sports*                                     6.3     6.2       2.7    1.7     6.8     7.9     1.2       2.3      96%          36%          16.9     18.1      7%

         New Businesses and Others                   2.1     2.4       2.4    2.4     2.5     2.7     2.8       3.0        5%         24%           9.4     11.0     17%

         Adjustments                                 -0.2    -0.2     -0.3    -0.2    -0.2    -0.2    -0.2      -0.2            -            -      -0.9    -0.8         -

       Operating profit                              6.4     7.3      12.6    1.3     5.1     5.6     -2.1      4.9             -    288%          27.5     13.5     -51%

                          Operating profit margin    18%     20%      38%      4%     15%     16%         -     17%             -            -      20%     11%          -

         Segment profit / loss                       6.5     7.0       2.9    1.7     5.8     5.9     -1.3      0.6             -     -65%         18.1     11.0     -39%

          Game                                       7.3     6.1       5.7    6.0     5.3     4.7     3.1       5.1      62%          -15%         25.1     18.3     -27%

          E-commerce**                               -0.5    0.4       0.2    0.4     0.2     0.4     0.3       0.3        4%         -18%          0.5      1.3   168%

          Sports*                                    2.2     2.2      -1.0    -1.6    2.4     3.0     -2.4      -1.6        -            -          1.8      1.5     -20%

          New Businesses and Others                  -1.4    -1.1     -1.2    -1.8    -1.7    -1.8    -1.9      -1.9        -            -          -5.5    -7.3         -

          Overhead costs and Adjustments             -1.2    -0.6     -0.8    -1.3    -0.4    -0.5    -0.5      -1.4        -            -          -3.9    -2.8         -

         Other income***                             0.3     0.4      10.8    1.0     0.5     0.1     0.1       5.6 4833%            469%          12.4      6.3     -49%

         Other expenses***                           0.4     0.1       1.0    1.4     1.2     0.4     0.9       1.3      33%           -9%          3.0      3.8     26%

           *Supplemental information regarding the number of home games held per quarter for the highly seasonal baseball business:
            FY2018: Q1 33, Q2 37, Q3 0, Q4 3; FY2017: Q1 36, Q2 32, Q3 3, Q4 2
                                                                                                                                                                             2
           **During Q1 FY2017, recorded 872 million yen in cost of sales as corrections of costs attributed to DeNA Travel during FY2016 and before.
           ***Includes non-extraordinary gains and losses under Japanese GAAP (e.g. Loss on sales / retirement of tangible / intangible assets).
Segment Realignment
•     The following segment changes are underway to more accurately reflect DeNA’s current business portfolio &
      management strategy, in addition to consideration for accounting standards
         Until Q3 FY2018                                    Q4 & Full Year FY2018                                           FY2019 Onward

         Game business                                            Game business                                             Game business

      E-commerce business*                                  E-commerce business*

         Sports business                                         Sports business                                            Sports business

    New Businesses and Others                                 Automotive business                                       Automotive business

       Automotive business
                                                              Healthcare business                                        Healthcare business
       Healthcare business

             Others                                      New Businesses and Others                                 New Businesses and Others

            *All shares in DeNA Travel Co., Ltd. were transferred on May 31, 2018, and from that date its performance is not included in consolidated
             financial performance.
                                                                                                                                                        3
             All DeNA’s shares in Paygent Co., Ltd. were transferred on March 29, 2019, and from that date its performance is not included in
             consolidated financial performance.
Financial Results by Segment (IFRS)
 (billion yen)                                         FY2017                                    FY2018                                    FY2017     FY2018
                                                                                                                  QoQ           YoY
                                              Q1      Q2      Q3       Q4      Q1      Q2      Q3       Q4       change       change
                                                                                                                                                             YoY

 Revenue                                      36.5    36.9      32.8   33.3    33.9     34.3    26.4      29.5     12%          -11%        139.4    124.1     -11%

  Game                                        24.3    24.4      24.2   25.1    21.5     21.2    19.8      21.1       7%         -16%         98.0     83.6     -15%

  E-commerce                                   4.0     4.0       3.8    4.3     3.4      2.7     2.9       3.3     16%          -23%         16.1     12.3     -24%

  Sports*                                      6.3     6.2       2.7    1.7     6.8      7.9     1.2       2.3     96%          36%          16.9     18.1      7%

  Automotive                                   0.0     0.0       0.0    0.1     0.0      0.0     0.0       0.1    203%          52%           0.1      0.2     34%

  Healthcare                                   0.5     0.5       0.6    0.5     0.5      0.5     0.5       0.7     27%          23%           2.1      2.2      5%

  New Businesses and Others                    1.6     1.9       1.8    1.8     1.9      2.1     2.3       2.2      -2%         23%           7.1      8.6     20%

  Adjustments                                  -0.2    -0.2     -0.3    -0.2    -0.2    -0.2     -0.2     -0.2            -            -      -0.9    -0.8         -

 Operating profit                              6.4     7.3      12.6    1.3     5.1      5.6     -2.1      4.9            -    288%          27.5     13.5     -51%

                    Operating profit margin    18%     20%      38%      4%     15%     16%         -     17%             -            -      20%     11%          -

  Segment profit / loss                        6.5     7.0       2.9    1.7     5.8      5.9     -1.3      0.6            -     -65%         18.1     11.0     -39%

    Game                                       7.3     6.1       5.7    6.0     5.3      4.7     3.1       5.1     62%          -15%         25.1     18.3     -27%

    E-commerce**                               -0.5    0.4       0.2    0.4     0.2      0.4     0.3       0.3       4%         -18%          0.5      1.3   168%

    Sports*                                    2.2     2.2      -1.0    -1.6    2.4      3.0     -2.4     -1.6        -            -          1.8      1.5     -20%

    Automotive                                 -0.3    -0.2     -0.5    -0.9    -0.7    -0.7     -1.1     -1.1        -            -          -1.9    -3.6         -

    Healthcare                                 -0.2    -0.3     -0.2    -0.2    -0.3    -0.3     -0.4     -0.2        -            -          -0.9    -1.2         -

    New Businesses and Others                  -0.8    -0.6     -0.5    -0.7    -0.7    -0.8     -0.4     -0.5        -            -          -2.7    -2.4         -

    Overhead costs and Adjustments             -1.2    -0.6     -0.8    -1.3    -0.4    -0.5     -0.5     -1.4        -            -          -3.9    -2.8         -

  Other income***                              0.3     0.4      10.8    1.0     0.5      0.1     0.1       5.6 4833%           469%          12.4      6.3     -49%

  Other expenses***                            0.4     0.1       1.0    1.4     1.2      0.4     0.9       1.3     33%           -9%          3.0      3.8     26%

            *Supplemental information regarding the number of home games held per quarter for the highly seasonal baseball business:
             FY2018: Q1 33, Q2 37, Q3 0, Q4 3; FY2017: Q1 36, Q2 32, Q3 3, Q4 2
                                                                                                                                                                       4
            **During Q1 FY2017, recorded 872 million yen in cost of sales as corrections of costs attributed to DeNA Travel during FY2016 and before.
            **Includes non-extraordinary gains and losses under Japanese GAAP (e.g. Loss on sales / retirement of tangible / intangible assets).
Cost and Expense Breakdown (IFRS)
•      Continuing growth investments to build new business pillars, while working to improve our overall lean cost
       structure
(billion yen)                                                  FY2017                                                 FY2018                                   FY2017     FY2018
                                                                                                                                            QoQ        YoY                        YoY
                                                   Q1         Q2         Q3         Q4         Q1         Q2         Q3         Q4         change    change                      Change

Cost of Sales                                       15.0       14.2       14.2       14.3       13.9       14.7       13.6       14.0          3%        -2%      57.6    56.2       -2%

    Personnel Expenses                                  1.1        0.9        0.9        1.0        1.0        1.0        1.0        1.0       2%        6%        3.8     4.0       6%

    Depreciation and amortization                       2.1        2.2        2.5        2.6        2.4        2.5        2.5        2.4       -5%       -7%       9.5     9.9       4%

    Outsourcing expenses                                2.8        3.2        3.4        3.0        3.1        3.3        2.9        3.2       7%        4%       12.4    12.5       1%

    Commission fees                                     5.8        5.9        5.6        5.5        5.2        5.5        5.5        5.4       -2%       -3%      22.8    21.6       -5%

    Others                                              3.1        2.0        1.8        2.2        2.2        2.3        1.6        2.1      28%        -4%       9.1     8.2       -9%

Selling, general, and administrative expenses*      15.0       15.7       15.8       17.3       14.2       13.7       14.1       14.8          5%       -14%      63.7    56.9      -11%

    Personnel Expenses                                  4.1        3.5        3.5        3.7        3.6        3.4        3.5        3.8       9%        3%       14.7    14.3       -3%

    Sales promotion & Advertising expenses              2.6        3.3        3.5        3.6        2.6        2.4        2.6        2.2      -17%      -41%      13.0     9.7      -25%

    Outsourcing expenses & Commission fees              6.3        6.7        6.5        6.6        6.0        5.7        6.0        6.0       0%        -9%      26.1    23.7       -9%

    Others                                              2.0        2.2        2.4        3.3        2.2        2.2        2.0        2.9      46%       -13%       9.9     9.2       -6%

Other income**                                          0.3        0.4    10.8           1.0        0.5        0.1        0.1        5.6    4833%      469%       12.4     6.3      -49%

Other expenses**                                        0.4        0.1        1.0        1.4        1.2        0.4        0.9        1.3      33%       -14%       3.0     3.8      26%

Consolidated employee headcount                    2,441      2,344      2,387      2,475      2,306      2,342      2,394      2,437          2%        -2%     2,475   2,437       -2%

                 *Some cost items were reorganized in Q2 FY2018, and the costs for previous quarters have been restated to match.
                 **Includes non-extraordinary gains and losses under Japanese GAAP (e.g. Loss on sales / retirement of tangible / intangible assets).
                                                                                                                                                                                          5
FY2019 Approach
Ensure healthy profitability in core Game Business
• Manage costs in accordance with topline performance
• Aim to return to growth in FY2019 through the launch & growth of promising
new titles
Pursue further growth in the Sports business as a core business
segment
Proactive investment in new business pillars
6
Game Business: Operating Results
•   Q4 game business segment operating profit was in line with expectations, with contribution from New Years
    seasonality and anniversary events for key titles
•   In FY2018 the main focus was on operating existing titles. Total virtual currency consumption was 168.1
    billion (down 12% YoY). Continued to streamline marketing costs and outsourcing expenses, but revenue
    and operating profit were down year-on-year
        Virtual Currency Consumption*                                       Game Business Segment Operating Profit

                                                                                                                                  **

      FY2017                              FY2018                                     FY2017                            FY2018

          *Includes consumption of free virtual currency.
          **Impact from non-recurring accounting adjustment. This non-recurring accounting adjustment refers to past payment fees and other
                                                                                                                                                  7
          expenses related to accounts payable to an external platform operator that were not properly recognized. This adjustment corrects all
          cumulative error amounts through Q3 FY2018.
Game Business: Outlook for FY2019
•    DeNA expects to focus on launching promising new titles, maximizing titles in the growth phase, and
     continuing our streamlining efforts for fixed costs
•    Aim to achieve growth and pursue upside potential, by growing new hit titles
•    If financial performance is dependent only on existing titles, expect revenue and operating profit to decline
     on a year-on-year basis

    View on Virtual Currency Consumption                          View on Game Business Segment
           (Not to scale, illustrative purposes only)                     Operating Profit
                                                                      (Not to scale, illustrative purposes only)

                                           New Titles

                                                                                                     New Titles

                                         Existing Titles

                                                                                                    Existing Titles

          FY2018 Actual                  FY2019 Outlook             FY2018 Actual                  FY2019 Outlook

                                                                                                                      8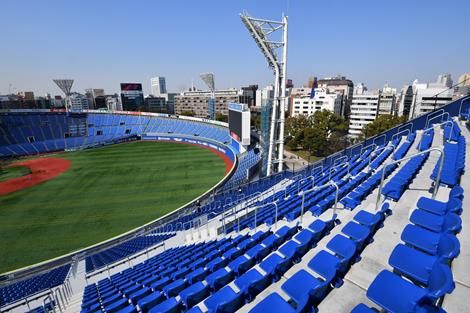
Game Business: Mid Term Strategy
• Shifting to pipeline strategy focused on major IP to maximize & prolong mid term profit
• For FY2019, further strengthening the following two areas while pursuing our strategy
- Enhancing functions and structure to enable global title launch and live operations
- Expansion of development lines, including use of other resources and methods
Establishing & promoting partnerships, such as with IP holders
Unique position as a Japanese company in the Chinese market,
DeNA’s Strengths
centered on localization & IP strategy
Live game operations
Mid Term Formation of a new title lineup emphasizing use of major IP, and
Pipeline Strategy making those games into global hits
9Game Business
• For Nintendo partnership titles, using events, major updates, and other methods to ensure that consumers
continue to enjoy our existing apps
• Accepting applications for closed beta testing for Mario Kart Tour (Scheduled for release in summer 2019)
© 2016 Nintendo © 2017 Nintendo / INTELLIGENT SYSTEMS
© 2017 Nintendo © 2019 Nintendo
*The titles referenced on this slide are published by Nintendo.
10Game Business
• Plan to launch a new and exciting smartphone game this fiscal year based on the globally popular Pokémon
franchise, in partnership with The Pokémon Company
• More details, such as information about the game and launch timing, will be announced later
11Game Business
• Three titles launched so far in FY2019
Towa no Nanoka Attack on Titan
(Japanese version TACTICS
of Forever Seven
Days)
Torikago
12Sports Business
• 2018 season stadium attendance exceeded 2 million for the first time in the team’s 70 year history
• Ticket sales and other revenue sources during the regular baseball season increased year-on-year
• Operating profit was down slightly year-on-year due to factors such as investment in the Kawasaki Brave
Thunders in the B.League
Sports Business Segment Performance Baseball-Related Revenue* Composition
Other
Ticket Sales
(Sponsorships,
Broadcast rights,
etc.)
Goods & Concessions
*Revenue from April 2018 to March 2019.
13Sports Business
• Yokohama Stadium expansion progressing as planned with a portion of the total expected new seats
completed and available for the 2019 season. So far this season maintaining good attendance levels from
last season
• Aim to grow both revenue and operating profit for the segment in FY2019, with help from improved
financial performance of the Kawasaki Brave Thunders
• Continuing to build foundation to realize the Smart Venue* Concept in the mid to long term
Expansion of Yokohama Stadium Underway Stadium Attendance**
***
©YDB
*Term promoted by the Development Bank of Japan Inc. to refer to multifunction complexes to promote regional exchange.
**Data for Yokohama DeNA BayStars home games each regular season (including home games held outside Yokohama Stadium).
14
***Data for 2019 is from games held from the start of the season until the end of April.Growth Investment to Create New Business Pillars
• Continuing proactive investment, primarily in Automotive and Healthcare
• Proceeding with investment by making rational judgments appropriately and in a timely manner based on
factors such as trends in market conditions, while monitoring the progress of strategies
• Continue to consider options for capital policy for our new business areas, including use of external capital
Growth Investment* Actual Performance and Forecast
Social Live
Streaming & Automotive
Others
FY2019*
FY2018*
Approx.
7.3 billion yen
10.0 billion yen
Healthcare
*Full year segment loss amount in the previous New Businesses and Others segment. FY2018 shows the actual performance, and FY2019 is
an approximate calculation based on the same segment definition.
15Automotive Business
Transportation dysfunction is a key issue for the Japanese economy
―Traffic congestion, aging demographics, overcrowded trains, rapid urbanization, competition for
use of urban spaces
Anything, Anywhere.
Creating a world where people and things
get where they need to go in safety and comfort
― Reform transportation from its foundation, using the internet & AI ―
Making Providing freedom of mobility using
Creating a future where anyone can
on-demand transportation services and autonomous drive
have access to multiple “My Cars”
even more convenient technology*
*New robo-vehicle mobility service Easy Ride, being developed jointly with Nissan Motor Co., Ltd.
16Automotive Business
• New taxi dispatch app MOV is off to a solid start
• In FY2019 established business model in Kanagawa and brought on more operators in other areas. For FY2020
aim to be the No. 1 for dispatches in Japan, and to achieve meaningful financial contribution starting from
FY2021
Daily Dispatches (Quarter Averages) Focus Areas for FY2019
(FY2018 Q1 is the base quarter = 1.0x)
Focusing on establishing business model
• Became No. 1 taxi dispatcher** in Kanagawa
9.4x • Validating & establishing business model with
Kanagawa 1. Dispatch Fee, 2. Monthly Fee (related to
Prefecture device usage, etc.), 3. Advertising, & 4. AI
* Support
6.8x • Measuring effectiveness of return on
investment related to user acquisition &
driving more usage
3.5x
Focusing on operators
Tokyo Met.
Area • Focus on onboarding more operators,
including through various promotions
1.0x Kyoto
• Secured partner operators in Osaka & Kyoto,
Osaka
aiming to establish business foundation in
Kobe
those metropolitan areas
FY2018
*Some areas in Kanagawa Prefecture excluded. Area of operations in Tokyo is focused on central Tokyo.
17
**Based on the number of vehicles of our operator members.Automotive Business
• In April 2019, the peer-to-peer car sharing business Anyca was taken over by DeNA SOMPO Mobility, a joint venture
between DeNA and SOMPO Holdings, which has a physical insurance sales network and data on vehicles and drivers
from approximately 130 million vehicle insurance policies, enabling them to deliver safety and comfort
• Engaging in business in areas with synergies with Anyca and where Anyca knowhow will be useful, such as services
utilizing car leases
Ownership: 51%* Ownership: 49%*
Peer-to-peer car sharing business
• Operation of Anyca, the peer-to-peer car sharing service
• Exploration of providing insurance dedicated to peer-to-peer car
sharing
My Car Lease Business (Business by subsidiary DeNA SOMPO Carlife)
• Plan to sell the first car lease products approved in Japan through
Anyca from June 2019 in Tokyo, Osaka, and Aichi
• By offsetting lease fees through car sharing when not in use, aim
to make it so that anyone can have the “My Car” they always
dreamed of, combining sharing and a subscription
*DeNA SOMPO Mobility Co., Ltd. was a wholly-owned subsidiary of DeNA on the date of its establishment. On April 15, 2019 a third-party
allotment to SOMPO Holdings was undertaken, which resulted in stated capital of 2.5 billion yen and the ownership percentages shown on
18
this slide.Healthcare Business
• Under the mission of “Making the shift from ‘sick care’ to ‘healthcare’ and lengthening healthy lifespans,”
developing businesses in Healthcare Services and R&D areas
• Plan to grow revenue from insurance integrated with wellness programs and create business plan for using
early cancer detection system in FY2020, and aim to achieve meaningful financial contribution starting from
FY2021 Present FY2019 FY2020
Build evidence Innovate & create businesses in key industries by
Healthcare Services
through services & data utilizing evidence & services
1. Drive changes in awareness & behavior through
services (Ex: raise health awareness, increase
Insurance Integrated with Wellness
total steps) Programs*
• Plan to start providing offering from FY2019
2. Analyze impact of service on illness/medical costs • Create hit product from FY2020, then achieve
(3 million medical checkup/insurance claim data) meaningful financial contribution from
FY2021
Technological development and R&D
Practical Use
using AI & technology
R&D
1. Joint research with external parties such as pharmaceutical companies
Creating business**
from early cancer
detection using deep
2. Early cancer detection using deep learning learning in 2021
*DeNA defines insurance integrated with wellness programs as insurance that not only makes determinations based on current physical state and provides a guarantee in case
you get sick, but rather also incorporates healthcare services and provides a variety of support for your continued health & wellness and illness prevention.
**Aim to develop a business after PMDA’s review and approval. PMDA is an acronym for the Pharmaceuticals and Medical Devices Agency of Japan, which is an organization 19
that conducts the scientific review for quality, efficacy, and safety of pharmaceuticals and medical equipment. https://www.pmda.go.jp/english/about-
pmda/outline/0005.htmlInsurance Integrated with Wellness Programs
• Accumulating correlation evidence of the impact of usage of our services and lifelogs on people’s illness
prevention and reducing medical costs
• Partnering with multiple insurance companies. Planning to launch first product in 2019, and aim to create hit
product in FY2020
• Envision a business model where we receive a revenue share and a share of the savings from lifestyle illness
reduction for jointly developed products
Evidence Examples New Agreement to Partner with
Reduced risk of lifestyle illness*
Asahi Life Mutual
through usage of ** Plan these initiatives to promote customer
health & wellness and reduce the risk of
illness
1. Provide KenCoM to Asahi Life Mutual
customers (planned for 2H FY2019)
2. Jointly develop & provide insurance
integrated with wellness programs
(planned for FY2020 onwards)
Non KenCoM Users 2 Years Continuous Use
*Lifestyle illnesses include diabetes, hypertension, hyperlipidemia, hyperuricemia, liver dysfunction, ischemic heart disease, arterial occlusion, hypertensive renal disorder, gout,
chronic kidney disease, urolithiasis, cirrhosis, and liver cancer. The impact of usage of our services and lifelogs on people’s illness prevention is currently being reviewed.
**KenCoM is a health & wellness promotion service with a dedicated app that allows users to view their medical checkup results, provides personalized daily health information, 20
holds events to encourage walking, and gives points to users to enable people to enjoy being healthy. Currently works with about 80 health insurance societies, with 3 million
members.Establishing a Venture Capital Fund*
• Establishing an investment limited partnership (name to be determined at a later date)
• The fund will cover the two initiatives described below as its main focus, and will aim to create a foundation for
fostering future entrepreneurs and creating new businesses
• Also aiming to contribute to energizing the startup & innovation ecosystem, and incubate an entrepreneurial
culture
Summary of the Fund (Scheduled)
Establishment date Summer 2019
Total investment Approx. 10.0 billion yen*
*Plan to employ a capital call approach, and the above investment amount is the expected
amount future amount.
Limited Partner (LP) DeNA Co., Ltd.
Limited liability partnership,* which is formed from a subsidiary of DeNA**
General Partner (Representative: Tomoko Namba) & multiple independent individuals as partners
*Limited liability partnership to be newly formed
(GP)
**This subsidiary is planned to be newly established, and expected to be a subsidiary 100% of
whose outstanding stocks are owned by DeNA
1. Support for independent entrepreneurial activities for DeNA employees &
also open to others
Investment goal
2. Investment in startups
(Plan to invest broadly, from pre-seed to later follow-on)
*This document is merely intended to provide disclosure about DeNA’s activities, and is not intended as a solicitation for investment.
21View for FY2019
• The consolidated financial results forecast for FY2019 cannot be provided due to the difficulty of reasonably
& accurately estimating the figures
• Multiple exciting new titles are in development, including Mario Kart Tour, the partnership title with
Nintendo scheduled for launch in summer 2019.
• If these titles make a significant contribution during the fiscal year, DeNA believes that the Game Business
Game Business can aim to achieve year-on-year growth again. On the other hand, DeNA believes that if business
operation remains dependent only on existing titles, the Game Business will see year-on-year declines in
revenue and profit. This makes it difficult to reasonably & accurately estimate the forecast at this time.
• Yokohama Stadium expansion is underway, and partial operation of the completed sections started in the
2019 season. DeNA expects increases in segment revenue and profit for FY2019, including improved
Sports Business financial performance of the Kawasaki Brave Thunders.
• In FY2019 scheduled to have 35 games in Q1 and 34 games in Q2. The baseball schedule beyond Q2 has
not yet been announced, and thus 2H games are unknown at this time.
• As shown on slide 15, DeNA currently expects a segment loss of approximately 10 billion yen* for FY2019,
New Business primarily driven by the Automotive business and Healthcare business.
*This is the segment loss amount for the previous “New Businesses and Others” segment.
Areas • DeNA will proceed with investment by making rational judgments appropriately and in a timely manner
based on factors such as trends in market conditions, while monitoring the progress of strategies
Other factors & • In FY2018, DeNA made transactions such as the transfer of its shares in DeNA Travel Co., Ltd. and Paygent
points to Co., Ltd.,* and a gain on the sale of shares in a subsidiary mainly boosted other income.
consider • There are currently no matters to be disclosed that would constitute such temporary factors for FY2019.
*For details, please refer to “Notice Regarding Conclusion of a Memorandum of Understanding Regarding Change in DeNA Subsidiary (Share
Transfer)” disclosed on May 14, 2018 and “Notice Regarding Change in DeNA Subsidiary (Share Transfer)” disclosed on January 31, 2019.
22
The performance of DeNA Travel Co., Ltd. and Paygent Co., Ltd. was removed from the Group’s consolidated financial performance after
such transfer.Share Buyback
• A share buyback will be undertaken to increase capital efficiency, to implement a flexible capital policy that
responds to changes in the business environment, and to improve shareholder returns by increasing the share
value
Details of the Share Buyback
Class of shares subject to
DeNA common stock
repurchase
Total number of shares to Up to 38,000,000 shares
repurchase (26.14% of the total number of shares issued, excluding treasury stock)
Total cost of share buyback Up to 50.0 billion yen
Repurchase period May 13, 2019 – April 30, 2020
Repurchase method Purchase on the Tokyo Stock Exchange
(Reference) DeNA shareholdings as of March 31, 2019
Total number of issued shares (excluding treasury stock): 145,349,764 shares
Treasury shares: 5,460,269 shares*
*DeNA has adopted the “Stock Grant ESOP Trust” as an incentive plan for its employees. The above number of treasury stock includes
274,984 shares of the Company’s stock, owned by the Stock Grant ESOP Trust account.
23Mission
Delight and Impact the World
Vision
As an eternal venture, bring delight
to the world using the internet and AI
How DeNA defines eternal venture:
We define eternal venture as continuously challenging ourselves to provide new value, while also ensuring that
social responsibility is a key priority
24Reference Materials
IFRS to Non-GAAP reconciliation
Consolidated cash flows
Consolidated financial position
Strengthening business portfolio and view for mid to long term growth
Segment breakdown
25IFRS to Non-GAAP Reconciliation
(billion yen) FY2017 FY2018
FY2017 FY2018
Q1 Q2 Q3 Q4 Q1 Q2 Q3 Q4
Reconciliation of Operating profit to Non-GAAP operating profit
Operating profit (IFRS) 6.4 7.3 12.6 1.3 5.1 5.6 -2.1 4.9 27.5 13.5
Accounting adjustments related to seasonality & one-time factors +0.1 -0.1 -0.2 +0.5 -0.2 -0.1 +0.6 +0.6 +0.3 +0.9
Acquisition and restructuring related expenses +0.9 +0.3 +0.5 +0.3 +0.0 +0.0 +0.0 +0.0 +2.0 +0.1
Sales and disposition related gains - -0.1 -10.7 -0.9 -0.4 - - -5.5 -11.7 -5.9
Non-GAAP operating profit 7.4 7.2 2.3 1.2 4.6 5.4 -1.5 0.0 18.1 8.6
Profit (loss) from seasonal sports business -2.2 -2.2 +1.0 +1.6 -2.4 -3.0 +2.4 +1.6 -1.8 -1.4
Non-GAAP operating profit excluding Sports 5.2 5.1 3.3 2.7 2.2 2.4 0.9 1.6 16.3 7.1
(billion yen) FY2017 FY2018
FY2017 FY2018
Q1 Q2 Q3 Q4 Q1 Q2 Q3 Q4
Reconciliation of Operating profit to Non-GAAP EBITDA
Operating profit (IFRS) 6.4 7.3 12.6 1.3 5.1 5.6 -2.1 4.9 27.5 13.5
Accounting adjustments related to seasonality & one-time factors +0.1 -0.1 -0.2 +0.5 -0.2 -0.1 +0.6 0.6 +0.3 +0.9
Acquisition and restructuring related expenses +0.9 +0.3 +0.5 +0.3 +0.0 +0.0 +0.0 0.0 +2.0 +0.1
Sales and disposition related gains - -0.1 -10.7 -0.9 -0.4 - - -5.5 -11.7 -5.9
Depreciation and amortization +2.6 +2.7 +3.0 +3.1 +2.8 +2.7 +2.8 2.6 +11.4 +10.9
Retirement of fixed assets (excl. one-time factors) +0.3 +0.0 +0.5 +0.3 +1.2 +0.2 +0.1 1.1 +1.2 +2.5
Non-GAAP EBITDA 10.4 10.0 5.8 4.5 8.5 8.4 1.4 3.7 30.6 21.9
26Consolidated Cash Flows
(billion yen)
FY2017 FY2018
Operating cash flow (A) 37.7 23.0
Profit before tax 30.4 18.1
Depreciation and amortization 11.4 10.9
Income tax paid -3.6 -2.3
Others -0.5 -3.7
Investing cash flow (B) -16.5 -21.0
Financing cash flow -5.4 -4.7
Cash dividends paid -4.6 -4.6
Cash dividends paid to non-controlling shareholders -1.2 -0.7
Others 0.4 0.6
FCF ((A)+(B)) 21.2 2.0
Cash and cash equivalents (Consolidated) 103.7 101.4
(Non-consolidated basis) 76.6 85.0
27Consolidated Financial Position
(billion yen) As of As of
Mar. 31, 2018 Mar. 31, 2019
Current assets 157.1 133.7
Cash and cash equivalents 103.7 101.4
Non-current assets 187.5 162.7
Goodwill 46.3 46.0
Intangible assets 18.8 15.4
Investments accounted for using the equity method 16.5 18.7
Other non-current financial assets 99.6 70.6
Total assets 344.6 296.5
Current liabilities 59.4 31.9
Non-current liabilities 14.1 7.7
Equity 271.1 256.9
Total equity attributable to owners of the parent 263.3 251.7
Total liabilities and equity 344.6 296.5
28Strengthening Business Portfolio and
View for Mid to Long Term Growth
• Continue to strengthen the core game business
• Over the long term, create multiple new business pillars
• Use FY2020 as a checkpoint to confirm our progress towards
Operating Profit
achieving our long term goals
100 billion yen level
• Proactively utilize M&A opportunities to strengthen our
portfolio
Other Pillars
Checkpoint to
Long Term Goal
Operating Profit
23.2 billion yen
Game
Business
FY2016 Actual FY2020 Long Term Goal
29Segment Breakdown
Segments Businesses
Game Business Japan and international game businesses
E-commerce Business Auction (Mobaoku)
Sports Business Baseball, Basketball, Running Club, etc.
Automotive Business MOV, Anyca, etc.
Healthcare Business MYCODE, KenCoM, Aruite Otoku, etc.
Sub-segment names (major service names in parenthesis)
New Businesses and
• IP-generating platform (Manga Box, Everystar)
Others • Other internet services (SHOWROOM, Pococha)
*All shares in DeNA Travel Co., Ltd. were transferred on May 31, 2018, and from that date its performance is not included in consolidated
financial performance.
30
All DeNA’s shares in Paygent Co., Ltd. were transferred on March 29, 2019, and from that date its performance is not be included in
consolidated financial performance.The information and data contained within this presentation and these presentation
materials have been determined based on information available as of May 10, 2019. The
company disclaims any obligation to update or revise such information and data, whether
as a result of new information, future events or otherwise.
In addition, any forward-looking statements contained in this presentation or these
presentation materials are based on our opinions and information available as of May 10,
2019, and involve uncertainty. Please be aware that the actual performance data and
similar information are subject to influence from diverse factors and may differ from the
forecasts presented herein.
DeNA Co., Ltd.
31You can also read


