FY21 RESULTS PRESENTATION - 16 August 2021 - Is - SCA Property Group
←
→
Page content transcription
If your browser does not render page correctly, please read the page content below
Is

     FY21 RESULTS
     PRESENTATION
     16 August 2021

                      slide
                              Mount Isa, QLD
AGENDA
1. OVERVIEW OF FY21 RESULTS
2. FINANCIAL PERFORMANCE
3. OPERATIONAL PERFORMANCE
4. GROWTH OPPORTUNITIES
5. KEY PRIORITIES AND OUTLOOK
6. QUESTIONS
7. APPENDICES

                                slide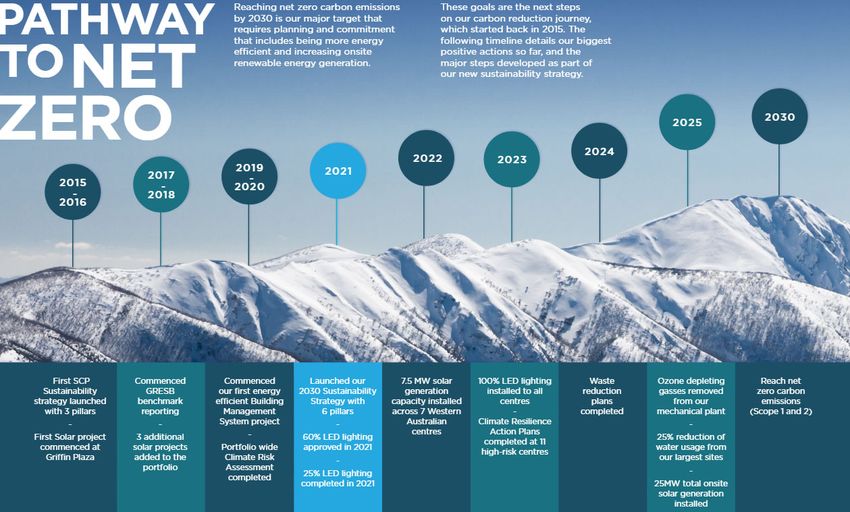
1
OVERVIEW OF
FY21 RESULTS
Anthony Mellowes
Chief Executive Officer

                          slide 3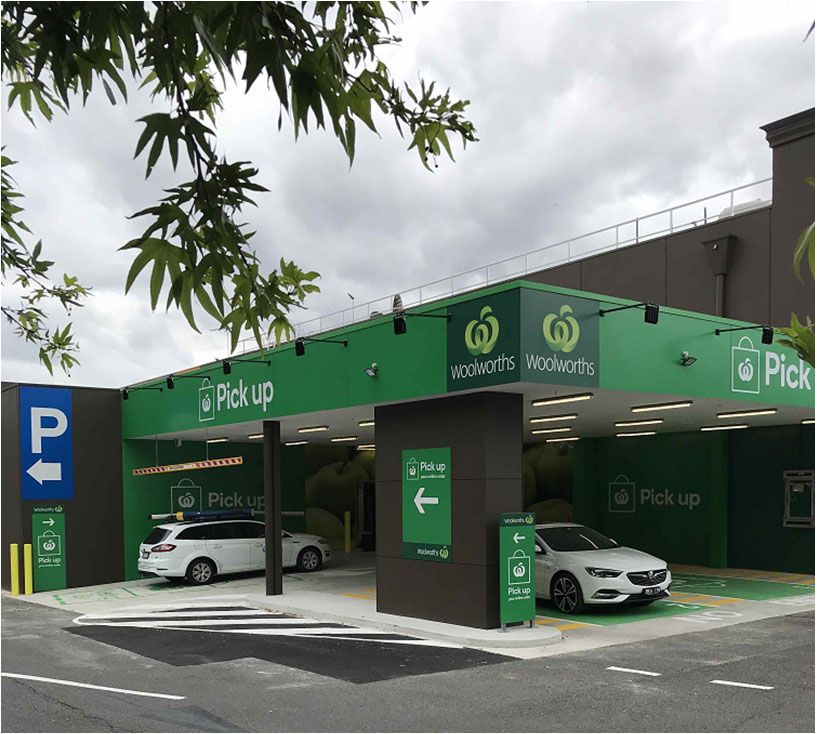
FY21 HIGHLIGHTS

               FINANCIAL                                                                CAPITAL                                                        ACTIVE PORTFOLIO
             PERFORMANCE                                                              MANAGEMENT                                                         MANAGEMENT

                 Net Profit After Tax 1                                                         Gearing 3                                     Portfolio occupancy 6 Specialty vacancy 6
       $462.9m, up by 441.4%                                                       31.3%, up by 5.7%                                                  97.4%                            5.1%

                     FFO per unit 2                                                          NTA per unit 4                                        Portfolio weighted average cap rate 7
        14.76 cpu, up by 0.8%                                                      $2.52, up by 13.5%                                                                 5.90%

                Distribution per unit 2                                  Weighted cost of               Weighted average
                                                                                                                                                                    Acquisitions 8
     12.40 cpu, down by 0.8%                                                 debt 5                      debt maturity 5
                                                                           2.4% pa                          5.3 yrs                                                $452.4m

1.   Net Profit After Tax is as per the Financial Report, for the year ended 30 June 2021 compared to the year ended 30 June 2020
2.   FFO per unit is a non-IFRS measure, for the year ended 30 June 2021 compared to the year ended 30 June 2020. Final distribution of 6.70 cpu in respect of the six months ended 30 June 2021 will be paid on
     31 August 2021. First half distribution of 5.70 cpu was paid on 29 January 2021. “cpu” stands for Cents Per Unit
3.   At 30 June 2021, compared to 30 June 2020. Gearing is calculated as Finance debt, net of cash (with USD denominated debt recorded as the hedged AUD amount) divided by total tangible assets (net of cash
     and derivatives)
4.   At 30 June 2021, compared to 30 June 2020
5.   At 30 June 2021. The corresponding numbers at 30 June 2020 were weighted cost of debt of 3.5% and weighted average debt maturity of 5.1 years
6.   At 30 June 2021. The corresponding numbers at 30 June 2020 were portfolio occupancy of 98.2% and specialty vacancy of 5.1%
7.   At 30 June 2021. Weighted average capitalisation rate at 30 June 2020 was 6.51%
8.   During the period we acquired Auburn Central (New South Wales) for $129.5m, Bakewell Shopping Centre (Northern Territory) for $33.0m, Bakewell petrol station (Northern Territory) for $6.4m, vacant land
     adjacent to the Greenbank (Queensland) neighbourhood centre for $10.0m, Cooloola Cove (Queensland) for $18.6m, Katoomba Marketplace (New South Wales) for $55.1m, Mt Isa (Queensland) for $44.2m,
     Warnbro Fuel (Western Australia) for $5.1m, Marketown East (New South Wales) for $82.0m and Marketown West (New South Wales) for $68.5m, excluding transaction costs.

                                                                                                                                                                  slide 4
KEY ACHIEVEMENTS
Strong rebound in second half of FY21
                    •   Our convenience-based centres have benefited from the shift to shopping locally
                          – Anchor tenants have experienced strong sales growth and turnover rent has increased
                          – Specialty sales recovered quickly following the easing of restrictions
                          – Strong rebound in leasing spreads in the second half
                          – Cash collection rates returned to pre-pandemic levels by the end of the period
  OPTIMISING THE    •   We have continued to progress our sustainability program, including setting a Net Zero target for scope 1 and 2 carbon
  CORE BUSINESS         emissions by 2030
                    •   COVID-19 negatively impacted some of our specialty tenants during FY21
                          – We provided $10.5m rental assistance to over 800 tenants
                          – The impact of current restrictions in a number of States on the FY22 financial year is uncertain, however we
                            expect specialty tenants to again rebound quickly once restrictions are eased

                    •   We contracted to acquire 9 convenience-based centres for $574.2m in FY21
                         – The acquisitions of seven centres for $452.4m were completed during the period
     GROWTH              – In June 2021 we agreed terms to acquire two further centres being Drayton for $34.3m and Raymond Terrace
                             for $87.5m. Settlement of both transactions occurred in July 2021
  OPPORTUNITIES
                    •   Wind-up of SURF1 and SURF 2 completed during FY21 achieving an IRR of 11% and 12% respectively for unitholders
                        since the funds commenced in 2015 and 2017 respectively

                    •   Valuation uplift of $409.4m (or 13.0%) for like-for-like properties during FY21
                    •   Balance sheet remains in a strong position
     CAPITAL              – Gearing of 31.3% is within our target range of 30-40%
   MANAGEMENT             – Weighted average cost of debt is 2.4% with a weighted average term to maturity of 5.3 years
                          – Cash and undrawn facilities of $290.6m

    EARNINGS        •   FY21 FFO per unit of 14.76 cpu represents an increase of 0.8% vs FY20
 & DISTRIBUTIONS    •   FY21 Distributions of 12.40 cpu represents a decrease of (0.8)% vs FY20

                                                                                                           slide 5
2
FINANCIAL PERFORMANCE
Mark Fleming
Chief Financial Officer

                          slide 6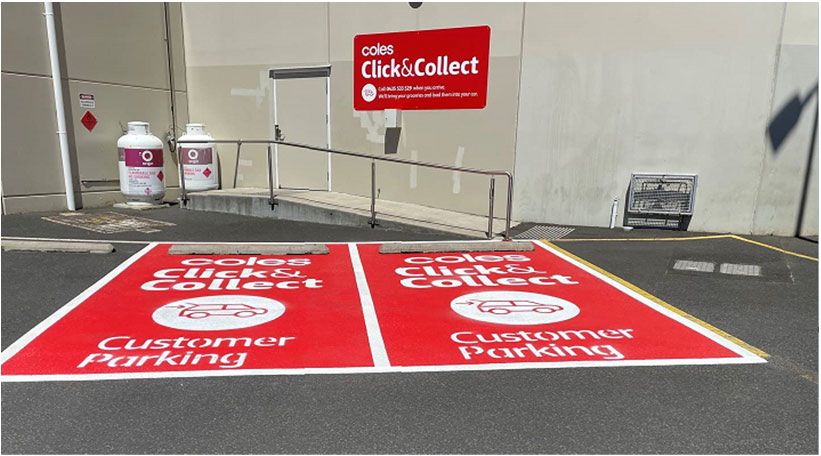
IMPACT OF COVID-19
Strong sales growth and a return to pre-COVID-19 cash collection rates
                                                                                                     20%
                                                                                                             Moving annual turnover growth (%) 1
 Sales growth trends
                                                                                                     15%
 •   Sales growth has been volatile throughout the COVID-19 period
       –   Australia-wide restrictions significantly impacted tenant sales
           between March and May 2020
       –   Restrictions significantly impacted sales in Victoria between                             10%                                                                                              9.7%
                                                                                                                                                                                                      9.2%
           August and October 2020
                                                                                                                                                                                                       6.4%
 •   Strong MAT sales growth across the full financial year                                            5%                                                                                              4.6%
        –  Sales growth rates stabilised in May and June 2021 for most                                                                                                                                 3.2%
           categories at above historical levels
                                                                                                       0%
                                                                                                             Jul-20 Aug-20 Sep-20 Oct-20 Nov-20 Dec-20 Jan-21 Feb-21 Mar-21 Apr-21 May-21 Jun-21

                                                                                                                      Supermarkets              DDS            Mini Majors        Speciality     Total sales
                                                                                                     (5%)

 Cash collection trends
                                                                                                              Cash collection as a % of gross invoiced rent 2
 •   Total cash collection rates increased to over 100% between April and                                    101% 69% 80% 95%           98%     99% 98% 99%           99% 100% 98% 96% 99% 104% 103% 105%
     June 2021
                                                                                                                                                                       15% 14% 13%
       –    Cash collected within 30 days returned to pre-COVID-19 levels                                     16%                      22% 17% 14% 14% 14% 14% 13% 14%
                                                                                                                               35% 23%
            of around 90%                                                                                                                                              89% 89% 92%
                                                                                                              85%                              85% 85% 86% 84% 83% 85%
                                                                                                                           23%             81%
                                                                                                                     8%            75% 77%
 •   Of the rent invoiced in FY21, 96% was collected prior to 30 June 2021
           Rental receivable at 30 June 2021 was $13.4m (compared to                                                61%
        –                                                                                                                  57% 60%
           $22.3m at 30 June 2020)
        –  Some of the rent collected during FY21 related to FY20
           invoices

                                                                                                              Mar    Apr May Jun Jul Aug Sep Oct Nov Dec Jan Feb Mar Apr May Jun
                                                                                                              20     20   20    20     20   20     20   20 20    20     21    21     21    21   21 21
                                                                                                                        Collected in the month invoiced    Collections relating to previous months

                                                                                                                                                                       slide 7
1.   Moving annual turnover growth compares like-for-like stores for the 12-month period ending in the relevant month compared to the same period in the prior year
2.   Cash collection is calculated as total rental receipts as a percentage of total rental invoiced (excludes waivers and deferrals)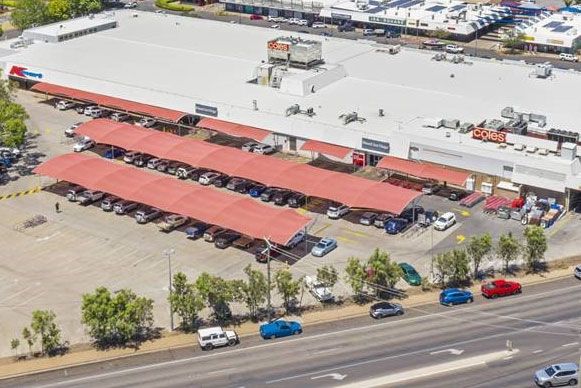
IMPACT OF COVID-19
The earnings impact of COVID-19 is starting to reduce
COVID-19 impact on AFFO                                                                                Estimated COVID-19 Impact on FY21 ($m)
                                                                                                                                         Other Direct         Reduction in ECL           FY21 AFFO
•    The estimated direct impact of COVID-19 on the FY21 AFFO result                                           Waived Rent             COVID-19 Impacts          Allowance           COVID-19 Direct Impact
     is approximately $7.3m (FY20; $20.5m):
        –  Waived rent of $6.9m during the period (FY20: $4.5m) is not
           included in rental income or receivable
        –  Other direct COVID-19 impacts of $4.4m include additional
                                                                                                                    (6.9)                                                                        (7.3)
           property related expenses, rent freezes and reduced other
           income
        –  Expected credit loss allowance (“ECL”) has reduced because
           increased allowances for deferred and unpaid rent during
           FY21 were offset by greater than expected collections of FY20                                                                       (4.4)                    4.0
           unpaid rent 1
•    Indirect impacts such as increased vacancy, reduced leasing
     spreads and increased lease incentives are difficult to attribute and
     quantify                                                                                           Distribution Per Unit (half years, cpu)

                                                                                                                                               0.4                      0.4                      0.6
Distribution per unit (cpu) trend                                                                                                                                       0.7                      0.2
                                                                                                                                               2.1                      0.7
•    Distribution per unit trend is improving from prior year:
        –   COVID impact is reducing
        –   Equity raising proceeds now fully redeployed                                                           7.5
                                                                                                                                                                                                 6.7
•    When the impact of the COVID-19 pandemic has ended, we would                                                                                                       5.7
                                                                                                                                               5.0
     expect to return to the pre-COVID level for AFFO per unit (and
     therefore Distributions per unit) of at least 7.5cpu per half year (or
     15.0cpu pa)

                                                                                                                1H FY20                     2H FY20               1H FY21                      2H FY21

                                                                                                                  DPU        COVID-19 estimated impact       Equity raise estimated dilution      Other

1.   Total rent receivable at 30 June 2021 was $13.4m against which an expected credit loss allowance (“ECL”) of $9.8m has been raised. Deferrals of $3.6m
     during the period (FY20: $4.3m) are included in rental income and receivable offset by an ECL allowance. The ECL calculation includes 100% unbilled
     deferrals, expected loss % of unpaid debt, offset by bank guarantees. The FY21 ECL allowance has reduced by $5.5m due to an improved trading             slide 8
     environment (from $15.3m at 30 June 2020). Of this movement, $1.5m was written off (no P&L impact), and the remaining $4.0m reduced property
     expenses. Further information can be found in note 3 of the Financial Report.
PROFIT & LOSS
For the year ended 30 June 2021                                                                                                                                        30 June       30 June   % Change
                                                                                                                    $m                                                  2021          2020
                                                                                                                    Anchor rental income                                134.2         128.7      4.3%
•    Net property income increase on the prior year is primarily due to acquisitions and
     reduced COVID-19 related impacts                                                                               Specialty rental income                                125.8      126.1     (0.2%)
                                                                                                                    Recoveries and recharge revenue                         36.9      34.2       7.9%
•    Funds management income includes $0.5m of performance fee from SURF 1,
     $0.7m performance fee for SURF 2, $0.6m of disposal fee from SURF 2 and $0.2m                                  Other income                                            6.3        8.1      (22.2%)
     of disposal fee from SURF 3 in addition to $0.2m of management fees
                                                                                                                    Straight lining and amortisation of incentives         (12.6)     (8.1)     55.6%
•    Corporate costs increase due to increase in D&O insurance of $1.8m, no KMP                                     Gross property income                                  290.6      289.0      0.6%
     STIP in FY20 ($1.5m increase in FY21) and other expenses of $0.4m
                                                                                                                    Property expenses                                      (100.1)   (108.6)    (7.8%)
•    Fair value adjustments:                                                                                        Property expenses / Gross property income (%)1         33.0%     36.6%      (3.6%)
       –    Investment properties: like-for-like valuation increased due to capitalisation
                                                                                                                    Net property income                                    190.5      180.4      5.6%
            rate tightening, valuation NOI increase, and a removal of any allowance for
            future lost rents as a result of the COVID-19 pandemic                                                  Distribution income from CQR                            1.6        1.7      (5.9%)
       –    Derivatives: USPP cross-currency derivative mark-to-market value
            decreased due to A$ strengthening and higher interest rates
                                                                                                                    Funds management income from SURF funds                 2.2        1.7      29.4%
       –    Unrealised foreign exchange gain: decrease in the A$ value of our US$ debt                              Net operating income                                   194.3      183.8      5.7%
            due to A$ strengthening
       –    Share of net profit from associates: relates to SURF 2 & 3 co-investment                                Corporate costs                                        (17.5)     (13.8)    26.8%
            stakes                                                                                                  Fair value of investment properties                    354.2      (87.9)      nm

•    Net interest expense:                                                                                          Fair value of derivatives                              (65.9)     51.4        nm
       –    FY21 includes swap termination costs of $9.1m; excluding the swap                                       Unrealised foreign exchange gain                        35.3      (8.1)       nm
            termination cost the net interest expense is $32.5m
                                                                                                                    Share of net profit from associates (SURF
       –    Average net debt drawn increased due to acquisitions                                                                                                            5.6         -         nm
       –    Weighted average cost of debt (excluding swap termination cost) in FY21
                                                                                                                    Funds)
            was around 3.1% vs FY20: 3.5% due to lower BBSW, repayment of the                                       Transaction costs                                       (0.8)     (1.5)     (46.7%)
            A$MTN $225.0m 3.75% and debt restructuring. Cost of debt at 30 June 2021                                EBIT                                                   505.2      123.9     307.7%
            is approximately 2.4%
                                                                                                                    Net interest expense                                   (41.6)     (37.9)     9.8%
                                                                                                                    Tax expense                                             (0.7)     (0.5)     40.0%
                                                                                                                    Net profit after tax                                   462.9      85.5      441.4%

                                                                                                                                                                 slide 9

1.   For the purpose of this ratio, gross property income excludes straight lining and amortisation of incentives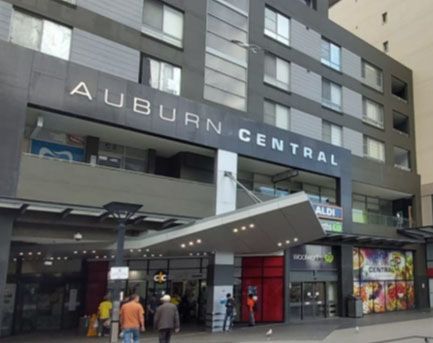
FUNDS FROM OPERATIONS                                                                                                                        30 June      30 June   % Change
                                                                                      $m
                                                                                                                                              2021         2020
For the year ended 30 June 2021                                                       Net profit after tax (statutory)                        462.9         85.5     441.4%

•   Funds From Operations (“FFO”) of $159.0m is up by $18.2m or 12.9% compared        Adjustment for non cash items
    to last year, primarily due to:
        – Net property income increase of $10.1m, plus reversal of $4.5m increase     Reverse: Straight lining & amortisation                     12.6      8.1      55.6%
           in straight-lining and amortisation (non-cash)                             Reverse: Fair value adjustments
        – Corporate costs increase of ($3.7m)
        – Interest expense reduced by $5.4m                                           - Investment properties                                (354.2)        87.9    (503.0%)
        – Other items of $1.9m                                                        - Derivatives                                            65.9        (51.4)   (228.2%)
•   Adjusted FFO (“AFFO”) of $135.8m is up by $11.5m or 9.3% compared to last         - Foreign exchange                                      (35.3)        8.1     (535.8%)
    year:
      –   AFFO is up by less than FFO due to increased maintenance capex due to       Other adjustments
          portfolio age and size while lease incentives have also increased due to
          increased portfolio size and timing of new lease opening dates              - Other items                                                1.5     (0.5)    (400.0%)
                                                                                      - Net unrealised (profit)/loss from SURF funds              (4.3)     1.6     (368.8%)
•   Weighted average units on issue increased primarily due to the full year impact   - Swap termination costs                                    9.1        -         nm
    of equity raisings in April 2020 and May 2020
                                                                                      - Transaction costs                                         0.8       1.5      (46.7%)
•   Distribution of 12.40 cpu represents 98.5% of AFFO                                FFO                                                     159.0        140.8     12.9%
       –   Estimated tax deferred component increased to 37% which is higher than        Number of units (weighted average)(m)               1,077.3       960.9     12.1%
           our expected normalised level of 20-25% due to the timing of deductions       FFO per unit (cents) ("EPU")                         14.76        14.65      0.8%
           associated with the ECL allowance and swap termination costs
                                                                                         Distribution ($m)                                    133.8        123.5      8.3%
                                                                                         Distribution per unit (cents) ("DPU")                12.40        12.50     (0.8%)
                                                                                         Payout ratio (%)                                     84%          85%       (1.0%)
                                                                                         Estimated tax deferred ratio (%)                     37%          11%        26%
                                                                                      Less: Maintenance capex                                 (9.7)        (6.0)     61.7%
                                                                                      Less: Leasing costs and fitout incentives               (13.5)       (10.5)    28.6%
                                                                                      AFFO                                                    135.8        124.3      9.3%
                                                                                      AFFO per unit (cents)                                   12.61       12.94      (2.6%)
                                                                                      Distribution / AFFO (%)                                 98.5%       99.4%      (0.9%)

                                                                                                                                       slide 10
BALANCE SHEET
At 30 June 2021
$m 30 June 2021 30 June 2020 % Change
• Prior year cash included term deposits of $180.0m being the excess proceeds Cash 11.6 183.8 (93.7%)
from the equity raisings in April and May 2020 (this excess cash was used to
repay the maturing A$MTN $225.0m in October 2020) Investment properties 4,000.0 3,138.2 27.5%
• Value of investment properties increased from $3,138.2m to $4,000.0m due to: Investment in CQR 25.8 22.7 13.7%
– Acquisitions of $452.4m;
– Like-for-like valuation increase of $409.4m being fair value increase of Other assets 171.5 245.0 (30.0%)
$354.2 million plus transaction costs of $25.9 million, net capital
expenditure and straight lining net of amortisation of $11.4 million and Total assets 4,208.9 3,589.7 17.2%
development spend of $17.9 million. The valuation increase is due to Debt 1,331.5 1,083.6 22.9%
weighted average capitalisation rates tightening by 61bps to 5.90% (FY20:
6.51%), valuation NOI increasing by 1.3%, and removal of $27.4m of Distribution payable 72.4 53.6 35.1%
COVID allowances
Other liabilities 80.2 78.5 2.2%
• Investment in CQR of 6.8m units held at its closing price on 30 June 2021 of Total liabilities 1,484.1 1,215.7 22.1%
$3.80 per unit. There was no change in the number of CQR units held during the
year Net tangible assets (NTA) 2,724.8 2,374.0 14.8%
Number of units (period-end)(m) 1,080.0 1,071.4 0.8%
• Other assets include derivative financial instruments with a mark-to-market
(MTM) valuation of $107.9m, SURF 3 co-investment of $10.1m, receivables of NTA per unit ($) 2.52 2.22 13.5%
$35.1m and other assets of $18.4m
Corporate costs 17.5 13.8 26.8%
• Net debt has increased due to acquisitions during the year External funds under management
• Units on issue has increased by 8.6m units due to: distribution reinvestment - SURF 2 & 3 assets under management 51.6 104.8 (50.8%)
plans issuing 3.4m units at $2.40 per unit in January 2021, 4.3m units at $2.22
per unit in August 2020 and 0.9m issued to employees under remuneration plans - Less: SURF 2 & 3 co-investment (10.1) (15.9) (36.5%)
Assets under management 4,250.4 3,678.6 15.5%
• NTA per unit increased by 13.5% to $2.52, mostly due to the increase in like-for-
like investment property valuations MER1 (%) 0.41% 0.38% 0.03%
1. MER stands for “Management Expense Ratio” and is calculated as FY21 Corporate Costs divided by
• MER has increased due to higher corporate costs, due mainly to increases in Assets Under Management (including SURF assets). Bps stands for basis points.
D&O insurance premiums and no KMP STIP in FY20
slide 11DEBT AND CAPITAL MANAGEMENT
At 30 June 2021
30 June 2021 30 June 2020
• Gearing of 31.3% is within the target range of 30% to 40%. Our preference is Facility limit ($’m) 1,582.1 1,457.1
for gearing to remain below 35% at this point in the cycle. The increase in
gearing from June 2020 is due to the acquisitions during the year Drawn debt (net of cash) ($’m) 1,280.5 823.3
Gearing (%) 31.3 25.6
• Key movements in drawn debt (net of cash) during the year:
– Total facility limit increased by $125.0m to $1,582.1m which included % debt fixed or hedged 50.8 91.1
increasing the bank and syndicated facilities by $300.0m and included Cost of debt (%) 2.4 3.5
benefitting from pricing at lower margins and additional overall facility
maturity, adding $50.0m of new 10 and 15 year A$MTNs, less Average debt maturity (yrs) 5.3 5.1
repayment of A$225.0m MTN in October 2020 Average fixed / hedged debt maturity (yrs) 3.0 3.8
– Drawn net debt increased due to acquisitions during the year. At 30
June 2021, cash and undrawn facilities were $290.6m Interest cover ratio 5.5x 4.5x
Net debt / FFO before interest cost 6.7x 4.6x
• The next debt expiries are in FY23 ($200.0m bank facility in November 2022)
and in FY24 ($25.0m bank facility in December 2023, a $50.0m bank facility
in June 2024, and the $225.0m A$ MTN in June 2024) Debt Facilities Expiry Profile ($m)
Bank debt undrawn
• Cost of debt reduced to 2.4% at 30 June 2021 (from 3.5% at 30 June 2020) 450 235.0
Bank debt drawn
due mainly to the repayment of the $225.0m A$MTN which had a coupon of 400
MTN
3.75%, swap and debt restructuring and lower BBSW. Average debt maturity 350
225.0 USPP
has increased to 5.3 years from 5.1 years but average fixed maturity has 300
decreased to 3.0 years from 3.8 years due to termination of $300.0m 5 year 250
(average) interest rate swaps and replacement with $375.0m 2 year 55.0 200.0
200
(average) interest rate swaps 150 190.0
145.0 106.5 103.3
100 92.1
• We are well within debt covenant limits of less than 50% gearing and interest 65.8
50 75.0 39.4 30.0 20.0
cover ratio (ICR) greater than 2.0x
0
FY22 FY23 FY24 FY26 FY27 FY28 FY29 FY30 FY31 FY32 FY34 FY36
slide 123
OPERATIONAL PERFORMANCE
Anthony Mellowes
Chief Executive Officer
slide 13PORTFOLIO OVERVIEW
Weighting towards food, health and retail services (non-discretionary)
At 30 June 2021 Number of Number of GLA Site Area Occupancy Value WALE Weighted average
centres specialties (sqm) (sqm) (% GLA) ($m) (yrs) cap rate (%)
Neighbourhood 80 1,459 508,464 1,730,858 97.5% 2,989.8 7.1 5.77%
Sub-regional 11 552 226,211 608,366 97.1% 955.1 7.2 6.35%
Freestanding 1 - 9,719 11,990 100.0% 55.1 14.3 5.50%
92 2,011 744,394 2,351,214 97.4% 4,000.0 7.2 5.90%
Tenants by Category (by gross rent)1, 3 Specialty / Mini-Major Tenants (by gross rent)1,2 Geographic Diversification (by value)
Other Retail
TAS
10%
10% VIC
Petrol
2% 17%
Woolworths 3 SA
26% 5%
Discount Variety
5% Fresh Food/Food
Catering/Liquor
Apparel 33%
8%
WA
Specialties 12%
52%
Big W QLD
5% 24%
NT
1%
Coles
Pharmacy &
12%
Health Care
21%
Wesfarmers 4
Other Majors 5
3% Services
2% NSW
21%
31%
1. Annualised gross rent excluding vacancy and percentage rent
2. Mini Majors represent 12% of annualised specialty gross rent. Mini major tenants have been split across the relevant categories
3. Woolworths now excludes Endeavour Drinks (1.5% of gross rent)
4. Wesfarmers includes Kmart 2.3%, Bunnings 0.5% and Officeworks 0.2% slide 14
5. Other majors includes Aldi, Dan Murphys, Farmer Jacks and Grand CinemasPORTFOLIO OCCUPANCY
Specialty vacancy is stable despite COVID-19 challenges
Portfolio Occupancy (% of GLA)1
• Continued strategic focus on remixing toward non-discretionary categories
and reducing long term vacancies where deals are accretive
98.4% 98.4% 98.2% 98.2% 97.4%
• Total portfolio occupancy has declined from 98.2% of GLA in FY20 to 97.4%
of GLA in FY21
– The Gateway Target (1,500 sqm) closed in April 2021 (a replacement
is underway)
– Specialty vacancy is stable at 5.1% (5.1% at June 2020)
• Specialty tenant holdover on total portfolio is 1.3% (increased from 1.1% at
June 2020)
– Strategy to prefer holdovers to negative rent reversions on renewals at
present June 2017 June 2018 June 2019 June 2020 June 2021
• Anchor tenant expiries in FY22: Overall Lease Expiry (% of Gross Rent)
– Ballarat Big W in October 2021: five year extension agreed following
option exercise, two five year options remaining 27.8%
– Shoreline Woolworths in October 2021: five year extension agreed
following option exercise, one five year option remaining
– Burnie Plaza Coles in June 2022: five year extension agreed following
option exercise, two five year options remaining
• Continued active management of lease expiry profile. Approximately 10% of 11.5%
leases expiring per annum is consistent with c.50% of income from specialty 10.3% 9.9% 9.5%
8.1% 8.6%
tenants with 5-year leases 6.6%
4.4%
3.3%
FY22 FY23 FY24 FY25 FY26 FY27 FY28 FY29 FY30 FY31
and
beyond
1. Marketown East and Marketown West have not been included in the vacancy and occupancy calculations as these centres were acquired on 30 June 2021
slide 15SALES GROWTH AND TURNOVER RENT
Strong sales growth continuing
• Supermarket portfolio MAT1 growth has increased by 3.2% (June 2020: 5.1%) Comparable Store MAT1 Sales Growth by Category (%)
– Panic buying in the last quarter of FY20 not repeated in the last quarter of
FY21 Year ending Year ending
– Continuation of working from home, border closures and restricted travel Total Portfolio
30 June 2021 30 June 2020
has seen shopping behaviour remain local as people continue to eat and
entertain at home in the COVID-19 environment Supermarkets 3.2% 5.1%
• Discount Department Store (DDS) portfolio MAT sales growth increased by 9.2% DDS 9.2% 7.6%
(June 2020: 7.6%)
– Continued demand for home and living products as people stay at home Mini Majors 6.4% 2.9%
and work from home during the COVID-19 pandemic
Specialties 9.7% (1.1)%
• Mini Majors portfolio MAT growth strengthened to 6.4% (June 2020: 2.9%)
– Discount variety, pharmacies and sporting goods saw increased growth Total 4.6% 4.2%
due to more time spent at home
• Specialty portfolio MAT sales increased to 9.7% (June 2020: (1.1%)) Turnover Rent ($m)
– Lockdowns in the last quarter of FY20 no repeated in the last quarter of
FY21
0.4
– Non-discretionary categories MAT growth was 10.9%, continuing to
outperform discretionary categories 4.3% over the year
– Sub regional centres specialty MAT growth of 13.5% outperformed
Neighbourhood centres 7.8% as trading restrictions were lifted allowing
non-discretionary retailers to trade 5.2
• Turnover rent continues to increase: 3.1
2.3
– 42 anchor tenants paying turnover rent at 30 June 2021 1.2 1.3 1.4
(38 supermarkets, 2 Kmart’s and 2 Dan Murphy’s) – represents 34% of
portfolio anchors paying turnover rent (Dec 2020: 35%) 15 Anchors 17 Anchors 20 Anchors 34 Anchors 39 Anchors 42 Anchors
– Another 15 anchors (12 Supermarkets and 3 Discount Department Stores) FY16 FY17 FY18 FY19 FY20 FY21
are within 10% of their turnover thresholds
– 9 anchor tenant turnover rents captured in a base rent review during the Turnover Rent ($m) Captured in Base Rent Review
year
slide 16
1. Moving annual turnover growth measures the growth in sales over the last 12 months compared to the previous 12 month periodSPECIALTY KEY METRICS
Rebound in second half
• Strong second half leasing performance with positive renewal spreads (2H Specialty Tenant Metrics
+1.6% vs 1H -4.6%) and improved new lease spreads (2H +3.0% vs 1H +0.8%)
– In addition to the above, we executed 75 COVID lease extensions Total Portfolio 30 June 2021 30 June 2020
(average extension period of 13.5 months)
Comparable sales MAT Growth (%)1 9.7% (1.1%)
• Strong sales growth and reducing occupancy costs will position for future rental
Average speciality occupancy cost (%)1 8.6% 10.0%
growth:
– Sales productivity increased to $9,954 psm (June 2020: $8,229 psm) Average speciality gross rent per square metre $793 $778
– Average rent/sqm has increased 1.9% to $793 (June 2020: $778) Speciality sales productivity ($ per sqm)1 $9,954 $8,229
– Occupancy cost decreased to 8.6% (June 2020: 10.0%)
• Our strategy is focused on: Renewals 30 June 2021 30 June 2020
– Taking a considered position on tenants holding over while targeting positive
renewal spreads and maintaining a high retention rate on renewals at 73% Number 198 232
(June 2020: 76%) Retention (%) 73% 76%
– Reducing specialty vacancy with a focus on reducing long term vacancies: GLA (sqm) 24,864 31,817
127 new deals done (June 2020: 146) with positive rental uplifts and lower
incentives Average uplift (%) (1.5%) (1.1%)
– Continuing to remix toward non-discretionary categories Incentive (months) 0.2 0.5
• Continuing to achieve 3%-5% annual fixed increases for 88% of specialty tenants.
New Leases 30 June 2021 30 June 2020
Number 127 146
Specialty Lease Composition (at 30 June 2021) GLA (sqm) 13,844 18,656
Annual Increase Mechanism Tenant Type Average uplift (%) 1.9% (7.7%)
Incentive (months) 10.8 13.8
Other 2%
CPI Total Lease Deals 30 June 2021 30 June 2020
10%
Number 325 378
Local
41% GLA (sqm) 38,708 50,472
National / Average uplift (%) (0.4%) (4.6%)
Regional
Fixed 59%
88%
slide 17
1. Sales growth, occupancy cost and sales productivity metrics only include sales reporting tenants trading over 24 monthsSUSTAINABILITY
We are targeting our efforts in six key areas where we can have maximum impact1
slide
1. See our FY21 Sustainability Report for more information. slide 18OUR PATHWAY TO NET ZERO BY 20301
slide
1. Scope 1 and 2 carbon emissions only. See our FY21 Sustainability Report for more information. slide 194
GROWTH OPPORTUNITIES
Anthony Mellowes
Chief Executive Officer
slide 20TRACK RECORD OF ACQUISITIONS
On average we have acquired 6 properties for $238m each financial year
Acquisitions by financial year ($m) 1
677.92
452.4
274.9
233.1 $238m average annual acquisitions
135.8 145.3
117.8
78.4
26.3
FY13 FY14 FY15 FY16 FY17 FY18 FY19 FY20 FY21
7 Properties 6 Properties 8 Properties 6 Properties 8 Properties 2 Properties 12 Properties 1 Properties 7 Properties
slide 21
1. Excludes transactions costs
2. Includes VCX acquisition of 10 properties for $573.0mFY21 ACQUISITIONS
Nine contracted, seven completed during the financial year
Bakewell SC & Petrol Station (Bakewell, NT)
Auburn Central (Auburn, NSW) • Shopping centre acquisition completed in Sep 20
• Acquisition completed in Dec 20 for $129.5m (6.0% for $33.0m (7.2% implied fully let yield)
implied fully let yield) • % of income from Anchor: 58%
• % of income from Anchors: 24% • Overall WALE (by income): 7.2 years
• Overall WALE (by income): 6.6 years • Occupancy at acquisition: 96%
• Occupancy at acquisition: 95% • Bakewell Petrol Station acquired in Dec 20, for
• Built in 2004 and redeveloped in 2020 $6.4m (6.1% implied fully let yield) and a 15 year
WALE (EG Fuelco)
• Both built in 2016
Cooloola Cove (Cooloola, QLD) Katoomba Marketplace (Katoomba, NSW)
• Acquisition completed in Feb 21 for $18.6m (5.7% • Acquisition completed in Feb 21 for $55.1m (5.6%
implied fully let yield) implied fully let yield)
• % of income from Anchors: 51% • % of income from Anchors: 100%
• Overall WALE (by income): 6.9 years • Overall WALE (by income): 14.9 years
• Occupancy at acquisition: 98% • Occupancy at acquisition: 100%
• Built in 2009 • Built in 2014
Mt Isa (Mt Isa, QLD) Marketown East & West (Newcastle, NSW)
• Acquisition completed in Apr 21 for $44.2m (7.5% • Acquisition completed in Jun 21 for $150.5m (East
implied fully let yield) $82.0m at 6.1% yield; West $68.5m at 5.8% yield)
• % of income from Anchors: 71% • % of income from Anchors: 41%
• Overall WALE (by income): 8.6 years • Overall WALE (by income): 5.5 years
• Occupancy at acquisition: 97% • Occupancy at acquisition: 95%
• Built in 1975; latest refurbishment in 2014 • Built: East in 2011; West in 1978 (refurbishments since)
OTHER ACQUISITIONS: In December 2020 we exercised our option to purchase 10 hectares of development land adjacent to our existing Greenbank shopping centre (QLD)
for $10.0m. In April 2021 we acquired Warnbro Fuel, adjacent to our existing Warnbro shopping centre (WA) for $5.1m at an implied yield of 5.7%:
SUBSQUENT ACQUISITIONS: In July 2021 we settled the purchase of Raymond Terrace (NSW) for $87.5m (excluding transaction costs), an implied fully let yield of 5.9%
and we settled the purchase of Drayton Central (QLD) for $34.3m (excluding transaction costs), an implied fully let yield of 5.5%. In July 2021 we also acquired a vacant lot
adjacent to our Marian Town Centre (QLD) for $0.8m. slide
slide 22CONVENIENCE BASED CENTRES
Fragmented ownership provides continuing acquisition opportunities Indicative
Ownership of Convenience Based Centres
CONVENIENCE BASED CENTRE LANDSCAPE (number of centres)
• There are approximately 1,200 Coles and Woolworths anchored ISPT VCX
CQR
neighbourhood and sub regional centres in Australia
• SCP is the largest owner (by number) of neighbourhood and sub regional
SCP
centres in Australia. SCP has an opportunity to continue to consolidate this
fragmented segment by utilising its management capability, industry Syndicates,
Funds & Other
knowledge and funding ability to source and execute acquisition Institutions
opportunities from private and corporate owners
• Since listing SCP has completed the acquisition of 57 neighbourhood, sub
regional and freestanding centres for over $2.1b and has divested 34
freestanding and neighbourhood centres for over $500m
Private
RECENT MARKET TRANSACTIONS
• During the financial year to 30 June 2021:
– 49 neighbourhood centres changed hands for total consideration of
~$2.6b
– 11 sub regional centres changed hands for total consideration of
~$1.1b FY21 Buyers FY21 Sellers
• Increased institutional demand over the period, with evidence of cap rate (by value) (by value)
Syndicates
tightening in convenience-based centres Syndicates
& Funds,
• SCP acquired 5 neighbourhood centres and 1 sub regional centre over the & Funds
26%
25%
year, making up approximately 10% by value of total known neighbourhood
and sub regional transactions over the period Other
Institutions Other
40% Institutions ,
ACQUISITION OUTLOOK 52%
• We will continue to take a disciplined approach to acquisitions:
– After allowing for acquisition of Drayton, Raymond Terrace, and the Private
DRP, we could debt fund another $190m of acquisitions and still keep Investors,
Private
our gearing within our preferred range of below 35% 22%
SCP Investors
– Demand for quality neighbourhood assets remains strong 10% 25%
slide 23
Source: Management estimatesINDICATIVE DEVELOPMENT PIPELINE
Over $170m of development opportunities identified at more than 30 of our centres
over the next 5 years 1
Estimated Capital Investment (A$m)
DEVELOPMENT TYPE CENTRE(S) FY21 Actual FY22 FY23 FY24 FY25 FY26
Greenbank, Warner, North Orange, Wyndham Vale, Epping
North, Belmont, New Town Plaza, Whitsunday SC, White Box
Centre expansions Rise, Collingwood Park, Currambine, Bushland Beach, Marian, 1.1 10.7 17.7 24.9 34.0 40.9
Tamworth, Jimboomba, Kirkwood, Central Highlands, Raymond
Terrace.
Soda Factory, Belmont, West End Plaza, Griffin Plaza, Meadow
Mews, Warnbro, Sturt Mall, Sugarworld, Shoreline, The
Centre improvements2 Gateway, Riverside, Whitsunday SC, Warnbro, Mudgeeraba,
12.7 19.6 4.0 TBD TBD TBD
Bentons Square, Kwinana
Solar, building automation, LED lights and air-conditioning R22
Sustainability gas replacements
4.1 21.2 TBD TBD TBD TBD
Preliminary & Defensive Various - 0.3 0.3 0.3 0.3 0.3
Total 17.9 51.8 22.0 25.2 34.3 41.2
Major projects in FY22: Soda Factory and Solar panel rollout. Projects must meet our return hurdles.
1. The exact timing of future developments, expansions and improvements are subject to prevailing market conditions and regulatory approvals
2. In addition to the Soda Factory Development majority of the remaining amount is made up of contributions to major’s refurbishments and co-investments
slide 24FUNDS MANAGEMENT
Successful conclusion of SURF 1 (achieved IRR of 11%) and SURF 2 (achieved IRR
of 12%)
• First fund “SURF 1” was launched in October 2015, and successfully sold the five
properties, with the final return made in October 2020 (consistent with 5-year term set
out in the PDS)
– Achieved an IRR of 11%, with a performance fee to SCP of $0.5m
• Second fund “SURF 2” launched in June 2017 with two properties, successfully sold its
final property in February 2021, with the final return made in May 2021;
– Achieved an IRR of 12%, with a performance fee to SCP of $0.7m
Moama Marketplace, NSW (SURF 3)
• “SURF 3” launched in July 2018 and now has three properties (previously four
properties)
– Swansea Woolworths was sold in July 2020 for $15.6m (in line with 31 Dec 2019
book value). The proceeds were used to repay a portion of the secured debt
facility and strengthened the balance sheet of SURF 3
– AUM at 30 June 2021 of $51.6m
• Fee structure for all funds is the same1
– Establishment Fee: 1.5% of total asset value
– Management Fees: 0.7% of total asset value per annum
– Disposal Fee: 1.0% of assets disposed
– Performance Fee: if the equity IRR exceeds 10.0%, SCP will receive 20.0% of the Warrnambool Target, VIC (SURF 3) Woodford Woolworths, QLD (SURF 3)
outperformance
• We will explore additional funds management opportunities in FY22
slide 25
1. SCA may defer fees, or rebate a portion of its fees to wholesale clients, at its discretion5
KEY PRIORITIES AND OUTLOOK
Anthony Mellowes and Mark Fleming
Chief Executive Officer and Chief Financial Officer
slide 26CORE STRATEGY UNCHANGED
Defensive, resilient cashflows to support secure and growing long term distributions to
our unitholders
WEIGHTED TO
FOCUS ON CONVENIENCE- LONG LEASES TO
NON-DISCRETIONARY
BASED RETAIL CENTRES QUALITY ANCHOR TENANTS
RETAIL SEGMENTS
APPROPRIATE GROWTH
CAPITAL STRUCTURE OPPORTUNITIES
slide 27ONLINE RETAIL IMPLICATIONS
Convenience based centres are becoming last mile logistics hubs
• Our centres are located within local communities, well suited for last mile logistics
• We believe the store-based fulfilment model will remain the predominant model
for online grocery fulfilment in Australia due to relatively low population densities,
large distances, established existing supply chains and high temperatures
• Woolworths and Coles are using our centres for last mile fulfilment, both pick up
and home delivery
– 70 supermarkets in our portfolio (or 75% of stores) now have dedicated
click ‘n collect bays
– 2 supermarkets have drive-through for online pick up, with a further
14 planned for FY22
– Many of our stores are also being used as logistics hubs for home
deliveries to the local area
• Online sales are included in supermarket turnover rent calculations
– Of our 93 Coles & Woolworths stores, three include only 50% of online
Lilydale, VIC
sales
• Specialty tenants are increasingly using their stores in our centres to fulfil online
orders in the local area
Kingston, TAS
slide 28IMPACT OF COVID-19 ON FY22
The impact of current lockdowns on FY22 earnings is unknown at this time
• All specialty tenant categories finished the Category % of Gross Rental Income Sales Growth (%)
financial year with positive sales growth
May 2021 June 2021 June
Total (month- (month- 2021
Impact
• The impact of the current lockdowns across a NSW and VIC Portfolio on-month) on-month) (MAT)
from
number of States on our FY22 results is
COVID-19 Apparel 2% 3% 97.6% 4.2% 11.4%
unknown
– We expect Apparel, Services and
Services 4% 10% 82.4% 8.6% 9.3%
Cafes/Restaurants to be most
impacted by current lockdowns
Cafes / Restaurants 1% 3% 49.3% 21.9% 4.2%
– These categories in NSW and VIC
represent 7% of our gross rental Takeaway Food 4% 7% 16.6% 9.3% 12.2%
income (or approximately $2.0m per
month) Fresh Food & Liquor 3% 6% (8.5%) (3.9%) 5.6%
– In NSW and VIC the regulations
mandating rent relief and a moratorium Pharmacy / Medical 4% 10% 34.6% 6.6% 10.6%
on evictions has been reinstated until
January 2022 Other Specialty 4% 7% 9.8% 1.3% 13.4%
Total Specialty
• Anchor tenants are cycling strong sales (excluding Mini- 22% 46% 16.7% 3.6% 9.7%
growth in the last quarter of FY20 (panic Majors)
buying, stay-at-home)
Mini-Majors 3% 6% (3.1%) 1.0% 6.4%
Discount Department
3% 8% (16.5%) (4.1%) 9.2%
Stores
Supermarkets 18% 40% (1.8%) (1.2%) 3.2%
Total Portfolio 46% 100% (0.2%) (0.5%) 4.6%
slide 29LONGER TERM AFFO GROWTH TARGET
Indicative target growth rate for AFFO in the medium-longer term is 2% to 4% pa
Indicative Contribution
to AFFO Growth Rate (% pa)
Description and Assumptions – medium to longer term –
Anchor Rents • Anchors represent 48% of rental income. 34% of anchors in turnover rent and expected to grow at 2-4% 0 - 1%
Comp Growth
pa, increasingly driven by online sales growth
Specialty Rents • Specialties represent 52% of rental income. Annual step-ups of 3-5% pa 1 - 2%
Expenses • Assumed to grow at the same rate as rental income 0%
Indicative Comparable NOI Growth (%) 1 - 3%
Property Development • Selective extensions and refurbishments of our existing centres
Growth Initiatives
Acquisitions • Selective acquisitions in the fragmented convenience based shopping centre segment
1% +
Other • SURF funds winding down
Indicative FFO Growth (%) 2 - 4% +
Maintenance • Constant % of asset value
Capex
0%
Leasing • Constant % of asset value
Indicative AFFO Growth (%) 2 - 4% +
slide 30KEY PRIORITIES AND OUTLOOK
“Love local, Shop local, Act local”
• Our focus continues to be:
– Serving our local communities for their everyday needs
– Partnering with our supermarket anchors to improve their online offer
OPTIMISING THE – Actively managing our centres to ensure that we have successful specialty tenants paying appropriate rents
CORE BUSINESS – Executing on our sustainability initiatives
• This will support our strategy of generating defensive, resilient cash flows to support secure and growing long
term distributions to our unitholders
• Continue to explore value-accretive acquisition opportunities consistent with our strategy and investment criteria
GROWTH
• Progress our identified development pipeline, including sustainability investments
OPPORTUNITIES
• Consider further funds management opportunities
• We will continue to actively manage our balance sheet to maintain diversified funding sources with long weighted
CAPITAL average debt expiry and a low cost of capital consistent with our risk profile
MANAGEMENT
• Gearing to remain below 35% at this point in the cycle
• Due to the continued uncertainty created by the COVID-19 pandemic, we will not provide FY22 guidance at this
time. We will continue to target a Distribution payout ratio of approximately 100% of AFFO.
EARNINGS GUIDANCE
• Our target is to return AFFO per unit to the pre-COVID level of 7.5cpu per half (or 15.0cpu per annum) once the
impacts of the COVID-19 pandemic have ended
slide 316
QUESTIONS
slide 327
APPENDICES
slide 33PORTFOLIO DETAIL
Portfolio construction provides high degree of income predictability
Overall Lease Expiry (% of Gross Rent)
• Overall, a 7.2 year portfolio WALE combined with investment grade tenants and
non-discretionary retail categories provides a higher degree of income predictability 27.8%
• 325 specialty renewals and new leases completed in the 12 months to 30 June
2021 with majority on a 5 year lease term and fixed annual increases
– In addition to the above, we executed 75 COVID lease extensions 11.5%
(average extension period of 13.5 months) 10.3% 9.9% 9.5%
8.1% 8.6%
6.6%
4.4%
3.3%
Portfolio Lease Expiry Profile
FY22 FY23 FY24 FY25 FY26 FY27 FY28 FY29 FY30 FY31
WALE Years and
beyond
30 June 2021 By GLA By Gross Rent
Portfolio WALE 7.2 6.2
Specialty Lease Expiry (% of Specialty Gross Rent)
Anchor WALE 9.3 9.6
21.7%
18.3%
15.6%
12.4% 11.5%
7.6%
6.0%
3.7%
2.3%
0.9%
FY22 FY23 FY24 FY25 FY26 FY27 FY28 FY29 FY30 FY31
and
slide 34 beyond
slide 34ANCHOR TENANTS
48% of gross rent generated by anchor tenants
30 June 30 June 30 June 30 June 30 June
2017 2018 2019 2020 2021
• All centres are anchored by either Woolworths Limited or
Woolworths Limited
Coles Group Limited retailers
Woolworths 54 54 58 58 63
Big W 7 7 9 9 11
• 48% of gross rent is generated by anchor tenants
Total Woolworths Limited 61 61 67 67 74
(Woolworths Limited 31%, Coles 12%, Wesfarmers 3% and
Other majors 2% on a fully leased basis), with an Anchor
Coles Group Limited
WALE of 9.6 years (by gross rent)
Coles Group Limited - - 28 28 30
Total Coles Group Limited - - 28 28 30
• Woolworths has announced the separation and demerger of
Endeavour Group. There are 5 Dan Murphy’s and 25 BWS
Wesfarmers Limited
stores in the portfolio accounting for 1.5% of total gross rent
Coles 18 20 - - -
Target 2 2 2 2 -
• FY21 acquisitions included the following anchors: Kmart 2 2 4 4 6
– Auburn Central (NSW) - 3,650 sqm Woolworths store and Bunnings 1 1 1 1 1
1,787 sqm Aldi store
– Bakewell (NT) - 4,854 sqm Woolworths store Officeworks - - - - 1
– Cooloola Cove (QLD) - 3,140 sqm Woolworths store Total Wesfarmers Limited 23 25 7 7 8
– Katoomba Marketplace (NSW) - 4,000 sqm Woolworths
store and 5,719 sqm Big W store
– Mt Isa Village (QLD) - 2,420 sqm Coles store and 5,459 Other Anchor Tenants
sqm Kmart store Aldi 1 1 1 2 3
– Marketown East (NSW) - 3,931 sqm Woolworths Dan Murphy’s 2 2 4 4 5
store, 6,567 sqm Big W store and 1,179 sqm Dan Murphys
store Farmer Jacks - - 1 1 1
– Marketown West (NSW) - 3,048 sqm Coles store and Grand Cinemas - - 1 1 1
2,203 sqm Officeworks Total Other Anchor Tenants 3 3 7 8 10
Total Anchor Tenants 87 89 109 110 122
slide 35DEBT FACILITIES & INTEREST RATE HEDGING Facility Limit Drawn Debt Financing capacity Maturity / Notes
$m (A$m) (A$m) (A$m)
Bank and Syndicated Facilities
Bank bilateral 200.0 145.0 55.0FY23: $200m Nov 2022
Bank bilateral 75.0 75.0 -FY24: $25m Dec 2023 and $50m Jun 2024
Bank bilateral 100.0 100.0 -FY26: $100m Mar 2026
Syndicated 100.0 100.0 -FY26: $100m Jun 2026
Bank bilateral (including Bank Guarantee) 425.0 190.0 235.0 FY27: $425m Jul 2026
900.0 610.0 290.0
Medium Term Notes (fixed rate A$MTN)
Medium Term Note 4 225.0 225.0 - Jun 2024; Coupon of 3.90%
Medium Term Note 4 30.0 30.0 - Sep 2030; Coupon of 3.25%
Medium Term Note 4 20.0 20.0 - Sep 2035; Coupon of 3.50%
DEBT FACILITIES 275.0 275.0 -
(INCLUDING FIXED RATE DEBT) US Private Placement
At 30 June 2021 US$ denominated2 106.5 106.5 - Aug 2027
US$ denominated3 39.4 39.4 - Sep 2028
US$ denominated2 53.3 53.3 - Aug 2029
A$ denominated 50.0 50.0 - Aug 2029
US$ denominated3 92.1 92.1 - Sep 2031
US$ denominated3 65.8 65.8 - Sep 2033
407.1 407.1 -
Total unsecured financing facilities 1,582.1 1,292.1 290.0
Cash - 11.6 11.6
Net debt5 1,582.1 1,280.5 301.6
Less: Debt facilities used for bank
guarantees1 (11.0) Jul 2026; facility used for bank guarantees (refer note 1)
Total debt facilities available plus cash 290.6 Net financing capacity of $290.6m
In addition to the fixed rate A$ MTN noted above, the Group has the following interest rate swaps in place where the Group pays fixed rates and receives floating rates;
Notional Face
OTHER HEDGES Hedging Value (A$m) Fixed Rate Expiry
Interest Rate Swap 25.0 0.20% Nov 2022
At 30 June 2021 Interest Rate Swap 0.20% Jul 2023
350.0
Total 375.0
1. Bank guarantees of $11.0m are for the Group’s compliance with its Australian Financial Services Licences
2. USPP 2014 denominated repayment obligations have been fully hedged at A$ / US$ rate of 0.9387
3. USPP 2018 denominated repayment obligations have been fully hedged at A$ / US$ rate of 0.7604 slide 36
4. The Group currently has three separate A$MTN on issue
5. Drawn debt (net of cash) of $1,280.5m is made up of: statutory debt of $1,331.5m less $42.9m being the revaluation of the USPP US$ denominated debt from
statutory value of $400.0m (using the prevailing June 2021 spot exchange rate) to restate the USPP to its hedged value of A$357.1m plus unamortised debt fees
and MTN discount of $3.5m less $11.6m cashACQUISITIONS DURING THE YEAR
30 JUNE 2021
Specialty Total Total Purchase Implied
Acquisition Anchor GLA Occupancy
Centre Type GLA GLA Price Fully Let
Date (sqm) (% GLA)
(sqm) (sqm) ($m) Yield
Acquired Properties
Bakewell Shopping Centre Neighbourhood Sep 2020 4,854 1,553 6,407 96% 33.0 7.22%
Bakewell Petrol Station Dec 2020 n/a n/a n/a 100% 6.4 6.11%
Auburn Central Neighbourhood Dec 2020 5,437 8,090 13,527 95% 129.5 6.03%
Katoomba Marketplace Freestanding Feb 2021 9,719 - 9,719 100% 55.1 5.58%
Cooloola Cove Neighbourhood Feb 2021 3,140 1,160 4,300 98% 18.6 5.70%
Warnbro Fuel Apr 2021 n/a n/a n/a 100% 5.1 5.69%
Mt Isa Neighbourhood Apr 2021 7,879 1,806 9,685 97% 44.2 7.52%
Marketown East Sub Regional Jun 2021 11,677 5,127 16,804 95% 82.0 6.13%
Marketown West Neighbourhood Jun 2021 3,048 6,524 9,572 96% 68.5 5.82%
45,754 24,260 70,014 97% 442.4 6.18%
Greenbank Development Dec 2020 10.0
45,754 24,260 70,014 97% 452.4 6.18%
SUBSQUENT ACQUISITIONS: In July 2021 we settled the purchase of Raymond Terrace (NSW) for $87.5m (excluding transaction costs), an implied fully let yield of 5.9%
and we settled the purchase of Drayton Central (QLD) for $34.3m (excluding transaction costs), an implied fully let yield of 5.5%. In July 2021 we also acquired a vacant lot
adjacent to our Marian Town Centre (QLD) for $0.8m. slide 37PORTFOLIO LIST (I)
Completion Total GLA Occupancy Number of WALE Valuation Valuation
Property State Property Type Anchor Tenant(s) Date (sqm) (% by GLA) Specialties (Years by GLA) Cap Rate June 2021 ($m)
Lavington Square NSW Sub-Regional WOW; Big W 2005 20,222 96.2% 58 3.2 6.25% 73.0
Marketown East NSW Sub-Regional WOW, Dan Murphys, Big W 2011 16,804 94.7% 32 8.1 5.75% 82.0
Sturt Mall NSW Sub-Regional Coles; Kmart 2011 15,233 97.6% 49 2.3 6.25% 73.2
West End Plaza NSW Sub-Regional Coles; Kmart 2009 15,875 98.2% 44 4.8 6.00% 78.7
Lilydale VIC Sub-Regional WOW; Big W; Aldi 2013 21,754 99.7% 59 9.4 6.00% 115.4
Pakenham VIC Sub-Regional WOW; Big W 2011 16,925 98.8% 44 5.5 6.00% 95.0
Central Highlands QLD Sub-Regional WOW; Big W 2012 18,049 98.9% 34 8.8 7.00% 65.5
Mt Gambier SA Sub-Regional WOW; Big W; Bunnings 2012 27,723 96.6% 37 10.1 6.25% 74.1
Murray Bridge SA Sub-Regional WOW; Big W 2011 18,771 95.1% 56 5.1 7.00% 62.3
Kwinana Marketplace WA Sub-Regional Coles; WOW; Big W; Dan Murphy's 2012 32,952 95.4% 76 9.4 6.75% 137.3
Warnbro WA Sub-Regional Coles; WOW; Big W 2014 21,903 96.0% 63 8.1 6.69% 98.6
Auburn NSW Neighbourhood WOW; Aldi 2004 13,527 94.7% 57 5.7 6.00% 129.5
Belmont Central NSW Neighbourhood WOW 2008 7,868 89.5% 22 8.2 6.50% 30.0
Berala NSW Neighbourhood WOW 2012 4,013 100.0% 6 10.6 4.75% 33.3
Cabarita NSW Neighbourhood WOW 2013 3,426 99.9% 11 9.9 5.50% 24.3
Cardiff NSW Neighbourhood WOW 2010 5,395 98.9% 14 11.2 5.50% 29.5
Clemton Park NSW Neighbourhood Coles 2017 7,017 96.3% 22 10.4 5.00% 63.1
Goonellabah NSW Neighbourhood WOW 2012 5,116 98.0% 10 9.4 6.00% 21.2
Greystanes NSW Neighbourhood WOW 2014 6,004 100.0% 29 9.9 5.25% 71.3
Griffin Plaza NSW Neighbourhood Coles 1997 7,191 94.7% 30 3.8 6.00% 31.2
Lane Cove NSW Neighbourhood WOW 2009 6,720 100.0% 13 10.1 5.25% 60.0
Leura NSW Neighbourhood WOW 2011 2,545 100.0% 6 10.7 5.00% 21.3
Lismore NSW Neighbourhood WOW 2015 6,836 95.0% 23 10.0 6.50% 32.7
Macksville NSW Neighbourhood WOW 2010 3,446 98.8% 5 12.2 5.25% 17.7
Marketown West NSW Neighbourhood Coles, Officeworks 1978 9,572 96.0% 29 6.7 5.25% 68.5
Merimbula NSW Neighbourhood WOW 2010 5,009 100.0% 10 10.1 5.50% 23.0
Morisset NSW Neighbourhood WOW 2010 4,137 100.0% 8 6.1 6.00% 21.3
Muswellbrook Fair NSW Neighbourhood Coles 2015 9,006 98.9% 22 4.5 6.00% 34.9
North Orange NSW Neighbourhood WOW 2011 4,844 100.0% 14 11.3 5.25% 44.7
Northgate NSW Neighbourhood Coles 2014 4,126 100.0% 13 2.9 6.00% 19.4
Shell Cove NSW Neighbourhood WOW 2018 5,043 98.4% 13 14.5 5.00% 50.0
Ulladulla NSW Neighbourhood WOW 2012 5,279 97.9% 10 11.9 5.25% 30.0
West Dubbo NSW Neighbourhood WOW 2010 4,205 100.0% 10 9.2 5.75% 20.5
Ballarat VIC Neighbourhood Dan Murphy's; Big W 2000 8,963 100.0% 4 4.2 6.25% 20.6
Bentons Square VIC Neighbourhood WOW; Dan Murphy's 2009 9,992 99.5% 44 5.9 5.25% 101.5
Drouin VIC Neighbourhood WOW 2008 3,779 99.9% 5 7.0 5.00% 20.1
Epping North VIC Neighbourhood WOW 2011 5,259 100.0% 16 10.2 5.00% 34.5
Highett VIC Neighbourhood WOW 2013 5,476 100.0% 14 11.1 5.00% 32.9
Langwarrin VIC Neighbourhood WOW 2004 5,094 100.0% 16 3.4 5.25% 27.4
Ocean Grove VIC Neighbourhood WOW 2004 6,899 97.7% 21 3.4 5.75% 39.9
The Gateway VIC Neighbourhood Coles: Target 2012 10,844 84.3% 41 3.7 6.25% 59.5
Warrnambool East VIC Neighbourhood WOW 2011 4,319 99.2% 7 6.5 5.50% 18.2
White Box Rise VIC Neighbourhood WOW 2011 4,952 93.9% 14 slide
10.4 5.75% 25.4
Wonthaggi VIC Neighbourhood Coles; Kmart 2012 11,831 99.4% 21 5.4 5.50% 54.9
Wyndham Vale VIC Neighbourhood WOW 2009 6,650 100.0% 10 8.0 5.25% 24.5PORTFOLIO LIST (II)
Completion Total GLA Occupancy Number of WALE Valuation Valuation
Property State Property Type Anchor Tenant(s) Date (sqm) (% by GLA) Specialties (Years by GLA) Cap Rate June 2021 ($m)
Annandale Central QLD Neighbourhood Coles 2007 6,655 96.5% 20 5.6 6.75% 26.6
Ayr QLD Neighbourhood Coles 2000 5,455 94.3% 8 4.3 6.25% 23.5
Brookwater Village QLD Neighbourhood WOW 2013 6,755 100.0% 11 7.9 5.50% 40.7
Bushland Beach QLD Neighbourhood Coles 2018 4,567 95.3% 9 9.6 6.50% 23.5
Carrara QLD Neighbourhood WOW 2011 3,717 100.0% 6 6.6 5.25% 20.7
Chancellor Park Marketplace QLD Neighbourhood WOW 2001 5,859 98.8% 18 11.4 5.50% 49.8
Collingwood Park QLD Neighbourhood WOW 2009 4,567 99.7% 10 11.1 5.25% 15.3
Cooloola Cove QLD Neighbourhood WOW 2009 4,300 97.9% 10 7.4 5.75% 18.6
Coorparoo QLD Neighbourhood WOW 2012 5,588 98.1% 15 10.2 5.00% 42.7
Gladstone QLD Neighbourhood WOW 2012 5,215 100.0% 13 8.6 6.25% 27.0
Greenbank QLD Neighbourhood WOW 2008 5,692 100.0% 17 6.3 5.50% 36.5
Jimboomba Junction QLD Neighbourhood Coles 2008 5,928 95.6% 21 3.1 5.75% 31.5
Lillybrook Shopping Village QLD Neighbourhood Coles 2004 6,995 98.5% 21 5.4 5.75% 29.8
Mackay QLD Neighbourhood WOW 2012 4,167 100.0% 9 9.9 6.00% 28.6
Marian Town Centre QLD Neighbourhood WOW 2014 6,705 95.2% 19 8.1 6.50% 34.4
Marketplace Warner QLD Neighbourhood WOW; Aldi 2001 11,470 97.5% 44 8.6 5.50% 82.5
Miami One QLD Neighbourhood Coles 2007 4,676 97.1% 35 3.6 6.00% 31.8
Mission Beach QLD Neighbourhood WOW 2008 3,904 97.8% 9 5.9 6.50% 12.5
Mt Isa Village QLD Neighbourhood Coles; Kmart 1975 9,685 96.8% 21 8.2 7.50% 44.2
Mt Warren Park QLD Neighbourhood Coles 2005 3,843 100.0% 11 6.9 5.50% 21.3
Mudgeeraba Market QLD Neighbourhood WOW 2008 6,143 97.0% 39 5.7 5.50% 40.2
North Shore Village QLD Neighbourhood Coles 2003 4,071 100.0% 14 5.6 5.00% 34.0
Oxenford QLD Neighbourhood WOW 2001 5,815 100.0% 18 8.4 5.50% 41.4
Sugarworld Shopping Centre QLD Neighbourhood Coles 2015 4,759 93.2% 12 9.9 6.00% 28.3
Soda Factory QLD Neighbourhood Coles 2002 5,416 81.0% 22 8.0 6.50% 34.0
Whitsunday QLD Neighbourhood Coles 1986 7,637 90.8% 36 3.9 7.00% 36.0
Worongary Town Centre QLD Neighbourhood Coles 2004 6,899 98.9% 43 3.0 5.50% 52.0
Blakes Crossing SA Neighbourhood WOW 2011 5,078 100.0% 13 5.7 6.00% 24.5
Walkerville SA Neighbourhood WOW 2013 5,263 100.0% 12 10.3 5.50% 29.3
Busselton WA Neighbourhood WOW 2012 5,432 97.0% 5 11.5 5.75% 27.9
WOW; Dan Murphy's; Farmer Jacks;
Currambine Central WA Neighbourhood 2016 17,032 96.6% 42 5.9 6.75% 96.2
Grand Cinemas
Kalamunda Central WA Neighbourhood Coles 2002 8,352 97.9% 39 3.4 5.75% 48.0
Stirlings Central WA Neighbourhood WOW 2013 8,428 85.5% 35 6.9 6.50% 42.9
Treendale WA Neighbourhood WOW 2012 7,319 98.3% 19 4.4 5.75% 34.7
Burnie TAS Neighbourhood Coles; Kmart 2006 8,431 100.0% 10 6.0 6.75% 25.6
Claremont Plaza TAS Neighbourhood WOW 2014 8,044 100.0% 26 7.2 6.00% 45.8
Glenorchy Central TAS Neighbourhood WOW 2007 7,090 100.0% 14 3.6 6.00% 30.5
Greenpoint TAS Neighbourhood WOW 2007 5,830 100.0% 11 1.4 6.25% 21.2
Kingston TAS Neighbourhood Coles 2008 4,958 98.6% 16 5.6 6.06% 32.8
Meadow Mews TAS Neighbourhood Coles 2003 7,670 96.3% 31 4.0 6.00% 70.1
New Town Plaza TAS Neighbourhood Coles; Kmart 2002 11,389 100.0% 14 7.3 5.75% 49.7
Prospect Vale TAS Neighbourhood WOW 1996 6,048 95.7% 19 10.0 6.25% 32.3
Riverside TAS Neighbourhood WOW 1986 3,107 100.0% 7 8.3 5.00% 13.5
Shoreline TAS Neighbourhood WOW 2001 6,277 100.0% 16 4.7 5.75% 44.7
Sorell TAS Neighbourhood Coles 2010 5,450 100.0% 14 slide 7.2 5.75% 34.0
Bakewell NT Neighbourhood WOW 2016 6,407 96.5% 15 7.8 6.67% 41.9
Katoomba Marketplace NSW Freestanding WOW; Big W 2014 9,719 100.0% 0 14.3 5.50% 55.1
TOTAL OWNED PORFOTLIO 744,394 97.4% 2,011 7.2 5.90% 4,000.0PORTFOLIO LIST (III)
Occupancy Number of WALE Valuation Valuation June
Property State Property Type Anchor Tenant(s) Completion Date Total GLA (sqm) (% by GLA) Specialties (Years by GLA) Cap Rate 2021 ($m)
Properties Under Management - SURF 1
All assets have been sold and this fund was wound up in October 2020
Properties Under Management - SURF 2
All assets have been sold and this fund was wound up in May 2021
Properties Under Management - SURF 3
Moama Marketplace NSW Neighbourhood WOW 2007 4,505 99.9% 8 11.6 5.00% 22.0
Warrnambool Target VIC Neighbourhood Target 1990 6,983 98.3% 11 3.1 9.00% 12.3
Woodford QLD Neighbourhood WOW 2010 3,672 100.0% 5 5.6 5.50% 15.9
TOTAL MANAGED PORTFOLIO 15,160 99.2% 24 6.3 6.14% 50.2
slide 40CONTACT DETAILS AND DISCLAIMER
For further information please contact:
Anthony Mellowes Mark Fleming
Chief Executive Officer Chief Financial Officer
T: +61 2 8243 4900 T: +61 2 8243 4900
E: anthony.mellowes@scaproperty.com.au E: mark.fleming@scaproperty.com.au
Disclaimer
This presentation has been prepared by Shopping Centres Australasia Property Group RE Limited (ABN 47 158 809 851) (SCPRE) as responsible entity of Shopping Centres
Australasia Property Management Trust (ARSN 160 612 626) (SCA Management Trust) and responsible entity of Shopping Centres Australasia Property Retail Trust (ARSN 160 612
788) (SCA Management Trust) (together, SCA Property Group or the Group). This presentation should be read in conjunction with the Financial Report published on the same date.
Information contained in this presentation is current as at the date of release. This presentation is provided for information purposes only and has been prepared without taking account
of any particular reader's financial situation, objectives or needs. Nothing contained in this presentation constitutes investment, legal, tax or other advice. Accordingly, readers should,
before acting on any information in this presentation, consider its appropriateness, having regard to their objectives, financial situation and needs, and seek the assistance of their
financial or other licensed professional adviser before making any investment decision.
This presentation does not constitute an offer, invitation, solicitation or recommendation with respect to the subscription for, purchase or sale of any security, nor does it form the basis
of any contract or commitment. Except as required by law, no representation or warranty, express or implied, is made as to the fairness, accuracy or completeness of the information,
opinions and conclusions, or as to the reasonableness of any assumption, contained in this presentation.
The forward looking statements included in this presentation involve subjective judgment and analysis and are subject to significant uncertainties, risks and contingencies, many of
which are outside the control of, and are unknown to, the Group. In particular, they speak only as of the date of these materials, they assume the success of the Group’s business
strategies, and they are subject to significant regulatory, business, competitive and economic uncertainties and risks. Actual future events may vary materially from forward looking
statements and the assumptions on which those statements are based. Given these uncertainties, readers are cautioned not to place undue reliance on such forward looking
statements. Past performance is not a reliable indicator of future performance.
By reading this presentation and to the extent permitted by law, the reader releases each entity in the Group and its affiliates, and any of their respective directors, officers, employees,
representatives or advisers from any liability (including, without limitation, in respect of direct, indirect or consequential loss or damage or loss or damage arising by negligence) arising
in relation to any reader relying on anything contained in or omitted from this presentation.
The Group, or persons associated with it, may have an interest in the securities mentioned in this presentation, and may earn fees as a result of transactions described in this
slide
presentation or transactions in securities in SCP. All values are expressed in Australian dollars unless otherwise indicated. All references to “units” are to a stapled SCP security
comprising one unit in the SCA Retail Trust and one unit in the SCA Management Trust.You can also read