Galway City County Galway - Data led housing needs as sessment using detailed population
←
→
Page content transcription
If your browser does not render page correctly, please read the page content below
Data led housing needs assessment using detailed population
projection methodologies and relevant supply side considerations to
establish future housing demand.

                                                                H o u s i n g n e e ds
                                                                a s s e s s men t
      Galway City
      County Galway

PREPARED BY

February 2019
Galway City – Future Growth, Housing Profile and Assessment of Future Needs
Table of Contents
1.0 Introduction ....................................................................................................................................... 1
2.0 Population Growth in Galway City .................................................................................................... 2
2.1 Recent Population Growth ................................................................................................................ 2
2.2 Projected Population Growth ............................................................................................................ 3
3.0 Profile of Households in Galway City................................................................................................. 5
3.1 Households and Household Sizes ...................................................................................................... 5
3.2 Compositional Changes ..................................................................................................................... 6
3.3 Changes In Tenure ............................................................................................................................. 6
3.4 Apartments Over Houses .................................................................................................................. 8
4.0 Minimum Housing Requirement for Galway City.............................................................................. 9
4.1 Approach ........................................................................................................................................... 9
4.2 Findings .............................................................................................................................................. 9
5.0 Residential Development in Galway City......................................................................................... 12
5.1 Pipeline of Planning Activity ............................................................................................................ 12
5.2 Identified Delivery Concerns ........................................................................................................... 14
6.0 Housing Affordability ....................................................................................................................... 15
6.1 Approach ......................................................................................................................................... 15
6.2 Key Indicators .................................................................................................................................. 16
6.3 Findings ............................................................................................................................................ 18
7.0 Summary and Concluding Remarks ................................................................................................. 21
Appendix I .................................................................................................................................................... 22Galway City – Future Growth, Housing Profile and Assessment of Future Needs
1.0 INTRODUCTION
Future Analytics Consulting Ltd. (FAC) has prepared this assessment of Galway City’s current housing profile,
pipeline and future needs.
FAC is an urban planning consultancy that advocates an evidence-based approach to holistic planning and
sustainable development and has contributed to the preparation of county strategies, regional plans and
national outlooks involving data-led modelling of housing demands, socio-economic impact and
demographic change.
As the 4th largest city in the country and the fastest growing city over the past 50 years, Galway plays a
significant strategic role not just for the West, but also for the entire Northern and Western Regional
Assembly (NWRA)1.
Galway City’s locational attraction and economic advantages give it a major part to play in the future
development of Ireland’s economy. Galway City benefits from having a unique demographic, economic and
environmental profile which have each played a key part in its growth to date but are also key drivers of the
challenges it now faces for the future.
To protect that position, an undersupply of housing which limits the attractiveness of the City as a place in
which to live, as a base for industry and employment and in terms of its role supporting Ireland’s economic
engine, must be avoided.
This report has evaluated the City’s future growth potential, its housing profile and future requirements and
the following key findings have resulted:
a) Galway City is set to grow significantly over the period to 2026 and beyond.
b) Galway City has an upward trend towards 1- and 2-person households.
c) Galway City is increasingly moving towards a renter dominated market (on an equal footing to owners).
d) Galway City has a strong preference towards apartment-living (twice the national rate).
e) Galway City’s provision of housing needs to be significantly increased to keep pace with demographics.
f) Galway City will need approx. ~800 units per annum and over 8,000 units by 2026.
g) Galway City’s person-household composition is changing. By 2026, 60% will be 1-& 2-person households.
h) Galway City’s planning and development pipeline has more than two-third of grants yet to commence and
these are at risk of expiry by 2020 if not started.
i) Galway City’s pipeline will not be sufficient for the identified level of housing demand.
j) Galway City only saw 500 units completed between 2014 and 2018.
1Comprising Counties Donegal, Sligo and Leitrim to the North-West, Counties Galway, Mayo and Roscommon to the West, and
Counties Cavan and Monaghan mid-way along the Border with Northern Ireland (National Planning Framework 2018).
1Galway City – Future Growth, Housing Profile and Assessment of Future Needs
2.0 POPULATION GROWTH IN GALWAY CITY
2.1 RECENT POPULATION GROWTH
Population growth in Galway City in the 25 years to 2016 has been substantial; increasing by 54.7% to 78,668
people (Table 1)2. As the country’s 4th largest city, growth would be expected, but the level of growth
contrasts with the overall level of change nationally, which increased by a comparatively lower 35.1%.3
These rates demonstrate the inherent growth dynamic at play within Galway City and its role as a strategic
driver for the Western economy. With significant pressure being placed on the Dublin housing market since
the 1990s, cities like Galway have been perceived as an affordable and accessible alternative to living in
Dublin and indeed offer a myriad draws and opportunities unique to their location and social footprint.
Table 1: Population Growth in Galway City 1991-2016 as compared to the State
1991 1996 2002 2006 2011 2016
Ch '91 - '16
(Census) (Census) (Census) (Census) (Census) (Census)
State 3,525,719 3,626,087 3,917,203 4,239,848 4,588,252 4,761,865 -
State Change - 100,368 291,116 322,645 348,404 173,613 1,236,146
State Change (%) - 2.8% 8.0% 8.2% 8.2% 3.8% 35.1%
Galway City 50,853 57,241 65,832 72,414 75,529 78,668 -
Galway City Change - 6,388 8,591 6,582 3,115 3,139 27,815
Galway City Change (%) - 12.6% 15.0% 10.0% 4.3% 4.2% 54.7%
Galway City experienced most of its growth between 1996 and 2006, stabilising thereafter and maintaining
a rate slightly higher than the state average (Figure 2.1).
Figure 2.1: Population Growth in Galway City 1991-2016 as compared to the State
2 CSO de facto population, various years, includes all people present on census night vs. only resident population.
3 Ibid.
2Galway City – Future Growth, Housing Profile and Assessment of Future Needs
2.2 PROJECTED POPULATION GROWTH
Galway has been Ireland’s most rapidly developing urban area for the past 50 years4 and through the National
Planning Framework (NPF), the NWRA has set out ambitious growth targets in its draft Regional Spatial and
Economic Strategy (RSES) which seek to reinforce the spatial and economic relevance of the City for the
region. Though the targets represent an intended goal for future growth, they have been influenced by policy
driven spatial allocation and assumption. The reality of growth, particularly its distribution and volume are
ostensibly more dynamic and reflective to both economic and societal factors over planning objectives.
Therefore, in order to provide contrast to these targets, FAC has put forward a robust and credible evidence-
led projection of population in this document which is not influenced by such policy measures. Rather the
component influences driving natural population growth and particularly inter-regional migration have been
considered. In other words, a demographically-led projection of population indicating the likely growth
pattern for Galway City over the next twelve years to 2031.
FAC uses the demographic cohort component method or CCM as it is known in practice by the Central
Statistics Offices (CSO) and other international agencies for the production of population projections. CCM
provides a flexible and powerful approach to population projection by developing an array of comparative
scenarios, each tailored around the application of qualified assumptions in mortality, fertility and migration.
For the purposes of this research we have considered migratory alignment with the CSO’s own assumptions.
A scenario entitled ‘M1F1-aRAdj’ has been utilised herein5.
• Using CCM, the population of Galway City is projected to reach approximately 90,660 people in the
ten years to 2026; a 15.3% increase on 2016. In contrast, the NPF draft NWRA-RSES is targeted a
population of 97,870 people or a 24.4% increase.
• By 2031, the City will grow further under CCM to 95,160 people, a 21% increase on 2016, whereas
under the NPF basis the City will grow to over 106,670 people, or a 35.6% increase. These growth
rates are compared alongside the state in Table 2 and Figure 2.2 overleaf.
The level of growth being set out under the NPF targets assumes a significant volume of inter-regional net
migration benefiting Galway and the West, largely from the Eastern and Midlands Regional Assembly (EMRA).
This is a very clear policy-driven assumption by Government in underpinning the NPF and how both the
NWRA and the SRA (Southern Regional Assembly) will both grow on a 50:50 ratio with the EMRA6. However,
this would require a reversal to the pattern of growth within the EMRA exhibited over the last 100 years, and
the neither the NPF nor the draft NWRA RSES outlines how this might be achieved immediately in order to
reach the 2026 target. To that end, FAC’s use of the CCM projection offers a more robust and credible
foundation for modelling anticipated population growth into the region and the City. In assessing the recent
pattern of inter-regional migration, particularly towards the west (which has exhibited a net outflow in recent
years) FAC believe the NPF assumptions are comparatively optimistic and may exaggerate the achievable
level of growth over the short term to 2026 especially.
Therefore, between 12,000 (CCM) and 19,200 (NPF) additional people are set to call Galway City home by
2026. Accommodating this increase in population will present certain challenges for the City’s existing
infrastructure, not least of which the provision of housing. Chapter 4 will examine the impact of the CCM
projection in terms of housing requirements, particularly on foot of compositional changes in person
household size.
4
Draft Northern and Western Regional Assembly (NWRA) Regional Spatial & Economic Strategy (RSES)
5 Comprised of a ‘Migration Option 1, Fertility Option 1’ informed by recent sub-regional migration data as of 2018.
6
NPF Implementation Roadmap, 2018, DoHP&LG
3Table 2: Population Growth in Galway City and State 1991-2016 and Projected Population to 2031 (CCM and NPF)
1991 1996 2002 2006 2011 2016 2021 2026 2031
(Census) (Census) (Census) (Census) (Census) (Census) (Projected) (Projected) (Projected)
State 3,525,719 3,626,087 3,917,203 4,239,848 4,588,252 4,761,865 5,023,041 5,305,720 5,589,114
State Change (#) 100,368 291,116 322,645 348,404 173,613 261,176 282,679 283,393
State Change (%) 2.8% 8.0% 8.2% 8.2% 3.8% 5.5% 5.6% 5.3%
Galway City Actual 50,853 57,241 65,832 72,414 75,529 78,668
Galway City Change (#) 6,388 8,591 6,582 3,115 3,139
Galway City Change (%) 12.6% 15.0% 10.0% 4.3% 4.2%
Galway City CCM 78,668 85,314 90,667 95,162
Change CCM-Actual (#) 3,139 6,646 5,353 4,495
Change CCM-Actual (%) 8.4% 6.3% 5.0%
Galway City NPF 78,668 88,268 97,868 106,668
Change NPF-Actual(#) 3,139 9,600 9,600 8,800
Change NPF-Actual (%) 12.2% 10.9% 9.0%
Figure 2.2: Population Growth in Galway City and State 1991-2016 and Projected Population to 2031 (CCM and NPF)
Galway City – Future Growth, Housing Profile and Assessment of Future Needs
4Galway City – Future Growth, Housing Profile and Assessment of Future Needs
3.0 PROFILE OF HOUSEHOLDS IN GALWAY CITY
3.1 HOUSEHOLDS AND HOUSEHOLD SIZES
In 2016 Galway City was home to 74,376 residents and 28,859 private households. That equates to an
average size of 2.57 persons per household, a slight increase on 2011’s 2.56 average household size
(AHS). However, this was very much in line with the national trend which also saw an increase over
the period from 2.73 to 2.75. In the past few decades AHS has been falling steadily across Ireland, as
it has in other western countries. The slight increase in 2016 is illustrative of a greater number of
people staying at home with their parents or friends instead of forming households of their own. This
is reflective of various housing supply, affordability and overall economic constraints in recent years.
In 2016, 1- and 2-person households comprise 56% of Galway City’s total households, as seen below.
Table 3: No. of People and Households in Galway City by Household Size in 2016
HH Persons HH % Persons %
1 person 7,412 7,412 25% 10%
2 persons 8,932 17,864 31% 24%
3 persons 5,642 16,926 19% 22%
4 persons 4,426 17,704 15% 23%
5+ persons 2,862 15,754 10% 21%
Total Private HHs 29,274 75,660 100% 100%
Figure 3.1: No. of Households in Galway City by Household Size in 2016
Figure 3.2: No. of People in Households in Galway City by Household Size in 2016
5Galway City – Future Growth, Housing Profile and Assessment of Future Needs
3.2 COMPOSITIONAL CHANGES
Galway City’s household composition was very different in 2002, with 1- and 2-person households
accounting for 48% of total households (instead of 56% in 2016); AHS was much higher too at 2.86.
Since then, both 1- and 2-person households have increased their share of total households by 4% in
each bracket respectively.
FAC research undertaken on behalf of the Housing Agency7 in this area has indicated that Galway City
exhibits a noted trend towards decreasing household sizes.
Table 4 summarises an assessment of inter-censal data from 2002 to 2016 which indicates that there
is an established trend towards the growth of 2-, 1- and 3-person household sizes (in that order) at
the expense of 4- and predominantly 5+ person households.
Table 4: Trended Annualised Compositional Change in Household Sizes in Galway City 2002-2016
Household Size 1p HH 2p HH 3p HH 4p HH 5p+ HH
Trended Change P.A. 0.18% 0.34% 0.14% -0.05% -0.52%
This growth has unsurprisingly placed added pressure on the capacity of Galway City’s existing stock
to support fewer and fewer people each year. Indeed, as this trend continues, the preferential choices
of current and future resident households in deciding to form smaller groups must inform the type of
future housing provision.
The natural question stemming from this identified increasing preference for 1- and 2-person
households is what type of unit should be built to meet these requirements?
In reflecting on that, one should also consider some additional factors which relate to what the most
suitable unit-type might be. Namely, the changing nature of household tenure, unit type preference
and affordability.
3.3 CHANGES IN TENURE
The nature of occupancy tends to fluctuate based largely upon social norms and economic factors
enabling households to pursue the preferred occupancy types. Since 2002 as the number of
households in Galway City rose by nearly 40%, social and private rental-occupancy has increased by
a significant 70%-76% respectively. In comparison owner-occupancy has risen by just over 12%
(Table 5).
Part of this is significant difference in growth is attributable to Galway City’s unique demographic
composition on foot of the higher education offering, however, it is also indicative of the similar
levels of growth in private rental across all of Ireland’s urban areas, especially within the cities.
7
Housing Supply Requirements in Ireland’s Urban Settlements 2014–2018, Housing Agency, 2014 (and later)
6Galway City – Future Growth, Housing Profile and Assessment of Future Needs
Table 5: Household Occupancy in Galway City 2002-2016 and period change
Galway City 2002 2006 2011 2016 Ch. '02-'16
Owned HHs 11,983 13,128 13,520 13,465 12.4%
Private Rented HHs 5,826 6,311 10,390 10,241 75.8%
Social Rented HHs 1,969 4,496 2,997 3,350 70.1%
Other HHs 1,241 1,389 790 1,771 42.7%
Total Private HHs 21,019 25,324 27,697 28,827 37.1%
Figure 3.3: Household Occupancy in Galway City 2002-2016 and period change
This continued upward trend in rental occupancy has placed Galway City far ahead of the national rate
of 30% renting, with almost equal footing now between rental and owner-occupancy in the City; each
comprising 47% of total households (including social renting). Indeed, the number of people who have
entered the private rental sector in Galway City since 2002 almost matches the total level of growth
in the City (Table 6).
Table 6: Household Occupancy in Galway City 2002-2016 and period change
Persons Households Total
Galway City Total HH HH% PP %
Renting Renting Population
2002 15,834 5,826 60,112 21,019 28% 26%
2006 17,033 6,311 67,572 25,324 25% 25%
2011 26,466 10,390 70,805 27,697 38% 37%
2016 27,394 10,241 74,275 28,827 36% 37%
This indicates that the overarching change towards renting is not just a symptom of Galway’s
university influence but is reflective of the same trends playing out at national level where people are
continuing to rent much longer into their lifecycles (as seen in Figure 3.4’s dark blue).
7Galway City – Future Growth, Housing Profile and Assessment of Future Needs
Age
% %
Figure 3.4: Tenure status by age of householder in 2016 at State level (Source: Central Statistics Office, 2018)
The distribution of Galway City’s private renters is such that renters aged between 30 to 44 comprise
almost half of all private renting households (48%). This illustrates a very mature segment of the
total population is opting to rent instead of buy, and this naturally shapes the type of unit options
this cohort occupy and will continue to seek (Table 7).
Table 7: Age Composition of Private Renting Households in Galway City in 2016 (age of head of household)
65
House Under 25 - 29 30 - 34 35 - 39 40 - 44 45 - 49 50 - 54 55 - 59 60 - 64
years
-holds 25 years years years years years years years years
plus
10241 1,996 1,916 2,204 1,750 945 570 361 223 128 148
100% 19% 19% 22% 17% 9% 6% 4% 2% 1% 1%
3.4 APARTMENTS OVER HOUSES
An increasing number of households in 2016 are renting and correspondingly renting in apartments.
Indeed, the proportion of people living in apartments is increasing year on year with nearly 24% of
people in Galway City now considered apartment dwellers (Table 8). This is almost double what it is
nationally (12% of households) and nearly a 7% increase on 2002’s rate of 17%. Part of that is due to
the composition of stock built in the last 20 years, greater affordability and individual preference.
Table 8: Type of Dwelling by Households in Galway City in 2016
Type of accommodation Households Persons HH %
House/Bungalow 21,341 58,676 73.9%
Flat/Apartment 6,824 13,968 23.6%
Bed-sit 65 91 0.2%
Caravan/Mobile Home 32 101 0.1%
Not stated 597 1,540 2.1%
Total 28,859 74,376 100%
8Galway City – Future Growth, Housing Profile and Assessment of Future Needs
4.0 MINIMUM HOUSING REQUIREMENT FOR GALWAY CITY
4.1 APPROACH
The interplay between demographic
change and future housing
requirements consist of many individual
factors such as the drivers of population
change, settlement patterns, migratory
flows, changing household composition
and the supply of housing.
FAC has developed a statistical model to project a settlement’s future minimum housing requirements
(MHR) as a product of evaluating the impact of its changing demographics, stock characteristics and
trends in household composition. The model has been validated previously be the Department of
Housing, Planning and Local Government as part of FAC’s research on behalf of the Housing Agency.
This model provides a mechanism through which anticipated gaps in the provision of sufficient housing
stock to cater to the increasing needs of a growing population can be highlighted. It has been used to
ascertain what challenges face Galway City’s development should it grow in accordance with the CCM
population projection.
As the population changes, the utilisation of existing stock also changes – in line with increases and
decreases in person-household size. In this research Galway City’s future population is distributed
proportionally in line with its characteristic profile (its projected occupancy pattern), and the resulting
quantum of homes required can be determined against existing stock.
As the population increases, there will be a significant impact on the utilisation of existing housing
stock and this will give rise, in many places, to a deficit, should supply lag behind. A key component of
the Minimum Requirements Model is the application of the CCM population projections which are
used to assess how each Galway City will undergo shifts in its age profile and how people coming into
the City, as well as leaving it, will impact on its rate of change and household formation.
4.2 FINDINGS
Galway City’s population growth, and specifically its trended changes in household composition, will
result in a minimum requirement to deliver at least 8,160 residential units by 2026; or an average of
816 units per annum. Similarly, if supply is not forthcoming, at least 11,927 residential units will be
required by 2031.
This is a considerable requirement, equivalent to an approximate 24.3% increase on the existing
housing stock of 33,522 (excluding Holiday homes) identified in the 2016 census. The annual and
cumulative minimum housing requirement for the years 2017–2031 are detailed in Table 9 overleaf.
If the NPF draft NWRA-RSES targets had of been assessed, this requirement would have been much
higher than is shown.
9Galway City – Future Growth, Housing Profile and Assessment of Future Needs
It’s important to note that this minimum requirement forecasts the ‘internally generated’ demand
for housing within Galway City but does not evaluate requirements based on certain external drivers,
like proximity to Limerick, Cork or Dublin, house price, type or supply, or a preference to live in Galway.
Each of these can impact/augment this requirement and a further assessment should be undertaken.
Table 9: Identified Minimum Housing Requirements (Units) in Galway City to 2026 and 2031
MHR 2017 MHR 2018 MHR 2019 MHR 2020 MHR 2021 MHR 2022 MHR 2023 MHR 2024 MHR
Cumulative -965 -1,735 -2,523 -3,324 -4,138 -4,953 -5,764 -6,569
Annualised -965 -770 -788 -801 -814 -815 -811 -805
MHR ctd. 2025 MHR 2026 MHR 2027 MHR 2028 MHR 2029 MHR 2030 MHR 2031 MHR
Cumulative -7,367 -8,160 -8,947 -9,719 -10,475 -11,211 -11,927
Annualised -798 -794 -787 -772 -756 -736 -716
The MHR methodology assumes that the housing requirement for each year has been met. Therefore,
when the requirement for a given year is not met (i.e. supply falls short), it must be delivered in a
subsequent year.
Added to this, the methodology does not account for any pent-up housing requirement that exists in
the settlement prior to 2017 – i.e. housing requirement that has not been met in the years up to 2017.
In this case of Galway City, the pent-up or unmet requirements are considerable. Newly released data
from the CSO indicates that only 500 units were completed in Galway City in the years from 2014 up
to 20188. This is far below even the annualised minimum requirements in Table 9, above.
Furthermore, unlike the application of average household size to new population, MHR evaluates
growth year on year with respect to the changing composition of households. This allows for specific
pressures in key person-household sizes to be identified.
Table 10 and Figures 4.1 and 4.2 below look at the relative change in the projected number of future
households by 2026 as well as their disaggregation by person-household size (recall, as informed by
Galway City’s own inter-censal trends 2002-2016).
Table 10: Projected Changes in the no. of Households per Person-Household Size by 2026
2016 HH 2026 HH CH '16-'26 CH '16-'26
All private households (HHs) 28,859 37,746 8,887 30.8%
1-person HHs 7,354 10,508 3,154 42.9%
2-person HHs 8,823 12,208 3,385 38.4%
3-person HHs 5,554 7,132 1,578 28.4%
4-person HHs 4,346 5,139 793 18.2%
5plus-person HHs 2,782 2,758 -24 -0.9%
8
New Dwelling Completions 2018 Q4, CSO, 2019
10Galway City – Future Growth, Housing Profile and Assessment of Future Needs
Figure 4.1: Projected Changes (absolute) in the no. of Households per Person-Household Size by 2026
Figure 4.2: Projected Change (percentage) in the no. of Households per Person-Household Size by 2026
These finding indicate that there will be a significant increase in the number of 1- and 2-person
households by 2026, and that after current stock (post-obsolescence) and even current pipeline is
factored in, a future deficit in the sufficient provision of residential units will exist.
It should be noted that the estimation of minimum housing requirements does not account for
extraneous demand factors, such as a specific preference to live in Galway City over other areas. As
MHR factors in a projection of population (which incorporates assumptions on migration), preference
is not directly handled (migration is a consequence of many factors which are assessed in proxy by
examining the migration trends only). MHR is therefore not a demand-side tool, but rather a
demographic-impact and assessment tool.
Population over and above what has been projected to reside in Galway City would add to the
requirements and would likely induce further inward migration, thereby further increasing the
minimum requirement.
Such demand may be defined by factors such as personal preference/circumstances (choices,
finances, etc.) or by planning policy, such as under the NPF. Consequently, the concept of
‘requirement’ should be acknowledged as being distinctly different to housing ‘demand’ – i.e. it is a
need for housing rather than an effective or latent demand for same.
A good indicator of whether the above requirements can be met is the pipeline of current
development and planning activity. Chapter 6 examines this with a view of breaking down the
available statistics with regards to the distribution of units by type and application status.
11Galway City – Future Growth, Housing Profile and Assessment of Future Needs
5.0 RESIDENTIAL DEVELOPMENT IN GALWAY CITY
5.1 PIPELINE OF PLANNING ACTIVITY
An analysis of residential applications as of January 2019 reveals that there are currently 127
applications for schemes of 10 units or greater in Galway City’s planning and development pipeline.
This accounts for applications with decisions pending, under appeal, those granted permission and
those with construction commenced (but incomplete).
Figure 5.1 below provides a disaggregation of these applications by the number of units and their
status. There are 3,271 units in total; of which 2,428 have received granted permissions (74.2%).
Table 11: No. of units by application status (as of January 2019)
Granted Awaiting Incomplete /
Galway City: Commenced Conditional Appealed RFI Refused Withdrawn Grand Total
(not comm.) Update Invalid
# 1625 803 51 34 342 22 68 72 254 3271
% 50% 25% 2% 1% 10% 1% 2% 2% 8% 100%
Figure 5.1: No. of units by application status in Galway City’s planning and development pipeline (as of January 2019)
The distribution of this activity for granted applications (numbering 94 schemes) is not uniform
between build types, with just under 50% of applications being mixed development in nature, nearly
36% being for houses and fewer than 17% building apartments (Figure 5.2).
Table 12: No. of units granted & commenced by construction type (as of January 2019)
Galway City: Houses Apartments Mixed Dev. Grand Total
# 867 407 1154 2428
% 36% 17% 48% 100%
12Galway City – Future Growth, Housing Profile and Assessment of Future Needs
Figure 5.2: No. of units granted & commenced by construction type (as of January 2019)
Just under 25% of total units applied for have been commenced or 33% of granted permissions. Of
these 803 units, the majority are houses and mixed development builds (45% and 44% respectively),
with apartments accounting for just 83 units or less than 11% (Figure 5.3).
Table 13: No. of units commenced by construction type (as of January 2019)
Galway City: Houses Apartments Mixed Dev. Grand Total
# 366 86 351 803
% 46% 11% 44% 100%
Figure 5.3: No. of units commenced by construction (as of January 2019)
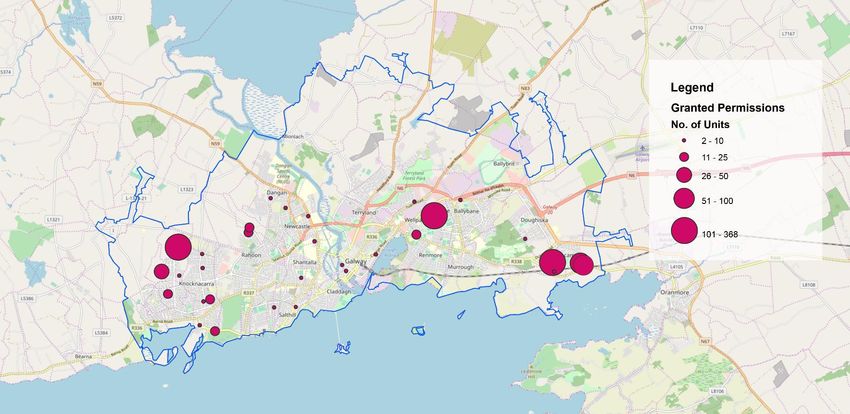
The spatial location of the development pipeline for granted residential applications is concentrated
in suburban parts of Galway City (Figure 5.4). Areas such as Knocknacarra and Ballybaan account for
the majority (>90%) of all current consents in the city. These areas offer a greater potential to
accommodate larger scale developments when compared to more central city locations, and the
pipeline indicates a readiness to develop at these locations.
13Galway City – Future Growth, Housing Profile and Assessment of Future Needs
Figure 5.4: No. of units granted by location
5.2 IDENTIFIED DELIVERY CONCERNS
It is not anticipated that all of the residential applications will be granted planning permission, nor will
each reach completion on the basis that some schemes may be speculative in nature, whilst others
may be impacted by other issues such as financing or viability.
It has been observed that approximately 67% of granted applications which have not yet commenced
will have their permissions expire by 2020. These applications account for 1,092 of the 1,625 units
granted in Galway City’s uncommenced pipeline.
Should these schemes fail to commence construction in the coming months their delivery before their
planning permission is due to expire is doubtful. This could put at risk the provision of housing in the
short term for Galway City.
14Galway City – Future Growth, Housing Profile and Assessment of Future Needs
6.0 HOUSING AFFORDABILITY
6.1 APPROACH
Affordability is an essential ingredient in any housing market, allowing households the choice between
either renting in the short, medium or long term or becoming home owners. There are a number of
factors which determine affordability a household but ultimately it is likely to be about their capacity
to afford the rent/mortgage for a property type in a location of their choice and which suits their
circumstances.
Quantifying the levels of affordability within the Galway City housing market requires an examination
of relationship between house purchase price or rental price and that of household income. This
section provides a summary assessment of both housing and rent affordability on the basis that there
exists a well-recognised set of assumptions around what affordability means and how it can be
quantified.
The key measures of affordability utilised in this study are:
1. Price to income ratio (PIR)
The traditional approach to PIR indicates a person who needs accommodation, and whose income
would be adequate to meet the payments on a mortgage for the purchase of a house to meet his or
her accommodation needs. These payments calculated over the course of a year would not exceed
35/40 per cent of that person's annual income net of income tax and pay related social insurance. If
the monthly cost of servicing a mortgage (for a given house price) is greater than this percentage
household would be deemed ineligible (i.e Annuity Method).
In parallel to the Annuity method are the Central Bank of Ireland (CBI) regulations introduced in 2015
placing additional stipulations on access to credit. Specifically, that an upper limit of 3.5 times a
household’s gross income can be applied for by an applicant against the cost of the property.
Accounting for an assumed down payment a household can typically afford to buy a property 4 times
its household income. In practice, the CBI rules are more restrictive than annuity and thus the study
uses the CBI rules as a benchmark for affordability.
2. Proportion of household income required to rent a home (RIR)
The ability to pay rent is a function of income and thus one simple measure of affordability is the ratio
of rent to gross income. However, using net income to measure affordability is a more precise
indicator of affordability (i.e. disposable income).
It is generally accepted that if housing costs exceed 40 per cent of a household’s disposable income,
the household is experiencing housing stress. That is, housing is unaffordable and housing costs
consume a disproportionately high amount of household income. Households paying close to 40 per
cent or more of their income on rent are generally seen to be in housing stress. Under those
circumstances the cost of housing is affecting a household’s ability to pay for other primary needs such
as Food, Power and water, Health services and medication, Household goods (such as cars, washing
machines, fridges, computers).
15Galway City – Future Growth, Housing Profile and Assessment of Future Needs
6.2 KEY INDICATORS
The average house price transaction in Galway was €246,223 in 2018 based on 2,438 transactions.
Prices have increased by 6.7% from €230,685 in 2010 to €246,223 in 2018. The volume in € millions of
property transactions has increased significantly since 2011, with a significant value increase in 2018.
Since 2015, the levels of price growth have been marginally greater than the national average, but the
levels of transaction activity was the 3rd highest in the country at 10,706 over the period. DAFT
reporting indicates that in Q3 2018 the average listing price of a 1-bedroom unit was €125,000 in the
city. This figure increases to €160,000 for a 2-bedroom unit, €237,000 for a 3-bedroom unit and
€384,000 for a 4-bedroom unit.
Galway Transaction Volumes (Units) Galway Transaction Volumes (Millions Euro)
3,000 2,773 2,716 €700
2,482 2,438 € 581€ 600
2,500 2,374 €600
€500 € 470€ 477
2,000
€400 € 373
1,485
1,500
1,097 €300 € 241
1,000 889 903 € 205€ 182€ 188
€200
500 €100
- €0
2010 2011 2012 2013 2014 2015 2016 2017 2018 2010 2011 2012 2013 2014 2015 2016 2017 2018
Galway National Galway % National %
350,000 20%
300,000 15%
246,223 10%
250,000 230,685
202,060 213,944
192,044 5%
200,000 171,062 162,408 157,011 169,611
0%
150,000
-5%
100,000 -10%
50,000 -15%
- -20%
2010 2011 2012 2013 2014 2015 2016 2017 2018
Figure 6.1: Level of Transaction activity for residential units and average house prices.
In Galway City, existing and market rents9 have remained very correlated since 2007 indicating
supply and demand balance has been relatively aligned and rents have risen and fallen without any
major oversupply or shortages in stock. That said, the existing average rent in Galway City (for all
home types) has increased 19% since 2015 but the average change in market rents shows a 45%
increase between 2015 and 2018 alone.
9
There are 2 primary sources for rent data in Ireland, the Private Rental Tenancies Board (PRTB) and DAFT.ie. PRTB data
is not market data and includes all existing rental agreements. For this reason, it will always be below what is advertised on
the DAFT ‘market’ rate. It is important to assess both in the context of understanding rent change.
16Galway City – Future Growth, Housing Profile and Assessment of Future Needs
The pace of growth in ‘market’ rent vs ‘existing’ rents can be seen more clearly in recent years in the
diagram below.
1,500
1,200
900
600
300
-
2007 2008 2009 2010 2011 2012 2013 2014 2015 2016 2017 2018
PRTB Daft.ie
Figure 6.2: Rent Price changes (existing and market) in Galway City since 2007.
PRTB data indicate a growth in existing lease arrangements of 9.5% since 2007. The largest increase
in price has been in two-bed unit types which have experienced an 13.7% growth since 2007.
1,200
1,000
Rent Price
800
600
400
200
-
2007 2008 2009 2010 2011 2012 2013 2014 2015 2016 2017 2018
One bed 664 653 619 584 576 566 562 591 622 674 707 755
Two bed 848 859 808 753 733 743 751 769 820 902 946 996
Three bed 989 964 871 821 822 842 835 864 903 985 1,054 1,084
All bedrooms 976 952 892 841 818 839 835 853 897 976 1,033 1,068
Figure 6.3: Rent Price changes (existing) in Galway City per unit type.
Household income estimates in Galway have been derived from the CSO Household Budget Survey
(2016). The HBS is a household survey and defines a household as a single person or group of people
who regularly reside together in the same accommodation and who share the same catering
arrangements. Household members are not necessarily related by blood or by marriage. This resource
provides a snapshot of household budgets, which have been adjusted for county-level analysis for this
study.
The HBS provides data for ten gross household income decile groups which are ten equal-sized groups
of households, each group containing 10% of households. The first decile group contains 10% of
households with the lowest gross household income; the second decile group contains 10% of
households with the next lowest gross household income etc. The tenth decile group contains 10% of
households with the highest gross household income. The annual gross income figures provided below
(Figure 6.4) are based on the upper limit of the income bands for Galway.
17Galway City – Future Growth, Housing Profile and Assessment of Future Needs
€160,000 €150,749
€140,000
€120,000
€100,000 €91,999
€80,000 €72,132
€59,152
€60,000 €48,421
€39,164
€40,000 €30,812
€23,546
€16,232
€20,000 €9,703
€0
1st Decile 2nd Decile 3rd Decile 4th Decile 5th Decile 6th Decile 7th Decile 8th Decile 9th Decile 10th Decile
Household Income, 2018
Figure 6.4: Annual Gross Incomes by Income Deciles for Galway, 2018
Monthly household disposal income figures for Galway are also derived from the HBS at a decile level.
Disposable income defined as the amount of income, after tax is deducted, that is available for
spending and saving. The monthly disposable income figures provided below (Figure 6.5) are based
on the upper limit of the income bands for Galway.
€9,256 €10,000
€9,000
€8,000
€6,151 €7,000
€5,102 €6,000
€4,333 €5,000
€3,672
€3,081 €4,000
€2,518 €3,000
€1,976
€1,375 €2,000
€839
€1,000
€0
1st Decile 2nd Decile 3rd Decile 4th Decile 5th Decile 6th Decile 7th Decile 8th Decile 9th Decile 10th Decile
Disposable Income
Figure 6.5: Monthly Disposable Household Incomes for Galway, 2018
6.3 FINDINGS
The cost to rent or buy a home in Galway City has grown over the past 6 years in line with the national
average and economic recovery post-recession. Cost growth has been considerably higher than
income growth over the same period. Despite this growth, affordability for both renters and
purchasers has not changed significantly. Privately renting as an option is largely affordable for most
income deciles, while house buying is relatively restricted to the middle- and upper decile groupings.
18Galway City – Future Growth, Housing Profile and Assessment of Future Needs
1. Price to income ratio (PIR)
The ability of a household to meet the minimum criteria from the CBI is the primary metric in
measuring purchase affordability. A high-level analysis of affordability and Galway income thresholds
suggests that, for individuals and households earning roughly the average industrial wage for a full-
time employee (€45,611), the cost to purchase at current market prices in Galway City is reasonably
affordable. 3 no. scenarios below present scenario based on current market prices:
1. A single person with average earnings of €40,000 (take-home €2,636) looking to buy a 2-bed
apartment in Galway City costing €160,000 euro would be able to meet both the CBI
regulations and the annuity monthly payments. This would be just at the maximum
affordability threshold of 4 times the household income.
2. A couple with a combined income of €65,000 (take-home €3,709) looking to buy a 3-bed
house in Galway City costing €237,000 euro would be able to meet both the CBI regulations
and the annuity monthly payments. This household would have capacity to increase
borrowing by an additional €23,000 to €260,000.
3. A couple on a combined average earnings of €100,000 (take-home €5,124) looking to buy a 3-
bed house in Galway City costing €384,000 euro would be able to meet both the CBI
regulations and the annuity monthly payments. This household would have capacity to
increase borrowing by an additional €26,000 to €400,000.
The results of the Galway City decile analysis indicate that affordability for house buying is primarily
available to households in the 5th-10th decile range in 2018. Households in the first 4 decile groups
will not be able to afford without a significant down payment or wage increase. Equally, larger unit
types (3- or 4-bedroom units) are currently only affordable for those in the upper deciles. Figure 6.6
below represents when market price exceeds the capacity of a decile to afford per unit type. In
2018, households in the 5th decile (>€39,000 annual household income) or higher would have
sufficient income to afford either a 1- or 2-bedroom unit. Overall, the relationship of PIR is positive
for the majority households that wish to purchase (depending on household preference). The value
assigned to each decile below represents 4 times total income available to a household in that decile.
4 Bed - €400,000
3 Bed - €237,000
2 Bed - €160,000
1 Bed - €125,000
Figure 6.6: Purchase Affordability by Decile and Unit Type for Galway City, 2018
19Galway City – Future Growth, Housing Profile and Assessment of Future Needs
2. Proportion of household income required to rent a home (RIR)
The ability to pay rent is a function of income and thus one simple measure of affordability is the ratio
of rent to income. A high-level analysis of affordability and Galway income thresholds suggests that,
for individuals and households earning roughly the average industrial wage for a full-time employee
(€45,611), affordability is favourable based on the current market rents in Galway City. 3 no. scenarios
below present scenario based on current market rent prices:
4. A single person on average earnings of €40,000 (take-home €2,636) paying the monthly rent
of €848 for a 1 bed apartment in Galway City would be allocating 32% of net income to the
cost of renting.
5. 3 persons on 20k each (take-home €1,523) paying a monthly rent of €381 for a 3-bed
apartment in Galway City would be allocating 25% of net income to the cost of renting. This
would be significantly under the maximum affordability threshold of 40%.
6. A couple with a combined income of €65,000 (take-home €3,709) paying the monthly rent of
€977 for a 2-bed apartment in Galway City would be allocating 26% of net income to the cost
of renting. This would be just under the maximum affordability threshold of 40%.
The results of the Galway City decile analysis indicate that households across most deciles can afford
to rent their unit preference in 2018. Figure 6.6 below represents when market rent exceeds the
capacity of a decile to afford per unit type. In 2018, households in the 4th decile (Galway City – Future Growth, Housing Profile and Assessment of Future Needs
7.0 SUMMARY AND CONCLUDING REMARKS
This housing profile and assessment of future needs has indicated that Galway City’s population is set to
continue growing significantly and may reach between 90,670 (CCM) and 97,870 (NPF) people by 2026.
Consequently, this will generate a minimum housing requirement of at least 8,160 additional housing units
(or an average of 816 units per annum). This requirement coupled with projected growth throughout the
NWRA which may bleed further into Galway City (of between 160,000 and 180,000 people total targeted)
will create significant demand for new housing in the City in the short to medium term.
The estimation of housing requirements is informed by population changes and, therefore, does not account
for demand (driven by personal preference or policy). Consequently, the requirement should be considered
as being a minimum to serve the population and its changes under the influence of recent trends. Demand
in a settlement such as Galway City would be expected to exceed the requirement on the premise that supply
is available and/or forthcoming via the development and planning pipeline.
While there are 2,428 units with granted planning permissions in the pipeline for Galway City, the likelihood
that they will be sufficient to meet the requirement and demand is in doubt, particularly as over two-thirds
of granted applications have not commenced and will expire by 2020.
Given the level of ‘pent-up’ demand not previously provided for (i.e. just 500 housing units completed
between 2014 and 2018) Galway City has, and will continue to have, a latent requirement for additional
residential development in the coming years.
Of particularly note is the trended change towards 1- and 2-person households. Both will comprise over 60%
of all households in the City by 2026, up from 56% in 2016, and the rate of inter-censal trended change places
2-person households as the leading household size.
The market has changed to support a viable and healthy rental sector in Galway, holding an equal share of
household by occupancy type. Preference is very strong towards renting now and apartment living in
particular comprises almost a quarter of all households in the City; twice the national rate.
Given that a very large proportion of Galway City residents currently privately rent, and that this trend is
likely to continue in future years, the city needs to continue to offer suitable, affordable options for private
renters to ensure supply is present to meet an increasing demand. The affordability assessment indicates
current levels of rent for 1, 2, or 3-bedroom units can be met by 71.3% households and that there is scope
for rents to increase further for those households, without decreasing the number of households meeting
affordability thresholds. Although, the CBI restrictions on house buying have certainly impacted the ability of
low- or middle-income households to afford larger unit sizes, the overall relationship between price to
income for purchasers in Galway City is positive.
This report has presented conclusions for developers and planners alike to take account of in carefully
considering the most appropriate unit compositions which align with Galway City’s current and future
preferred person-household sizes, rental or at least mixed occupancy type solutions and unit compositions
which comprise a significant proportion of apartment-type units.
21Galway City – Future Growth, Housing Profile and Assessment of Future Needs APPENDIX I
Technical Note: A description of modelling as undertaken

Context

The interplay between demographic change and future housing requirements consist of many individual factors
such as the drivers of population change, settlement patterns, migratory flows, changing household composition
and the supply of housing. Research undertaken by Future Analytics Consulting (FAC) on behalf of Glenveagh
Properties Plc (in February 2019) assesses population change and its resulting impact on minimum housing
requirements in Galway City.

The following modelling overviews and specification of input assumptions underpin this research, the scope of
which was to develop a projection of population covering the period 2016-2031, informed by Census 2016 data
as baseline and compared with NPF draft NWRA RSES growth targets. The projection of future minimum housing
requirements could then be assessed using the custom projection by applying trended changes in household
composition to understand how existing supply will accommodate demographic change.

Modelling Overview: Demographics

                                              FAC’s projection of population is underpinned by the application
                                              of the demographic cohort component methodology (CCM); the
                                              same methodology as used by the CSO in preparing the national
                                              projections.

                                              CCM is widely used internationally as a best-in-class methodology.
                                              It provides a flexible and powerful approach to population
                                              projection by using varying comparative scenarios, each tailored
                                              around the application of qualified assumptions in mortality,
                                              fertility and migration (as aligned with the CSO’s assessments).

The methodology applies key assumptions in fertility, mortality and migration year-on-year over the assessment
period, at single year of age and gender. In doing so, the population is aged through the model, impacted by
migratory inflows and outflows and mortality.

In considering a suitable basis for projection, FAC developed a series of scenarios, each with respect to the most
recent national and regional assumptions published by the CSO, but also with specific regard to the latest Census
2016 data and published data (more recently released) on fertility and migratory flows (both internationally and
between counties). After assessing different scenarios, M1F1-aRAdj was selected as the preferred option.
A scenario named M1F1a(ligned)-R(ecent)-Adj(usted) or M1F1a-Radj was selected as the preferred option.
M1F1a-Radj relates to assumptions in fertility and migration (principally) which align with the CSO’s published
M1 and F1 outlooks (see below). It maintains the recent (inter-censally observed) net outward flow from Dublin,
which we believe will not decrease towards net neutral by 2022 but is set to increase (as played out during the
period 2002-2011). Dublin’s inward and outward flows impact all of Ireland’s regions, counties and settlements.
• Fertility
Full year fertility data for 2017 (Vital Statistics, CSO May 2018) was used to develop a baseline for each
County’s birth rate. Age-specific fertility rates were derived (births per thousand for women of child
bearing age) and rates then linearly interpolated to achieve a Total Fertility Rate (TFR) of 1.8 by 2026.
Therefore, this aligns with CSO F1 over the longer tail, but opts for a gradual reduction to 1.8 TFR so as
not to over-adjust counties were fertility is presently above the national average.
• Mortality
No change was made in using the published life tables from the CSO (Irish Life Tables No. 16, CSO July
2015), though it is recognised that mortality has fallen for men and women since their publication (the
CSO have yet to publish updated data). The principal assumption of gains in life expectancy at birth
from 77.9 years in 2010 to 85.1 in 2046 for males and 82.7 years in 2010 to 88.5 years in 2046 for
females was carried forward.
• Migration
The M1 CSO outlook for national net migration, assumes a steady continuation of high levels of net
inward migration at 30,000 per annum, repeating. When this research was conducted, the latest
available indication of net inward migration was 19,800 in 2017 and 34,000 in 2018. Therefore,
M1F1aRadj assumes a gradual reduction back to the reoccurring level of 30,000 net inward beyond
2021.
The continuation of high levels of net inward migration to 2031 is therefore premised on the prevailing
trends which can be expected to continue in line with improving economic conditions of the economy
at large and the pull of various sectors in attracting outside employees and students to Ireland.
Migration was assessed at regional and at county level. A migration matrix was developed to simulate
future inflows and outflows between counties, informed by inter county and settlement size flows
(CSO, 2018). A generalised growth rate per county of 0.25% was applied to both inflow and outflow
totals per annum and a specific spatial assumption applied to move migrants towards Dublin and the
Mid-East generally. This forms the basis of the ‘Recent’ assumption as featured in the scenario name.
This is in keeping with observed trends since 2006 and specifically carries forward the observed change
in Dublin’s net allocation. Unlike 2006-2011, where Dublin experienced a slight net inward surplus of
migrants, Dublin has now returned to almost +4,500 net outward migrants per annum – as people settle
in the surrounding counties, and this trend is set to continue.
As a consequence, Galway and the Western Region benefit from increased inward migration.Cohort Component Method
Utilised as the basis by which each scenario was projected, the cohort component method (CCM) for population
projection is widely used internationally as a best-in-class methodology which provides a flexible and powerful
approach to population projection.
CCM can incorporate many application techniques, types of data and assumptions regarding future trends. It
can also be used at any level of geography (given data suitability) and perhaps most importantly, it provides
projections of total population, demographic composition and individual components of population growth by
applying key assumptions in fertility rates, mortality rates and migration rates per year of projection across the
duration of the period.
Future populations are derived from a base population through the projection of population change and its
major demographic components, births, deaths and migration. The projection of the demographic components
of change is driven by the composition of the population by age, sex and birth rates, and the way these variables
determine the propensity to bear children, die and migrate to, from or within Ireland.
Knowledge of the age and sex composition of the population at any point in time is fundamental to the
projection of the population. Knowing the age-sex distribution at one date (2011) allows us to impute the age-
sex distribution of those still alive at later dates, since sex does not change while age advances with the passage
of time. This knowledge also allows the projection of demographic behaviours (above) as differentiated by age
based upon past trends and expert opinion in order to introduce confidence and mitigate uncertainty.
In its simplest statement, the component method is expressed by the following equation:
Components of population change are projected separately and applied to equation 1 recursively to produce a
series of populations. The measurement unit of time may be of any interval from t-1 to t, however, the impact
of each component will vary over time.
This logic is also true for individual age groups, recognising that the source population for a given age group is
the population at time t-1 in the adjacent younger age group. For the initial age group, it is births during the
interval from t-1 to t, hence the 2011 base figure for under 1’s is used. Equation 1 is replaced by two equations,
depending on whether the age group is under 1, denoted as 0, or any other age, denoted by a.
Each of the terms in equations 2 or 3 whether defined as a population or a number of events, relates to people
born in a particular year. Such a group is known as a birth cohort, hence the term “cohort component
method”.
Page 3You can also read