Gamma-Irradiation Induced Functionalization of Graphene Oxide with Organosilanes - MDPI
←
→
Page content transcription
If your browser does not render page correctly, please read the page content below
International Journal of
            Molecular Sciences

Article
Gamma-Irradiation Induced Functionalization of
Graphene Oxide with Organosilanes
Kabiru Musa Aujara 1 , Buong Woei Chieng 1,2, * , Nor Azowa Ibrahim 1,2, * ,
Norhazlin Zainuddin 1 and Chantara Thevy Ratnam 3
 1    Department of Chemistry, Faculty of Science, Universiti Putra Malaysia,
      43400 UPM Serdang, Selangor, Malaysia; kbaujara@gmail.com (K.M.A.); norhazlin@upm.edu.my (N.Z.)
 2    Materials Processing and Technology Laboratory, Institute of Advanced Technology, Universiti Putra
      Malaysia, 43400 UPM Serdang, Selangor, Malaysia
 3    Radiation Processing Technology Division, Malaysian Nuclear Agency, 43000 Bangi, Kajang, Malaysia;
      chantara@nuclearmalaysia.gov.my
 *    Correspondence: chieng891@gmail.com (B.W.C.); norazowa@upm.edu.my (N.A.I.);
      Tel.: +603-9769-6802 (B.W.C.); +603-9769-4205 (N.A.I.)

 Received: 22 January 2019; Accepted: 19 March 2019; Published: 18 April 2019

 Abstract: Gamma-ray radiation was used as a clean and easy method for turning the physicochemical
 properties of graphene oxide (GO) in this study. Silane functionalized-GO were synthesized by
 chemically grafting 3-aminopropyltriethoxysilane (APTES) and 3-glycidyloxypropyltrimethoxysilane
 (GPTES) onto GO surface using gamma-ray irradiation. This established non-contact process is
 used to create a reductive medium which is deemed simpler, purer and less harmful compared
 conventional chemical reduction. The resulting functionalized-GO were characterized by Fourier
 transform infrared spectroscopy (FT-IR), X-ray diffraction (XRD), field emission scanning electron
 microscopy (FE-SEM), thermogravimetric analysis (TGA), and Raman spectroscopy. The chemical
 interaction of silane with the GO surface was confirmed by FT-IR. X-ray diffraction reveals the change
 in the crystalline phases was due to surface functionalization. Surface defects of the GO due to the
 introduction of silane mioties was revealed by Raman spectroscopy. Thermogravimetric analysis
 of the functionalized-GO exhibits a multiple peaks in the temperature range of 200–650 ◦ C which
 corresponds to the degradation of chemically grafted silane on the GO surface.

 Keywords: functionalization; silanes; graphene; gamma-ray

1. Introduction
     Graphene enjoys so much attention since its discovery by Andre Geim and Konstantin Novoselov
in 2004 due to its unique electrical, optical, thermal, and mechanical properties which are desirable for
a broad range of high tech applications in supercapacitors, batteries, flexible transparent electronic
devices, composites, flexible transparent displays, and sensors [1]. Graphene is one atom thick,
two-dimensional (2D) monolayer sheet of sp2 bonded carbon atom arranged in a hexagonal lattice.
Graphene related materials that consist of chemical derivatives or structure of graphene are commonly
called ‘graphene’. These include double and few layered graphene and chemically reduced graphene
oxide (rGO) [2]. Potential applications of graphene is on the rise over the last decade and are
nowadays covering most research field in materials science. The range of graphene chemistries, grade,
and morphologies that can be processed is numerous due to the diversity of growth and surface
modification mechanism which has been used on sp3 carbon based materials [3]. For instance, epitaxial
growth, chemical vapor deposition (CVD) and mechanical cleavage of graphite leads to the formation
of very high grade material with low sp3 carbon content [4].

Int. J. Mol. Sci. 2019, 20, 1910; doi:10.3390/ijms20081910                        www.mdpi.com/journal/ijms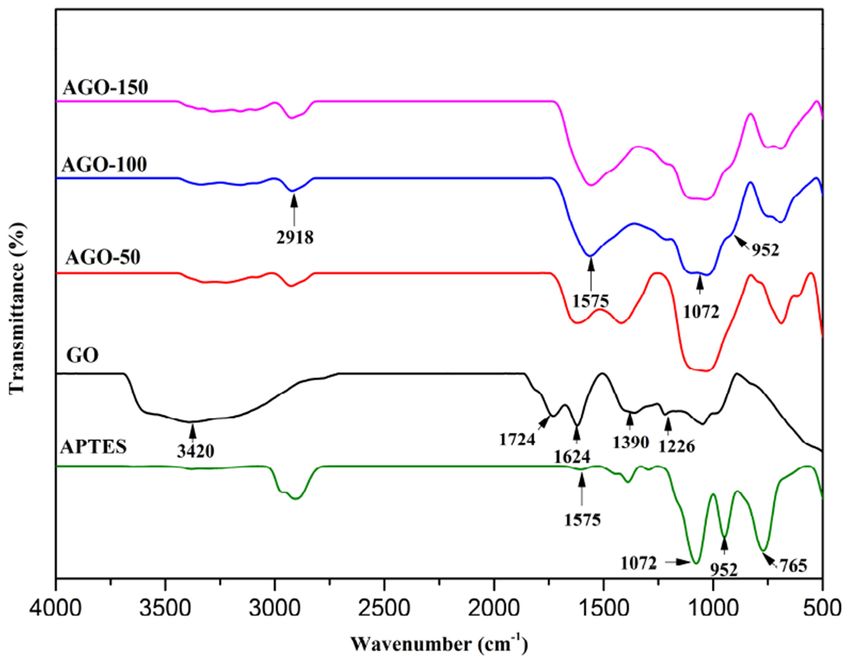
Int. J. Mol. Sci. 2019, 20, 1910                                                                     2 of 14

     The performance and quality of graphene depend on synthetic approaches and thus various
techniques have been developed to produce graphene with a wide range of properties based on
morphology and surface chemistry [5]. Some of the synthesis techniques of graphene includes chemical
vapor deposition, exfoliation method, organic synthesis approach, solid carbon foundation, expanding
of carbon nanotubes, and epitaxial process [6]. The reduction of GO fabricated from graphite through
Hummer’s method is relatively cheap and fast technique to produce low grade graphene material [7].
However, large scale based processes are impractical through these methods, hence oxidation and
exfoliation of graphite oxide followed by chemical reduction have been employed to prepare reduced
graphene oxide sheets or chemically functionalized graphene [8]. GO is generally regarded as an
oxidative state of graphene due to possession of huge amount of hydroxyl, carboxyl, and epoxide
functional groups on its basal planes and edges [9]. GO is associated with higher sp3 and defect content
across its sheets which primarily consists of residual oxygen groups and new sites generated upon
exfoliation and oxidation which must be alleviated to recover the thermo-mechanical and electrical
properties of pristine graphene [10].
     A new frontier takes into account the surface treatment and functionalization of GO for modification
of their surface with various agents in order to improve compatibility with polymers when it is used as
a reinforcing agent. The oxygen containing groups available on the basal plane and edges such as
hydroxyl, carboxyl, and epoxy groups provide suitable reactive sites for covalent functionalization.
Due to their exceptional physical properties and their dispersion characteristics in various polymer
matrices, GO and its derivatives have emerged as a new class of polymer nanocomposites as reinforcing
agents [11].
     Various functionalizing techniques have been developed for improving interfacial bonding and
dispersion of GO in the polymer matrix among which silane coupling agents gained so much attention
due to their bifunctional structures [12]. Coupling process can be achieved through chemical reaction
between the alkoxy groups of the silane molecules and the hydroxyl groups on the graphene surface
leaving the other functional groups of the silane molecule which can be amine, ethylene, epoxy,
thiohydroxy, etc. unreacted [13]. These unreacted functional groups can provide reaction sites between
graphene with polymer matrix thus leading to enhanced properties. Methods previously used for
the functionalization of GO such as chemical methods often have their drawbacks. These methods
usually involve toxic reagent, long reaction time, strict reaction conditions that limits scalability [14].
Therefore, a novel route that combines convenience of chemical synthesis and economic benefits,
whilst possessing high reduction efficiency, has been an important target for scientists.
     Recently, scientific interest has focused on the exploitation of gamma radiation as a clean
easy method for turning the physicochemical properties of GO [15]. This established non-contact
process is used to create a reductive medium which is deemed simpler, purer and less harmful than
conventional chemical reduction. Furthermore, the gamma radiation reduces the aggregations of
graphene nanosheets owing to its mild irradiation reduction rate [16]. In this study, we reported a
salinization of GO by gamma ray irradiation. GO were functionalized by two different silane agents
namely 3-aminopropyltriethoxysilane (APTES) and 3-glycidyloxypropyltrimethoxysilane (GPTES)
(Figure 1) at different gamma radiation doses.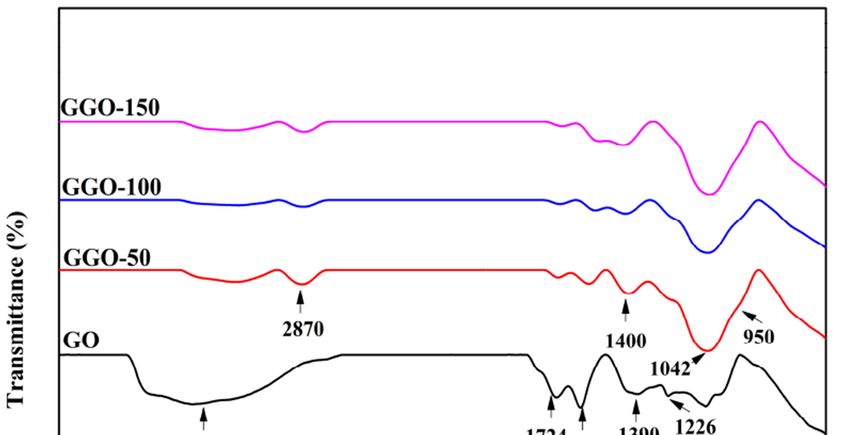
characteristic band appears at 1072 and 952 cm−1 which is assigned to Si-O-C and Si-O-Si indicating
 the successful chemical functionalization since the characteristics peaks of GO which include C=O
 vibration and carboxylic groups at 1724 cm−1 and CH2 at 2926 cm−1 vibration bands were not
 observed in the functionalized-GO. These changes can be observed for all the functionalized samples
 at different
Int.              radiation
     J. Mol. Sci. 2019,        doses of AGO-50, AGO-100, and AGO-150.
                        20, 1910                                                               3 of 14

     Figure
      Figure 1.1.        Chemical structure
                      Chemical       structure ofof    3-aminopropyltriethoxysilane
                                                      3-aminopropyltriethoxysilane    (APTES)
                                                                                      (APTES)   and
                                                                                                 and
     3-glycidylpropyltrimethoxysilane
      3-glycidylpropyltrimethoxysilane(GPTES).
                                       (GPTES).
2. Results and Discussion

2.1. Fourier Transform Infrared (FTIR)
     FTIR analysis is one of the direct evidences for GO functionalization as information about
the presence of functional groups in the samples. Figures 2 and 3 show the FTIR spectra for
3-aminopropyltriethoxysilne functionalized-GO (AGO) and 3-glycidyloxypropyltrimethoxysilane
functionalized-GO (GGO), respectively. The characteristics peaks of APTES at 1574 to 1576 cm−1 is
assigned to the deformation vibration of N-H bond, 1296 and 765 cm−1 assigned to Si-C vibration,
and the 1165, 1072, and 962 cm−1 which were assigned to Si-O-C bond [17]. The peak at 1100 cm−1 is
assigned to the stretching vibration of C-NH2 bond [18,19]. The characteristics features of GO includes
the absorption band at 1624 cm−1 (C=C skeletal vibration), 1068 and 1227 cm−1 (C-O-C in epoxide
group), 3420 cm−1 (C-OH stretching), 1390 and 1724 cm−1 (C=O stretching vibration of carbonyl
groups), 2830 and 2917 cm−1 (symmetric and asymmetric bands). For AGO, a new characteristic
band appears at 1072 and 952 cm−1 which is assigned to Si-O-C and Si-O-Si indicating the successful
chemical functionalization since the characteristics peaks of GO which include C=O vibration and
carboxylic groups at 1724 cm−1 and CH2 at 2926 cm−1 vibration bands were not observed in the
functionalized-GO. These changes can be observed for all the functionalized samples at different
radiation doses of AGO-50, AGO-100, and AGO-150.
     Strong characteristic peaks of GPTES was observed at 1196 and 1100 cm−1 which corresponded to
CH2 wagging vibrations of propyl chain and glycidoxy group, respectively [20]. For GGO, the band
at 3420 cm−1 becomes weak and band at 2870 cm−1 appears corresponding to the stretching of -CH2
groups from alkyl chain assigned to silane mioties of silane as shown in Figure 3. The appearance of
bands at 1042 and 950 cm−1 which are assigned to Si-O-C and Si-O-Si bonds, respectively, indicating
the successful chemical functionalization.

2.2. X-ray Diffraction (XRD) Analysis
     The  XRD
      Figure  2. diffractograms
                  FTIR spectra ofof GO
                                    GO and
                                         and AGO   are shown in Figure 4. functionalized-GO
                                              3-aminopropyltriethoxysilne  The GO shows a sharp    peak at
                                                                                              (AGO-50,
2θ = 9.8 corresponding    to
      AGO-100 and AGO-150).  the (001) plane with an interlayer spacing  (d-spacing) of 0.90 nm indicating
a highly ordered structure. This large d-spacing of GO results from the presence of large amount of
oxygen functional groups on the surface of GO. The XRD pattern also shows narrow (100) peak with
low intensity that corresponds to graphitic plane with long range order [21]. After functionalization of
GO with APTES, the XRD characteristic peak of the GO disappear due to the intercalation of silane
moieties on the surface of GO which leads to partial reduction and complete exfoliation of GO which
in turn leads to prevention of aggregation [22]. The disappearance of (001) peak in the case of AGO-50,
AGO-100 and AGO-150 indicates the loss of order perpendicular to the GO layer and complete loss of
planarity of functionalized-GO due to loss of (100) reflection. Similarly, the emergence of broad peak
around 22.19◦ suggest the removal of oxygen functional groups and dominant effect of silane [23].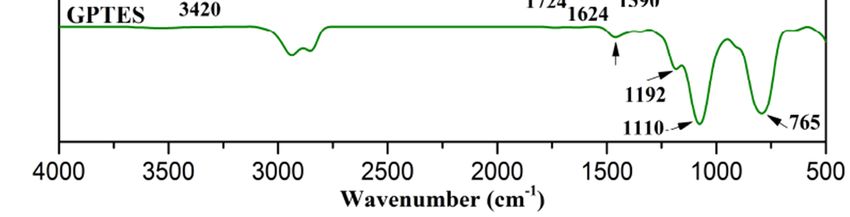
Int. J. Mol. Sci. Figure
                  2019, 20, 1910
                             1.   Chemical     structure    of   3-aminopropyltriethoxysilane   (APTES)   and        4 of 14
                  3-glycidylpropyltrimethoxysilane (GPTES).

      Figure 2.  Figure
                   FTIR 2.spectra
                               FTIR of spectra
                                         GO andof GO  and 3-aminopropyltriethoxysilne
                                                  3-aminopropyltriethoxysilne         functionalized-GO
                                                                                functionalized-GO       (AGO-50,
                                                                                                     (AGO-50, AGO-100
      andInt.    AGO-100
           AGO-150).         and   AGO-150).
              J. Mol. Sci. 2019, 20, x FOR PEER REVIEW                                                         4 of 15

             Figure
      Figure 3. FTIR3.spectra
                       FTIR spectra
                              of GO of GO
                                       andand 3-glycidyloxypropyltrimethoxysilane functionalized-GO
                                           3-glycidyloxypropyltrimethoxysilane                      (GGO-50,
                                                                                     functionalized-GO   (GGO-50,
      GGO-100GGO-100   and GGO-150).
                and GGO-150).

              Strong characteristic peaks of GPTES was observed at 1196 and 1100 cm-1 which corresponded
          to CH2 wagging vibrations of propyl chain and glycidoxy group, respectively [20]. For GGO, the
          band at 3420 cm−1 becomes weak and band at 2870 cm−1 appears corresponding to the stretching of
          -CH2 groups from alkyl chain assigned to silane mioties of silane as shown in Figure 3. The
          appearance of bands at 1042 and 950 cm−1 which are assigned to Si-O-C and Si-O-Si bonds,
          respectively, indicating the successful chemical functionalization.

          2.2. X-ray Diffraction (XRD) Analysis
Int. J. Mol. Sci. 2019, 20, x FOR PEER REVIEW 5 of 15
Int. J. Mol. Sci. 2019, 20, 1910 5 of 14
AGO-150
Intensity (a.u.)
AGO-100
AGO-50
GO
10 20 30 40 50
o
2θ ( )
4. XRD 4.spectra
Figure Figure XRD of GO and
spectra of 3-aminopropyltriethoxysilne functionalized-GO
GO and 3-aminopropyltriethoxysilne (AGO-50,
functionalized-GO AGO-100,
(AGO-50,
and AGO-150).
AGO-100, and AGO-150).
The diffractograms
The diffractograms of GGO are are
of GGO shown
shownin in
Figure
Figure5.5.The
The appearance
appearance ofofbroad
broadband
band with
with lowlow
intensity cantered
intensity at 21.4
cantered at ◦21.4°
reveals thethe
reveals dominance
dominanceofofsilane
silane moieties and the
moieties and theremoval
removal of of oxygen
oxygen
containing
containing groups groups
on the onGOthe surface.
GO surface.TheThe emergenceof
emergence ofaanew
new hump
hump at 2θ==7.2°
at2Ɵ ◦ in
7.2in allall
of of
thethe
GOGO
functionalized with 3-glycidyloxypropyltrimethoxysilane at GGO-50,
functionalized with 3-glycidyloxypropyltrimethoxysilane at GGO-50, GGO-100, and GGO-150 withGGO-100, and GGO-150 with
varyingvarying
intensity intensity revealed covalent functionalization of the GO with silane moieties. The XRD
revealed covalent functionalization of the GO with silane moieties. The XRD patterns
patterns of functionalized-GO—i.e., AGO’s and GGO’s—are moderately similar except for the fact
of functionalized-GO—i.e., AGO’s and GGO’s—are moderately similar except for the fact that for
that for GGO’s pattern has higher intensity compared to AGO’s. This is attributed to the extent of
GGO’s reduction
pattern has higher intensity compared to AGO’s.that Thisalso
is attributed to the extent of reduction by
Int. J. Mol. Sci. by
2019,3-glycidyloxypropyltrimethoxysilane
20, x FOR PEER REVIEW have a broad peck at 21.3° 6which
3-glycidyloxypropyltrimethoxysilane that also have a broad peck at 21.3◦ which subsequently of 15
enlarge
subsequently enlarge the interlayer distance (002) [22].
the interlayer distance (002) [22].
GGO-150
Intensity (a.u.)
GGO-100
GGO-50
GO
10 20 30 40 50
o
2θ ( )
Figure 5. XRD spectra of GO and 3-glycidyloxypropyltrimethoxysilane functionalized-GO (GGO-50,
Figure 5. XRD spectra of GO and 3-glycidyloxypropyltrimethoxysilane functionalized-GO (GGO-50,
GGO-100, and GGO-150).
GGO-100, and GGO-150).
2.3. Field Emission Scanning Electron Microscopy (FE-SEM)
Surface morphologies of pristine GO and functionalized-GO were observed using FE-SEM.
Pristine GO has smooth surface with layered structure at the edges [1] (Figure 6a). On the other
hand, Figure 6(b) AGO-100, 6(c) GGO-100 and 6(d) AGO-150 and 6(e) GGO-150 samples exhibitInt. J. Mol. Sci. 2019, 20, 1910 6 of 14
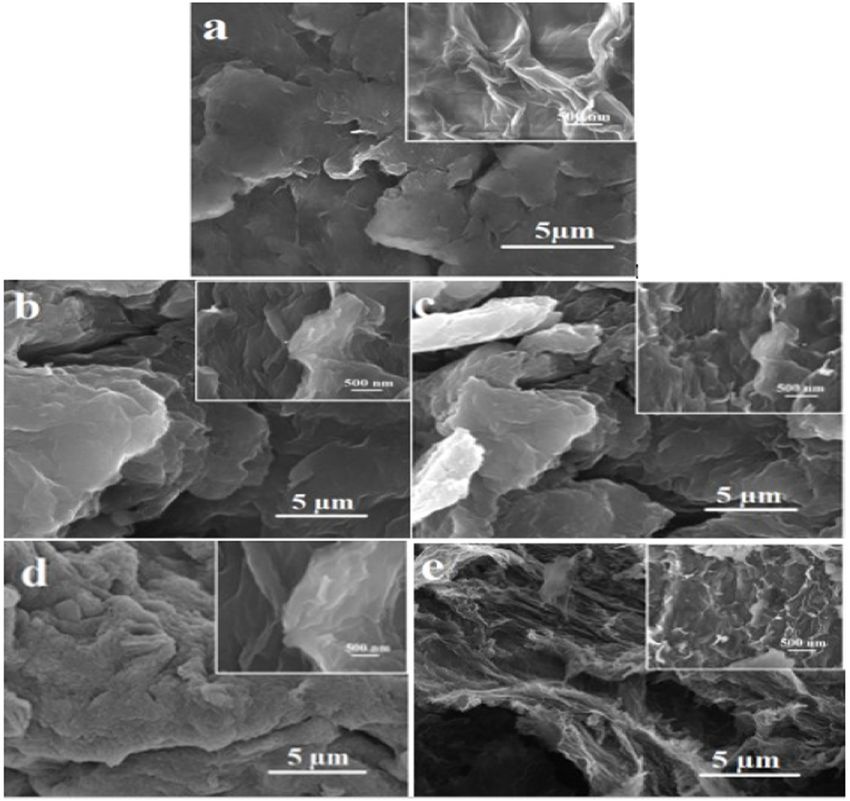
2.3. Field Emission Scanning Electron Microscopy (FE-SEM)
Surface morphologies of pristine GO and functionalized-GO were observed using FE-SEM.
Pristine GO has smooth surface with layered structure at the edges [1] (Figure 6a). On the other
hand, Figure 6b AGO-100, Figure 6c GGO-100 and Figure 6d AGO-150 and Figure 6e GGO-150
samples exhibit rough surface with wrinkle morphology and the inserted magnified image on all
the four samples shows several thin sheets with puffy structures [22], which signify the present of
silane moieties that act as a spacer between the GO sheets and hence preventing restacking [24,25].
The distinction in morphology observed between GO and the functionalized-GO results from covalent
bonding and condensation reactions between silanes molecules and GO sheets which subsequently
hinders agglomeration [26].
Int. J. Mol. Sci. 2019, 20, x FOR PEER REVIEW 7 of 15
Figure
Figure 6. 6. FE-SEM
FE-SEM micrographsofof(a)
micrographs (a)GO,
GO,(b)
(b) AGO-100,
AGO-100, (c)
(c) GGO-100,
GGO-100,(d)
(d)AGO-150,
AGO-150,and
and(e)(e)
GGO-150.
GGO-150.
2.4. Raman Spectroscopy
The Raman spectroscopy is a powerful tool used to investigate the structure of a
graphene-based material. The Raman spectra of GO and functionalized-GO are shown in Figure 7
and 8. GO exhibit two strong characteristics bands at 1583 cm−1 (G band) and 1345 cm−1 (D band). The
D and G bands are attributed to the structural defect (disorder-induced mode) and first order
scattering from the E2g phenom of sp2 carbon bonding, respectively. The ratio of the intensities
between the D and G bands (ID/IG) depends on the level of disorder; i.e., sp3 defects within the sp2
hybridized graphene in the functionalized-GO [6]. The ID/IG ratios for GO, AGO-50, AGO-100, and
AGO-150 were 0.90, 1.08, 1.12, and 1.13, respectively as shown in Table 1. The increase in ID/IC ratio
clearly demonstrate the defect in graphene sheet caused by the silane grafting that might leads to
considerable changes in the physic-chemical, structural and electrical properties. This result shows
that the functionalization of GO with APTES alters the structure of GO through the formation of
more sp3 carbon within the sp2 carbon network of graphene, resulting in higher of ID/IG in AGOInt. J. Mol. Sci. 2019, 20, 1910 7 of 14
2.4. Raman Spectroscopy
The Raman spectroscopy is a powerful tool used to investigate the structure of a graphene-based
material. The Raman spectra of GO and functionalized-GO are shown in Figures 7 and 8. GO exhibit
two strong characteristics bands at 1583 cm−1 (G band) and 1345 cm−1 (D band). The D and G bands
are attributed to the structural defect (disorder-induced mode) and first order scattering from the
E2g phenom of sp2 carbon bonding, respectively. The ratio of the intensities between the D and G
bands (ID /IG ) depends on the level of disorder; i.e., sp3 defects within the sp2 hybridized graphene
in the functionalized-GO [6]. The ID /IG ratios for GO, AGO-50, AGO-100, and AGO-150 were 0.90,
1.08, 1.12, and 1.13, respectively as shown in Table 1. The increase in ID /IC ratio clearly demonstrate
the defect in graphene sheet caused by the silane grafting that might leads to considerable changes in
the physic-chemical, structural and electrical properties. This result shows that the functionalization
of GO with APTES alters the structure of GO through the formation of more sp3 carbon within the
sp 2
Int. J.carbon
Mol. Sci.network
2019, 20, x of
FORgraphene, resulting in higher of ID /IG in AGO [27]. The forward shifting8 of
PEER REVIEW of G
15
band position also confirm the assimilation of silane moieties in the GO framework implying better
exfoliation of graphene layer [3].
D G
ID/IG= 1.13
AGO-150
Intensity (a.u)
ID/IG= 1.12 AGO-100
ID/IG= 1.08 AGO-50
ID/IG= 0.90 GO
500 1000 1500 2000 2500 3000 3500
Raman Shift (cm-1)
Figure 7. Raman spectra of GO and 3-aminopropyltriethoxysilane functionalized-GO (AGO-50,
Figure 7. and
AGO-100 Raman spectra of GO and 3-aminopropyltriethoxysilane functionalized-GO (AGO-50,
AGO-150).
AGO-100 and AGO-150).
Table 1. Summary of the Raman Shift and ID /IG for the samples
Similarly, the ID/IG values for GGO-50,
Raman GGO-100,
Shift of Ramanand GGO-150
Shift of are 1.12, 1.13, and 1.28,
Samples
respectively. The observed ratio ofDGO functionalized
−1 with GPTES
−1 are /IG
IDalmost similar but slightly
Band (cm ) D Band (cm )
higher than that functionalized
GO with 1345.77
APTES, this could1583.33
be probably 0.90
due to the high extend of
grafting by APTES. AGO-50 1345.77 1589.55 1.08
AGO-100 1345.77 1594.52 1.12
AGO-150 1345.77 1599.50 1.13
GGO-50 1345.77 1597.01 1.12
GGO-100 1345.77 1597.01 1.13
GGO-150 1345.77 1601.99 1.28
D G
ID/IG=1.28 GGO-150
ID/IG=1.13 GGO-100
sity (a.u)Similarly, the ID/IG values for GGO-50, GGO-100, and GGO-150 are 1.12, 1.13, and 1.28,
respectively. The observed ratio of GO functionalized with GPTES are almost similar but slightly
higher than that functionalized with APTES, this could be probably due to the high extend of
grafting by APTES.
Int. J. Mol. Sci. 2019, 20, 1910 8 of 14
D G
ID/IG=1.28 GGO-150
ID/IG=1.13 GGO-100
Intensity (a.u)
GGO-50
ID/IG=1.12
ID/IG=0.90
GO
500 1000 1500 2000 2500 3000 3500
Raman Shift (cm-1)
Figure 8. Raman spectra of GO and 3-glycidyloxypropyltrimethoxysilane functionalized-GO (GGO-50,
GGO-100, and GGO-150).
Similarly, the ID /IG values for GGO-50, GGO-100, and GGO-150 are 1.12, 1.13, and 1.28, respectively.
The observed ratio of GO functionalized with GPTES are almost similar but slightly higher than that
functionalized with APTES, this could be probably due to the high extend of grafting by APTES.
2.5. Thermogravimetric (TG) Analysis
TG analysis was used to investigate the thermal stability of the sample and to further confirm
the functionalization of GO with silane moities. The TG and derivative thermogravimetric (DTG)
thermograms of AGOs are shown in Figure 9. Upon heating, GO loses ~18% weight at temperature
between 30–120 ◦ C due to the removal of water molecules that adsorbed onto the hydrophilic GO
surface. As the temperature increases from 150–230 ◦ C GO exhibit decomposition behavior (39% weight
loss) which is attributed to the labile oxygen containing functional groups. Another significant weight
drop occurs around 300 ◦ C where GO loses about 68% weight which is due to pyrolysis of the carbon
skeleton which is referred to as end degradation temperature. The TGA thermograph depicted in
Figure 9a represent the thermal behavior of APTES grafted GO (AGO-50, AGO-100, and AGO-150).
Four steps degradation mechanism are shown for all the functionalized-GO at various temperature
regions. These regions are 0–120 ◦ C corresponding to region where water molecules are lost, 120–300 ◦ C
where unreacted silane is adsorbed onto the surface of the GO are lost, 300–650 ◦ C corresponding to
region of thermal decomposition of grafted silane and at 650 ◦ C and above where pyrolysis of the
carbon skeletal took place. As compared to GO which is represented by three degradation steps in the
DTG shown in Figure 9b. In the case of functionalized-GO, the second step degradation (i.e., between
120–300 ◦ C) involves the removal of physically adsorbed silane molecules while the degradation
step between 300–650 ◦ C can be ascribed to the breakage of APTES molecules grafted to the GO
surface. This thermal behavior is well pointed out in many studies conducted on graphene and
carbon nanotube [28,29]. The end temperature of degradation i.e., pyrolysis of the carbon skeletal
significantly shifted to a higher temperature as a result of silane grafting thereby enhancing thermal
stability [30]. Table 2 highlights the approximate percentage weight loss of the samples at various
temperature regions.Int. J. Mol. Sci. 2019, 20, x FOR PEER REVIEW 10 of 15
Int. J. Mol. Sci. 2019, 20, 1910 9 of 14
(a)
100
80 AGO-150
GO AGO-100
Weight (%)
60
AGO-50
40
20
100 200 300 400 500 600 700
o
Temperature ( C)
(b)
0.4
GO
0.2
AGO-150
0.0
Derivative mass (%/min)
AGO-100
-0.2
AGO-50
-0.4
-0.6
-0.8
-1.0
-1.2
100 200 300 400 500 600 700
o
Temperature ( C)
Figure 9. (a) TG and (b) DTG thermograms of GO, AGO-50, AGO-100, and AGO-150.
Figure 9. (a) TG and (b) DTG thermograms of GO, AGO-50, AGO-100, and AGO-150.
Table 2. Percentage weight loss of GO and functionalized-GOs at various temperature regions.
On the other hand, theWeight
weightLoss
loss regions
WeightforLoss
the GGO can be
Weight observed
Loss (%) in the thermograms
Samples
depicted in Figure 10, which are at ◦0–120 °C, 140–320◦ °C, and 350–500
◦ °C temperature regions.
(%) 30–120 C (%) 120–300 C 300–650 C
Similarly, these regions
GO also correspond
18.7 water evaporation,
39.7 loss of unreacted
0 silanes adsorbed at the
surface of GO AGO-50
and oxidative thermal
12.0 decomposition 18.3 of grafted silanes.
20.5 GGO-150 shows the lowest
weight loss ofAGO-100
5% at the 0–12012.8
°C temperature16.2 region with enhance
21.6 thermal stability than other
AGO-150
functionalized-GO. 11.8 15.6 23.4
GGO-50 11.0 19.8 23.0
GGO-100 8.4 13.7 29.0
GGO-150 7.0 9.8 31.8Int. J. Mol. Sci. 2019, 20, 1910 10 of 14
On the other hand, the weight loss regions for the GGO can be observed in the thermograms
depicted in Figure 10, which are at 0–120 ◦ C, 140–320 ◦ C, and 350–500 ◦ C temperature regions. Similarly,
these regions also correspond water evaporation, loss of unreacted silanes adsorbed at the surface of
GO andInt.oxidative
J. Mol. Sci. 2019, 20, x decomposition
thermal FOR PEER REVIEW
of grafted silanes. GGO-150 shows the lowest weight loss of11 of 15
5% at the 0–120 ◦ C temperature region with enhance thermal stability than other functionalized-GO.
(a)
100
80
GGO-150
Weight (%)
GGO-100
60 GGO-50
40
GO
20
100 200 300 400 500 600 700
o
Temperature ( C)
(b)
0.4
GO
0.2
GGO-150
0.0
Derivative mass (%/min)
GGO-100
-0.2
GGO-50
-0.4
-0.6
-0.8
-1.0
-1.2
100 200 300 400 500 600 700
o
Temperature ( C)
Figure 10. (a) TG and (b) DTG thermograms of GO, GGO-50, GGO-100, and GGO-150.
Figure 10. (a) TG and (b) DTG thermograms of GO, GGO-50, GGO-100, and GGO-150.
As stated earlier, the weight loss of the silane functionalized-GO comes from three contributions.
Table 2. Percentage
The first contribution weight loss and
was the dehydration of GO and functionalized-GOs
dehydroxylation at various
which occurs temperature
during heatingregions
process
in the TGASamples
measurement [31]. ◦
Weight LossIn
(%)the temperature
30–120 °C Weightrange
Lossbetween 30–120
(%) 120–300 C, the Loss
°C Weight weight
(%) loss was°C
300–650
mainly due toGOthe elimination of 18.7
water molecules adsorbed on the
39.7 GO surface [32]. As the temperature
0
AGO-50 12.0 18.3 20.5
AGO-100 12.8 16.2 21.6
AGO-150 11.8 15.6 23.4
GGO-50 11.0 19.8 23.0
GGO-100 8.4 13.7 29.0
GGO-150 7.0 9.8 31.8Int. J. Mol. Sci. 2019, 20, 1910 11 of 14
rises above 120 ◦ C all the molecular water was removed and any other weight loss comes from APTES
and GPTES molecules respectively. The second contribution is as a result of physically adsorbed or
decomposed APTES and GPTES which can be removed by washing with ethanol. However, complete
removal is hardly achieved, therefore any possible remains still gives a contribution to the weight loss
during TGA measurement. The boiling point of APTES and GPTES is 217 ◦ C and 120 ◦ C, respectively;
it is therefore assumed all physically adsorbed APTES and GPTES were completely removed before
300 ◦ C. The third contribution comes from the decomposition of chemically bonded APTES and GPTES.
From the deferential curves, it can be seen that the main decomposition occurs around 500 ◦ C which is
agreement with previous study [33] that the thermal decomposition of grafted silane took place above
450 ◦ C and the C-Si bond started breaking up at 450–510 ◦ C when APTES was heated in a nitrogen
gas atmosphere.
3. Materials and Methods
3.1. Materials
Graphite powder (Int. J. Mol. Sci. 2019, 20, 1910 12 of 14
nitrogen flow rate of 20 mL/min. The weight loss temperature function graph was plotted. Shimadzu
XRD-6000 X-ray diffractometer (Tokyo, Japan) was used to determine the interlaying spacing of the GO
sheets before and after functionalization. Data were collected within the range of scattering angles (2θ)
of 2◦ to 50◦ at the rate of 2◦ /min. Raman spectroscopy was used to evaluate the microstructure using
Alpha300R Laser Raman spectrophotometer (WItec, Ulm, Germany). The Raman shift was recorded at
500–4000 cm−1 wavelength region. The surface morphology was characterized by FE-SEM using FEI
Nova NanoSEM 230 (FEI, Hillsboro, OR, USA).
4. Conclusions
In this study, 3-aminopropyltriethoxysilne (APTES) and 3-glycidyloxypropyltrimethoxysilane
(GPTES) were successfully grafted onto GO via gamma-ray irradiation. The changes in structure and
morphology due to radiation induced functionalization and partial reduction are proven by means
of FT-IR, XRD, FE-SEM, Raman, and TG analyses. Beside the elimination of hydroxyl and epoxide
functional groups, some alkyl groups are attached onto functionalized-GO due to recombination of
radicals. This method is a promising way to functionalize and partially reduce GO at an even lower
radiation dose of 50 kGy. Silane functionalized-GO has great potential for use as a hydrophobic
material in industry such as in corrosion prevention application.
Author Contributions: Conceptualization, K.M.A., B.W.C., and N.A.I.; Methodology, K.M.A. and B.W.C.;
Validation, K.M.A., B.W.C., and N.A.I.; Formal analysis, K.M.A. and B.W.C.; Resources, N.A.I. and C.T.R.;
Writing—original draft preparation, K.M.A.; Writing—review and editing, K.M.A. and B.W.C.; Supervision,
B.W.C., N.A.I., N.Z., and C.T.R.; Project administration, N.A.I.; Funding acquisition, B.W.C. and N.A.I.
Funding: This research was funded by Fundamental Research Grant Scheme, Ministry of Education Malaysia,
grant number 5524950. The APC was funded by Universiti Putra Malaysia.
Conflicts of Interest: The authors declare no conflict of interest. The funders had no role in the design of the
study; in the collection, analyses, or interpretation of data; in the writing of the manuscript, or in the decision to
publish the results.
References
1. Jung, C.-H.; Hong, J.-H.; Jung, J.-M.; Hwang, I.-T.; Jung, C.-H.; Choi, J.-H. Preparation of sulfonated reduced
graphene oxide by radiation-induced chemical reduction of sulfonated graphene oxide. Carbon Lett. 2015,
16, 41–44. [CrossRef]
2. Liu, F.; Lee, C.W.; Im, J.S. Graphene-Based Carbon Materials for Electrochemical Energy Storage. J. Nanomater.
2013, 2013, 1–11. [CrossRef]
3. Dumée, L.F.; Feng, C.; He, L.; Allioux, F.-M.; Yi, Z.; Gao, W.; Banos, C.; Davies, J.B.; Kong, L. Tuning the grade
of graphene: Gamma ray irradiation of free-standing graphene oxide films in gaseous phase. Appl. Surf. Sci.
2014, 322, 126–135. [CrossRef]
4. Özçelik, V.O.; Cahangirov, S.; Ciraci, S. Epitaxial growth mechanisms of graphene and effects of substrates.
Phys. Rev. B 2012, 85, 235456. [CrossRef]
5. Jilani, A.; Othman, M.H.D.; Ansari, M.O.; Hussain, S.Z.; Ismail, A.F.; Khan, I.U.; Inamuddin. Graphene and
its derivatives: Synthesis, modifications, and applications in wastewater treatment. Environ. Chem. Lett.
2018, 16, 1301–1323. [CrossRef]
6. Choi, W.; Lahiri, I.; Seelaboyina, R.; Kang, Y.S. Synthesis of Graphene and Its Applications: A Review.
Crit. Rev. Solid State Mater. Sci. 2010, 35, 52–71. [CrossRef]
7. Hummers, W.S.; Offeman, R.E. Preparation of Graphitic Oxide. J. Am. Chem. Soc. 1958, 80, 1339. [CrossRef]
8. Huang, X.; Yin, Z.; Wu, S.; Qi, X.; He, Q.; Zhang, Q.; Yan, Q.; Boey, F.; Zhang, H. Graphene-Based Materials:
Synthesis, Characterization, Properties, and Applications. Small 2011, 7, 1876–1902. [CrossRef] [PubMed]
9. Zhang, W.L.; Liu, J.; Choi, H.J. Graphene and Graphene Oxide Composites and Their Electrorheological
Applications. J. Nanomater. 2015, 2015, 8. [CrossRef]
10. Lubkowski, G.; Kuhnhenn, J.; Suhrke, M.; Weinand, U.; Endler, I.; Meibner, F.; Richter, S. Gamma Radiation
Effects in Vertically Aligned Carbon Nanotubes. IEEE Trans. Nuclear Sci. 2012, 59, 792–796. [CrossRef]Int. J. Mol. Sci. 2019, 20, 1910 13 of 14
11. Pourhashem, S.; Vaezi, M.R.; Rashidi, A.; Bagherzadeh, M.R. Distinctive roles of silane coupling agents on
the corrosion inhibition performance of graphene oxide in epoxy coatings. Prog. Org. Coat. 2017, 111, 47–56.
[CrossRef]
12. Li, W.; Zhou, B.; Wang, M.; Li, Z.; Ren, R. Silane functionalization of graphene oxide and its use as a
reinforcement in bismaleimide composites. J. Mater. Sci. 2015, 50, 5402–5410. [CrossRef]
13. Ma, P.C.; Kim, J.-K.; Tang, B.Z. Functionalization of carbon nanotubes using a silane coupling agent. Carbon
2006, 44, 3232–3238. [CrossRef]
14. Ahmad Daud, N.; Chieng, B.W.; Ibrahim, N.A.; Talib, Z.A.; Muhamad, E.N.; Zainal Abidin, Z. Functionalizing
Graphene Oxide with Alkylamine by Gamma-ray Irradiation Method. Nanomaterials 2017, 7, 135. [CrossRef]
[PubMed]
15. Chieng, B.W.; Ibrahim, N.A.; Ahmad Daud, N.; Talib, Z.A. Functionalization of Graphene Oxide via
Gamma-Ray Irradiation for Hydrophobic Materials. In Synthesis, Technology and Applications of Carbon
Nanomaterials; Rashid, S.A., Raja Othman, R.N.I., Hussein, M.Z., Eds.; Elsevier: Amsterdam, The Netherlands,
2019; pp. 177–203. [CrossRef]
16. Ma, H.-L.; Zhang, L.; Zhang, Y.; Wang, S.; Sun, C.; Yu, H.; Zeng, X.; Zhai, M. Radiation preparation
of graphene/carbon nanotubes hybrid fillers for mechanical reinforcement of poly(vinyl alcohol) films.
Radiat. Phys. Chem. 2016, 118, 21–26. [CrossRef]
17. Mathialagan, M.; Ismail, H. Optimization and effect of 3-aminopropyltriethoxysilane content on the properties
of bentonite-filled ethylene propylene diene monomer composites. Polym. Compos. 2012, 33, 1993–2000.
[CrossRef]
18. Ling, P.A.; Ismail, H. Tensile Properties, Water Uptake, and Thermal Properties of Polypropylene/Waste
Pulverized Tire/Kenaf (PP/WPT/KNF) Composites. Bioresources 2013, 8, 806–817. [CrossRef]
19. Demjén, Z.; Pukánszky, B.; Nagy, J. Possible coupling reactions of functional silanes and polypropylene.
Polymer 1999, 40, 1763–1773. [CrossRef]
20. Šapić, I.M.; Bistričić, L.; Volovšek, V.; Dananić, V. Vibrational Analysis of 3-Glycidoxypropyltrimethoxysilane
Polymer. Macromol. Symp. 2014, 339, 122–129. [CrossRef]
21. Mauro, M.; Maggio, M.; Cipolletti, V.; Galimberti, M.; Longo, P.; Guerra, G. Graphite oxide intercalation
compounds with rotator hexagonal order in the intercalated layers. Carbon 2013, 61, 395–403. [CrossRef]
22. Pourhashem, S.; Rashidi, A.; Vaezi, M.R.; Bagherzadeh, M.R. Excellent corrosion protection performance of
epoxy composite coatings filled with amino-silane functionalized graphene oxide. Surf. Coat. Technol. 2017,
317, 1–9. [CrossRef]
23. Lee, C.Y.; Bae, J.-H.; Kim, T.-Y.; Chang, S.-H.; Kim, S.Y. Using silane-functionalized graphene oxides for
enhancing the interfacial bonding strength of carbon/epoxy composites. Compos. Part A Appl. Sci. Manuf.
2015, 75, 11–17. [CrossRef]
24. Sheng, X.; Cai, W.; Zhong, L.; Xie, D.; Zhang, X. Synthesis of Functionalized Graphene/Polyaniline
Nanocomposites with Effective Synergistic Reinforcement on Anticorrosion. Ind. Eng. Chem. Res. 2016, 55,
8576–8585. [CrossRef]
25. Ramezanzadeh, B.; Haeri, Z.; Ramezanzadeh, M. A facile route of making silica nanoparticles-covered
graphene oxide nanohybrids (SiO2 -GO); fabrication of SiO2 -GO/epoxy composite coating with superior
barrier and corrosion protection performance. Chem. Eng. J. 2016, 303, 511–528. [CrossRef]
26. Kim, M.; Kim, Y.; Baeck, S.H.; Shim, S.E. Effect of surface treatment of graphene nanoplatelets for improvement
of thermal and electrical properties of epoxy composites. Carbon Lett. 2015, 16, 34–40. [CrossRef]
27. Bandyopadhyay, P.; Park, W.B.; Layek, R.K.; Uddin, M.E.; Kim, N.H.; Kim, H.-G.; Lee, J.H. Hexylamine
functionalized reduced graphene oxide/polyurethane nanocomposite-coated nylon for enhanced hydrogen
gas barrier film. J. Membr. Sci. 2016, 500, 106–114. [CrossRef]
28. Hack, R.; Correia, C.H.G.; Zanon, R.A.d.S.; Pezzin, S.H. Characterization of graphene nanosheets obtained
by a modified Hummer’s method. Matéria (Rio de Janeiro) 2018, 23. [CrossRef]
29. Shanmugharaj, A.M.; Bae, J.H.; Lee, K.Y.; Noh, W.H.; Lee, S.H.; Ryu, S.H. Physical and chemical characteristics
of multiwalled carbon nanotubes functionalized with aminosilane and its influence on the properties of
natural rubber composites. Compos. Sci. Technol. 2007, 67, 1813–1822. [CrossRef]
30. Yang, X.; Wang, X.; Yang, J.; Li, J.; Wan, L. Functionalization of graphene using trimethoxysilanes and its
reinforcement on polypropylene nanocomposites. Chem.Phys. Lett. 2013, 570, 125–131. [CrossRef]Int. J. Mol. Sci. 2019, 20, 1910 14 of 14
31. Dugas, V.; Chevalier, Y. Surface hydroxylation and silane grafting on fumed and thermal silica. J. Colloid
Interface Sci. 2003, 264, 354–361. [CrossRef]
32. Qiao, B.; Wang, T.-J.; Gao, H.; Jin, Y. High density silanization of nano-silica particles using
γ-aminopropyltriethoxysilane (APTES). Appl. Surf. Sci. 2015, 351, 646–654. [CrossRef]
33. Dugas, V.; Chevalier, Y. Chemical Reactions in Dense Monolayers: In situ thermal cleavage of grafted esters
for preparation of solid surfaces functionalized with carboxylic acids. Langmuir 2011, 27, 14188–14200.
[CrossRef] [PubMed]
© 2019 by the authors. Licensee MDPI, Basel, Switzerland. This article is an open access
article distributed under the terms and conditions of the Creative Commons Attribution
(CC BY) license (http://creativecommons.org/licenses/by/4.0/).You can also read