GAS INFRASTRUCTURE MAP OF THE MEDITERRANEAN REGION
←
→
Page content transcription
If your browser does not render page correctly, please read the page content below
Empowering Mediterranean regulators for a common energy future.

Working Group on Gas (GAS WG)

GAS INFRASTRUCTURE MAP OF
THE MEDITERRANEAN REGION
                               MED17-24GA -5.4.2
                                FINAL REPORT
                                        Luogo, data

                       MEDREG is co-funded by the European Union

                   MEDREG – Association of Mediterranean Energy Regulators
  Corso di Porta Vittoria 27, 20122 Milan, Italy - Tel + 39 02 655 65 537 - Fax +39 02 655 65 562
                   info@medreg-regulators.org – www.medreg-regulators.org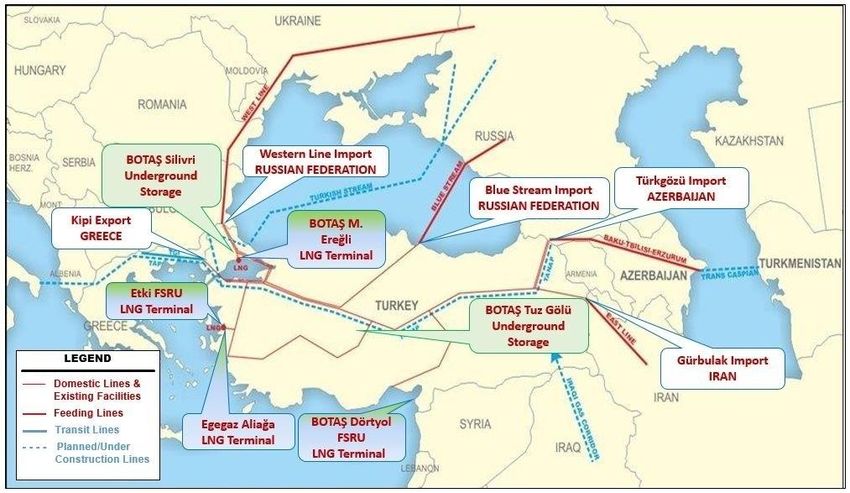
Ref: MED17-24GA -5.4.2
Gas Infrastructure Map of the Mediterranean region
Table of content
1. Introduction................................................................................................................................... 4
2. Work’s methodology description .................................................................................................. 6
3. Analysis of the Results ................................................................................................................... 8
3.1 TPA regimes in a nutshell ...................................................................................................... 8
3.2 A growing trend: LNG and FSRUs .......................................................................................... 8
3.3 Benefits and impacts of the investments .............................................................................. 9
3.4 Implementation barriers ...................................................................................................... 9
3.5 Key performance indicators ................................................................................................ 10
3.6 Infrastructure investments and natural gas demand.......................................................... 10
3.7 LNG and storage capacities versus demand........................................................................ 11
4. Final Remarks .............................................................................................................................. 13
5. APPENDIX .................................................................................................................................... 14
1- Existing interconnection infrastructure ...................................................................................... 14
2- Existing natural gas storage/lng terminal projects ..................................................................... 17
3 - INVESTMENT PLANS ................................................................................................................... 18
4 - Projected investments interconnection and storage ................................................................. 19
5- The expected benefits and impact of each project listed, on security of supply (e.g. route
and/or source diversification, emergency role, N-1 condition), market development (e.g.
reduction of congestions, entry of new suppliers) and regional market integration. .................... 24
6- The role of national regulatory agency in the overall investment plan ...................................... 29
7 - Implementation barriers ............................................................................................................ 30
8 - Infrastructure key performance indicators ................................................................................ 31
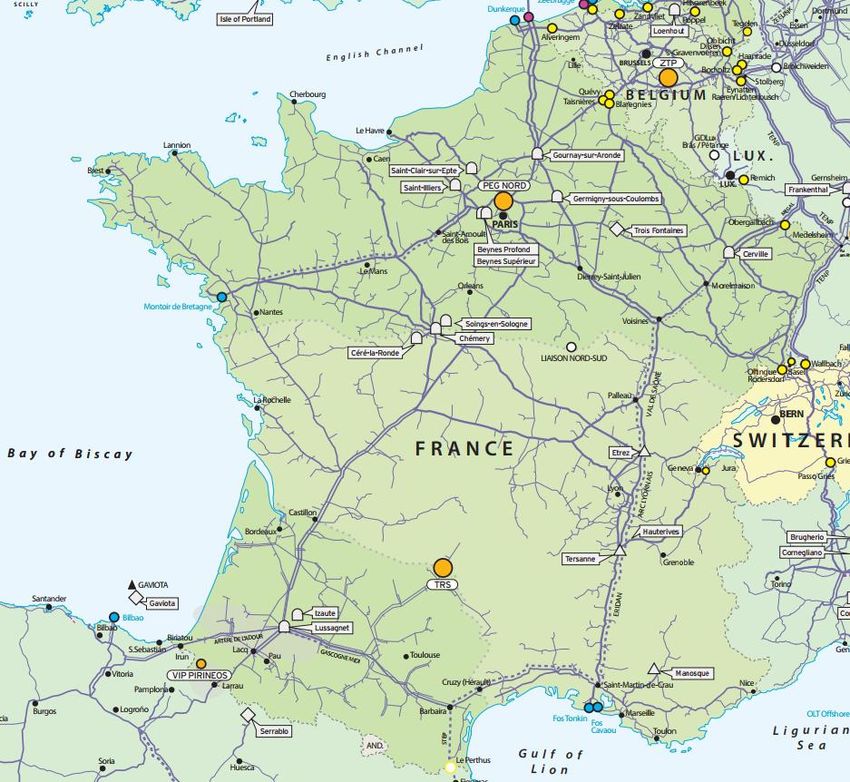
9 - Infrastructure maps of the contributing countries .................................................................... 38
2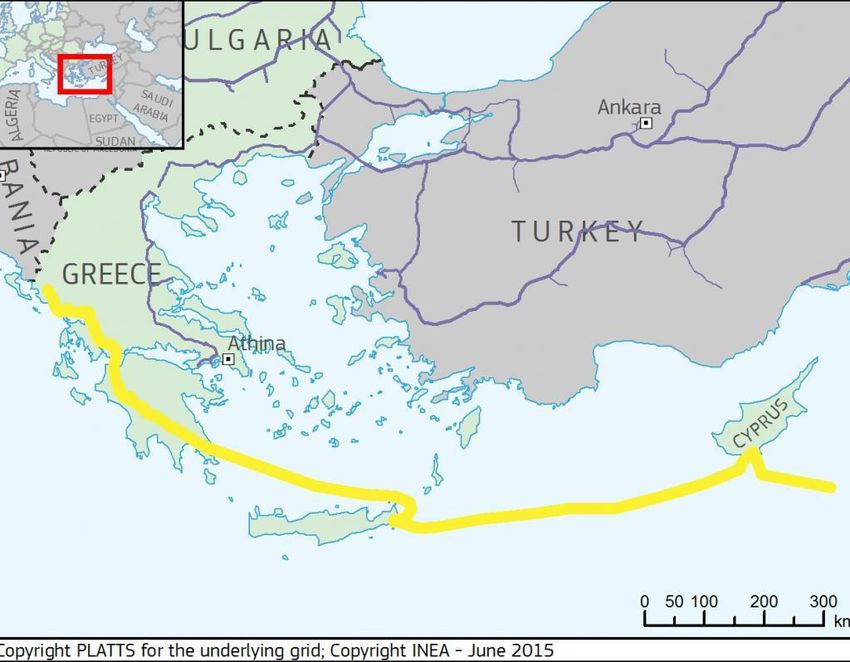
Ref: MED17-24GA -5.4.2
                                                   Gas Infrastructure Map of the Mediterranean region

                                                                 Acknowledgements
This report is the result of a work carried out by the MEDREG Gas Working Group (GAS
                                             WG) in the period November 2015-May 2017.

Main drafters: Mrs Bağdagül Kaya Caner and Mr Koray Kalaycioğlu (EMRA, Turkey) and
                                                    Prof. Maksim Shuli (ERE, Albania)
          Co-drafters: Mr. Bardhi Hoxha and Ms. Veronica Lenzi (MEDREG Secretariat)

                       Data and comments were provided by members of the Gas WG.

               This report was produced with the financial support of the European
               Union. Its contents are the sole responsibility of MEDREG and do not
               necessarily reflect the views of the European Union.

                                        3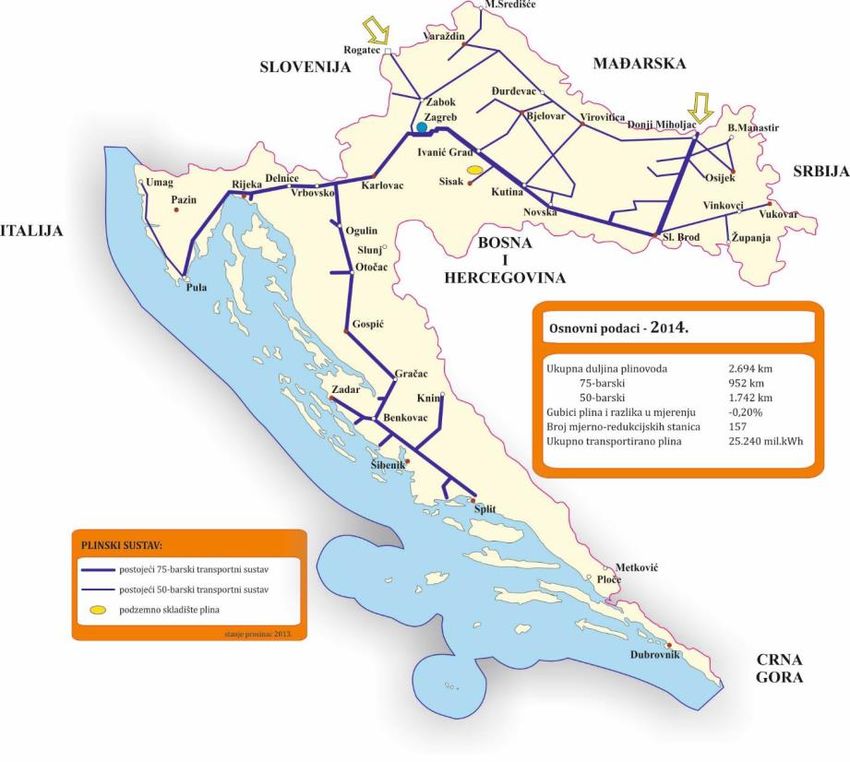
Ref: MED17-24GA -5.4.2
Gas Infrastructure Map of the Mediterranean region
1. Introduction
The natural gas sector in the Mediterranean region has been fundamentally transformed by
some field discovery (i.e. Zohr) and technological development in the drilling process that
have enabled the economic extraction of natural gas from shale formations. This
breakthrough has in turn unlocked new geographically diverse natural gas resources that
are unprecedented in size.
The availability of abundant, low-cost natural gas has increased demand for natural gas
from multiple end-use sectors. The electric power sector is currently the largest consumer of
natural gas in the Mediterranean south shore and at the same time Algeria is one of the
main gas exporters. After the recent developments, gas has regained some of its market
share because of gradually rising natural gas prices, the combination of favourable
economics and the lower conventional air pollution and greenhouse gas emissions
associated with natural gas relative to other fossil fuels is likely to contribute to expansion of
use of natural gas in the electric power sector in the future.
However, increased use of natural gas in the electric power sector also presents some
potential challenges. Unlike other fossil fuels, natural gas cannot typically be stored on-site
and must be delivered as it is consumed since natural gas can only be stored in specific
geological formations in gaseous form. Because adequate natural gas infrastructure is a
key component of electric system reliability (generation diversification) in many regions, it is
important to understand the implications of greater natural gas demand for the infrastructure
required to deliver natural gas to end users, including electric generators.
Natural gas consumption studies show a large diversity among the Mediterranean
countries. While almost half of the gas consumption is allocated to the
residential/commercial sectors, the other half is nearly equally shared by power generation
and industry. A high level of residential consumption in the winter is not expected,
considering the warm climate of the region. On the production side perspective, it is
important to notice that some countries do not even have access to gas, other countries do
not have any gas production and others are gas exporters.
The purpose of this report is to understand the actual infrastructure present in the
Mediterranean region and potential infrastructure developments in the natural gas
transmission systems under several future natural gas demand scenarios. This assessment
will include three main deliverables:
The first deliverable, the work’s methodology description, which is presented in this
report.
The second deliverable, to be finished during the second semester of 2017,
correspond to a questionnaire1 by which it will be possible to obtain a brief
description about the natural gas infrastructure in each MEDREG member.
1
Based on MEDREG Investment report questionnaire for gas
4
Ref: MED17-24GA -5.4.2
Gas Infrastructure Map of the Mediterranean region
A third deliverable, to be finalized by December 2017, corresponds to the Final
Assessment Report with the compilation of the different MEDREG member’s inputs
concerning their infrastructure map.
5
Ref: MED17-24GA -5.4.2
Gas Infrastructure Map of the Mediterranean region
2. Work’s methodology description
The present report intends to provide a clear picture of the gas infrastructure including
interconnection points, transmission pipelines crossing the country, transmission and
storage capacities, usage of the above-mentioned capacities and future investment plans
across MEDREG members.
Given the diversity of situations in the different countries, this assessment work intends to
evaluate the data that members have provided through a questionnaire. At the same time
members will be asked if they can share their gas infrastructure map to be included in the
final report. The assessment work also includes the collection and the analysis of data
related to their new investment plan and can serve as an update to MEDREG Investment
report for the Gas chapter.
At present, there are several realities among the MEDREG members concerning the gas
infrastructure:
For some countries, their transmission pipelines are overloaded and require a
compressor station upgrade or construction of a new pipeline.
Other situations exist among MEDREG members where the pipeline capacity is not
being used to its full extent.
The information from the different MEDREG members was obtained by a questionnaire.
The questions were based on the most recent situation of each country (31stDecember
2015).
When data is available in the Ten-Year-Network-Development of ENTSOG, MEDREG
members can provide their own data or indicate whether the ENTSOG data can be used in
for the MEDREG gas infrastructure map.
6
Ref: MED17-24GA -5.4.2
Gas Infrastructure Map of the Mediterranean region
Table 1: Contributions received from the MEDREG countries
COUNTRIES Answer received Observation
1. Albania No gas market established
2. Algeria
3. Bosnia –
Herzegovina
4. Croatia
5. Cyprus
6. Egypt
7. France
8. Greece
9. Israel
10. Italy
11. Jordan
12. Libya n/a
13. Malta No gas consumption
14. Montenegro No gas consumption
15. Morocco No gas Regulatory Authority
16. Palestine No gas Regulatory Authority
17. Portugal
18. Slovenia
19. Spain
20. Tunisia No gas Regulatory Authority
21. Turkey
Total 14
7Ref: MED17-24GA -5.4.2
Gas Infrastructure Map of the Mediterranean region
3. Analysis of the Results
Although the data for the years 2015 and 2016 are also collected from the countries that
can provide them, the 2014 values are taken as a basis for the comparisons made in this
study in order to provide better consistency since the verified data for the years 2015 and
2016 acquired from different MEDREG members vary considerably both in means of
collection and reporting methodology, and in some cases is absent at all. This report will
present both numeric and non-parametric data about selected points, while other
consolidated data can be found in the appendices.
3.1 TPA regimes in a nutshell
The data acquired from the questionnaires shed light to several characteristics of the
natural gas infrastructure of the contributing countries. Besides the physical characteristics
of these infrastructures such as capacities, pipeline lengths, directions of flow and
connected points, an important point of note that shall be examined from the perspective of
a regulator is the third party access (TPA) regimes of these facilities.
When analysing the TPA regimes of the existing and the planned infrastructure projects
(Appendices I, II and IV), it can be seen that most countries regulate third party access to
LNG terminals and storage facilities as well as the entry and the exit points, with the
exception of Egypt, Jordan and Italy. While Egypt and Jordan prefer to not to regulate the
access to any of these facilities, Italy grants exemptions or apply negotiated TPA regimes to
some LNG terminals, and adopts negotiated TPA to Algeria and Libya entry points. By
looking at the examples, it can be concluded that decision to adopt nTPA or rTPA regimes
is a matter of policy rather than how mature, big or well-established the gas market is.
3.2 A growing trend: LNG and FSRUs
Another point worth mentioning about the existing and planned infrastructure projects is the
interest in LNG projects, particularly floating storage and regasification units. Besides the
Floating Storage Regasification Units (FSRUs) that are recently facilitated in Egypt, Jordan
and Malta, the projected investments in Egypt, Greece and Malta indicate the growing
interest in this relatively new technology that has considerable advantages over traditional
LNG facilities. The advantages of FSRUs over conventional LNG terminals, such as
needing shorter time to start operation and less start-up cost, makes the investments for
these facilities realisable more easily and quickly. Other advantages like the ability to be
relocated according to demand and lesser environmental impact are just the icing on the
cake for FSRUs.
Although they are nothing new on the natural gas scene and building them requires longer-
term projects compared to FSRUs, the interest in traditional LNG terminals has not faded,
thanks to the price dynamics in the international markets. While some of the subject
countries, such as Greece, prefer to upgrade the existing LNG terminals for increasing the
entry capacity in a cost-efficient manner, it is also worth noting that Italy and Spain have
several projects for new LNG infrastructure. On the other hand, countries such as Turkey
opt to invest in both utilising new FSRUs and increasing the capacities of the existing
infrastructure, in order to increase the LNG input of the market.
8Ref: MED17-24GA -5.4.2
Gas Infrastructure Map of the Mediterranean region
3.3 Benefits and impacts of the investments
The part of the questionnaire about the benefits and impacts of the projects (Appendix 5)
depicts a clear picture of the driving forces behind infrastructure investments. Benefits
identified by MEDREG regulators lay in three areas; Security of Supply, Market
development and Regional Market Integration. Regulators perceive that the route and
source diversification is the most significant benefit derived from interconnection and LNG
facility investments. These data may also been taken as a clue for why, how, where and
when a new infrastructure investment may be made in order to gain most benefit from an
infrastructure investment.
Although the biggest perceived benefit of the storage facilities is security of supply as
expected, the flexibility these facilities provide to the market players should not be
neglected. In this regard, the types of storage facilities also play an important role. Salt
caverns, which allow the working gas to be withdrawn and replenished very quickly, are
very good means for market flexibility. Although these facilities are relatively expensive to
build, their ability to send out gas in a very short time, make them also valuable tools for
emergency situations and peak shaving.
3.4 Implementation barriers
As noted while discussing the benefits and the impacts of infrastructure projects, besides
the security of supply and market integration, an equally important role an infrastructure
investment shall pay is increasing competition and flexibility of the market. Evaluating an
investment according to the market dynamics can only be made through a cost-benefit
analysis, in other words, by determining the return of the investment. Such a feasibility
study brings forward the factors such as attractive tariffs, exemptions, open season
practices and incentives.
In this respect, another important focus of the project is the barriers affecting the investment
plans (Appendix 7), which aims to determine the shortcomings of the markets that shall be
dealt with for betterment of the investment environment. The most important barrier voted
as the highest priority by six countries, namely by Spain, Portugal, France, Jordan, Croatia
and Turkey, and voted as the second priority by Greece, Malta and Israel is the insufficiency
of the market demand.
The second priority according to the rankings is again an indicator regarding the market
dynamics, the financial feasibility of the projects and the expected revenues, which is
ranked as number one by Italy, Greece and Cyprus; and number two as for France, Croatia
and Turkey. Regulatory and legal obstacles are determined as higher priorities by countries
that are newly starting or have recently started to regulate the gas markets, such as Jordan
(ex-aequo with insufficiency of market demand), Israel and Egypt, which ranked the
obstacle as the first priority; and Cyprus, which ranked it as the second. The lack of interest
in interconnection projects is ranked as the second priority by only Portugal, while the lack
of internal reforms is determined to be second most important barrier by Egypt following
regulatory and legal barriers. Lack of coordination, technical barriers and political instability
are regarded as the least important barriers affecting the investments, ranked among the
top two priorities by none of the countries.
9Ref: MED17-24GA -5.4.2
Gas Infrastructure Map of the Mediterranean region
3.5 Key performance indicators
In order to compare the effectiveness and sufficiency of natural gas infrastructures,
measurable and objective indicators are needed. In this study, these indicators are referred
to as key performance indicators (KPI), a term highly popular in management, for lack of a
better term. While evaluating the KPIs of the contributing countries (Appendix I), datasets
for the year 2014 values are taken into account in order to provide better consistency. Three
major European markets outside MEDREG, namely Germany, the Netherlands and the UK
are included in the comparisons, as benchmarks for the examined indicators.
3.6 Infrastructure investments and natural gas demand
Since efficiency can be defined as the ratio of the outputs and inputs of a system, the
efficiency of a natural gas infrastructure may most basically be measured as the gas
supplied by the system, divided by an indicator of the size of the system, namely length of
the transmission system.
80
70,9
70 66,7
60 56,8
48,0 48,7
50
40 36,2
33,3 32,1
30 25,7 27,0
20 15,3
11,0 12,6
7,7 8,5 7,7
10 2,72,6 3,0
1,43,8 3,4
0,4 1,5
0
Pipeline length (1000 km) Annual consumption (bcm)
When we compare the pipeline lengths of the selected members with benchmark EU
countries, we can see that annual consumptions per length of transmission pipeline differs
greatly, which may be due to geographical and socio-economic reasons, as well as market
maturity and the sectors mainly using natural gas. The leader among MEDREG countries
with respect to unit consumption per network length is Jordan with 8 mcm/km, second only
to UK among the selected EU countries. Egypt, having a significant amount of annual
demand, follows Jordan with a ratio of 6,26 mcm/km.
It may be beneficial to note here that since a high ratio may be the sign of an efficient
transmission system, a lower ratio may mean that the transmission system is widely spread
in the country and/or natural gas penetration in households is lower. Another point of note is
that smaller countries with higher population densities like Netherlands tend to have higher
ratios in contrast to countries that are wider in an axis, such as Italy and Turkey, for which
the locations and distances between the nodes of supply, demand and storage is an
important factor.
10Ref: MED17-24GA -5.4.2
Gas Infrastructure Map of the Mediterranean region
Spain Portugal Croatia Jordan Greece Egypt Turkey Italy France Germany Netherlands UK
11.000 1.375 2.694 423 1.459 7.667 12.561 33.339 15.322 26.985 8.531 7.660
Pipeline
length (km)
Annual 25.730 3.800 2.627 3.400 2.990 48.019 48.717 56.800 36.200 70.900 32.100 66.700
Consumption
(mcm)
2,34 2,76 0,98 8,04 2,05 6,26 3,88 1,70 2,34 2,63 3,76 8,71
Annual
Consumption
/Length of
pipeline
3.7 LNG and storage capacities versus demand
Another way of determining how sufficient a country’s infrastructure with regards to security
of supply is comparing its means of storing natural gas with the demand in the country.
Storage and LNG facilities, both being effective instruments for dealing with seasonal
demand swings, supply disruptions and peak demand, can be evaluated particularly in two
ways: by comparing the daily send-out capacities with daily peak demand and by comparing
the annual capacities with annual consumption.
600 200%
179% 174%
486 489 487 180%
500 153%
160%
419
140%
400
120%
114%
300 99% 100%
68% 195 80%
200 71% 165 66%60%
41% 130
107
40%
100 33%
15,5 12,5 23,6 24% 20%
0,7
0 0%
Daily peak demand (mcm) LNG + storage daily send out / daily peak demand (%)
When looking at the graph of daily peak demands of the MEDREG countries, we can note
that two countries with historically high daily peak demands, Italy with 486 mcm/day and
France with 419 mcm/day, have the highest send-out/peak demand ratios after the leader,
Spain, with 71% and 99% respectively. Spain, also the leader among EU countries thanks
to its enormous LNG send-out capacities has a 179% send-out/peak demand ratio,
comfortably securing its peak demand of 107 mcm/day. Other relatively large
Mediterranean markets, Turkey with 195 mcm/day and Egypt with 130 mcm/day, have the
lowest send-out/peak demand ratios with 33% and 24% respectively, while Portugal has a
174% ratio, ranking among the most secure EU countries in this regard.
Another way to look at storage capacity is comparing the annual send-outs with annual
consumptions of the subject countries. For this comparison, which is a theoretical study of
security of supply, some assumptions are made. Assuming that the underground storage
11Ref: MED17-24GA -5.4.2
Gas Infrastructure Map of the Mediterranean region
facilities are filled before the maximum capacity before the winter season and the gas in the
reserves are withdrawn and dispatched once in the peak season, as it is the case for most
countries when the demand is high and the gas is scarce, maximum storage capacities are
taken as a basis. For LNG facilities, it is assumed that maximum capacities are used
throughout the year, which is a situation likely to happen in a long disruption from a certain
source, such as an N-1 situation. An alternative approach could be taking the tank
capacities of the LNG terminals into consideration, which would be less than fair to these
facilities, since their storage capacities are negligible when compared to underground
storage and assuming that they will be utilised once throughout the year is by no means
realistic.
300%
8,2%
250% 18,5%
200%
150%
259%
234%
100% 28%
8%
50% 29% 85% 27%
5,5% 78%
20,4% 24% 29% 26% 35% 37%
0%
LNG terminal capacity/annual consumption (%) Storage capacity/annual consumption (%)
When comparing the annual send-out and withdrawal capacities of the countries with
annual demands, it can be seen that countries with LNG infrastructure, Portugal and Spain,
can meet more than twice their annual demands assuming maximum LNG send-out
throughout the year. We see that France not only can meet its annual demand with
underground and LNG send out capacities, but also has a 28% underground storage/annual
demand ratio, second among the MEDREG countries to only Italy, which has a 29%
storage/annual demand.
Although having no LNG facilities, Croatia has an adequate underground storage capacity,
meeting 20% of its annual demand. Spain, besides its LNG facilities that can double its
annual demand, can meet 18,5% of the annual demand with underground storage
withdrawal. Portugal, which has the highest LNG send-out/consumption ratio and Turkey,
which is carrying out projects that will increase its storage and LNG capacities considerably
in the upcoming years, have less than 10% storage/consumption ratios. This comparison
could be made by comparing the underground storage capacities and LNG send-out
capacities during the winter with the winter demand for another point of view, but further
data is needed to be collected for such a study, since seasonal consumption statistics are
not present.
12Ref: MED17-24GA -5.4.2
Gas Infrastructure Map of the Mediterranean region
4. Final Remarks
The study on Gas Infrastructure Map of the Mediterranean Region is an important and
hopefully beneficial one, which has the potential to provide an insight to regulators and
other decision makers. This report not only provides valuable data that can be used to
examine the characteristics of the natural gas infrastructures of the contributing countries,
but also makes it possible to better understand what the expectations, aims and motives of
the Mediterranean countries are when making an infrastructure investment. These aims and
motives reported by the countries, such as increasing security of supply, providing market
security and diversifying natural gas sources or routes, may pave the way for better
communication and cooperation between the neighbouring countries.
This research, which evaluates the data collected from the contributing countries for the
period 2014-2016 and utilises it according to availability, can be regarded as a preliminary
work, and may be repeated when more accurate and up-to-date data is present, since the
recent years witnessed considerable developments with regards to infrastructure
investments, particularly LNG terminals and FRSUs, as well as the fluctuations in the
demand structures. A point to note for the further studies is that the data required and the
way inputs shall be sent may be defined more clearly in order to have the answers and the
data sent more standardised among the contributing countries.
13Ref: MED17-24GA -5.4.2
Gas Infrastructure Map of the Mediterranean region
5. APPENDIX
1- Existing interconnection infrastructure
Country Name of the facility Operating Year Connected Sort of capacity Capacity (bcm/year) Access Conditions: Transmission
country (Entry/exit/bilateral) rTPA or nTPA pipeline (km)
Albania National Grid (TSO+DSO) 1967;1980;1985 Interial Bilateral 1 400 km
Croatia Plinacro Ltd 2693 km
Egypt Al Arish-Taba-Aqaba July 2003 From EL Arish in 10 bcm nTPA 264 km
(Arab Gas Pipeline) EGYPT to Aqaba
Jordan
Arab Gas Pipeline
January 2006 From Aqaba in
Jordan to EL- 10 bcm nTPA 393 km
Rehab
Arab Gas Pipeline
2007 From EL-Rehab in
Jordan to the
Jordan-Syria 30 km
border 10 bcm nTPA
Arab Gas Pipeline
2008 From Jordan-Siria
border to AL 317 km
Rayan in Syria nTPA
EMG Pipeline 10 bcm
Arish in Egypt to 100 km
2008 Ashkelon in Israel
7 bcm nTPA
Greece Transbalkan (Kulata-Sidirokastro 1996 Bulgaria Entry / Bilateral 3.5 bcm / rTPA 0
Interconnection Point) Reverse 0.36 bcm
Kipi Interconnection Point 2007 Turkey Entry 1.4 bcm 1.4 bcm 0
France Oltingue 2018 Switzerland Entry (Exit capacity was 3,7 rTPA 0
already existing)
Italy Transgreen 1978 Italy, Algeria Entry Algeria-Exit Italy 30 bcm nTPA 2200 km
Green Stream 2004 Italy, - Entry Libya-Exit Italy 8 bcm nTPA 520 km
Libya
TAG 107 m3/d rTPA
TRANSITGAS 59 m3/d rTPA
TTPC 95.9 m3/d nTPA
14Ref: MED17-24GA -5.4.2
Gas Infrastructure Map of the Mediterranean region
Panigaglia LNG nTPA
Adriatica LNG 2010 Exemption 2nd
Pacage
Livorno LNG 2015 rTPA
Storage Stogit, Edison scc. 2010 rTPA
Sorage Cornegliano 2014 rTPA
Jordan Arab Gas pipeline Project / 2006 Egypt-Jordan Bilateral 10 nTPA 423
second phase
Arab Gas pipeline Project / 2008 Egypt-Syria Bilateral 10 nTPA 423
second phase
Alshaikh Subah LNG Terminal at 2015 nTPA 423
Aqaba LNG
Portugal Campo Maior 1997 Spain Entry 0,47 rTPA 220
Campo Maior 1997 Spain Exit 0,1225 rTPA 220
Valença do Minho 1998 Spain Entry 0,105 rTPA 74
Valença do Minho 1998 Spain Exit 0,0875 rTPA 74
Spain Larrau 1993 Spain-France Bilateral 165 GWh/day rTPA
Larrau 1993 France-Spain Bilateral 165 GWh/day rTPA
Irún 2006 Spain-France Bilateral 5 (winter) /9 (summer) rTPA
GWh/day
Irún 2006 France-Spain Bilateral 0 (winter) / 10 rTPA
(summer) GWh/day
Tarifa 1996 Morocco-Spain Entry 444 GWh/day rTPA
Almería 2011 Algeria-Spain Entry 266 GWh/day rTPA
Badajoz 1996 Spain-Portugal Bilateral 134 GWh/day rTPA
Badajoz 1996 Portugal-Spain Bilateral 35 (winter) /70 rTPA
(summer) GWh/day
Tuy 1998 Spain-Portugal Bilateral 30 (winter) /40 rTPA
(summer) GWh/day
Tuy 1998 Portugal-Spain Bilateral 25 GWh/day rTPA
Turkey Malkoclar 1986 Russia Entry 14 bcm/year rTPA 842 km
(Western Line)
2001 Iran Entry 9,6 bcm/year rTPA 1491 km
Gurbulak
2003 Russia Entry 16 bcm/year rTPA 1261 km
Durusu
(Blue Stream) 2006 Azerbaijan Entry 6,6 bcm/year rTPA 113 km
15Ref: MED17-24GA -5.4.2
Gas Infrastructure Map of the Mediterranean region
Turkgozu 2007 Greece Exit 0.7 bcm/year rTPA 296 km
Kipi
16Ref: MED17-24GA -5.4.2
Gas Infrastructure Map of the Mediterranean region
2- Existing natural gas storage/lng terminal projects
Country Name of the facility Operating Year Capacity Access Conditions: Transmission
rTPA or nTPA pipeline (km)
Send-out / Withdrawal (mm3/day) Injection Tank (bcm)
(mm3/day)
Albania N/A
Croatia Okoli / Podzemno skladište
plina d.o.o.
Egypt Hoegh Gallant April 2015 Capacity 5 bcm/year 170,000 m3 nTPA 6 km with 32 inc
FSRU ‘’FSRU-1’’ Send-out/Withdrawal rate: 14.16 LNG = 0.12
mm3/day (NG) bcm (NG)
BW Singapore Capacity 6 bcm/year 170.000 m3
FSRU ‘’FSRU-2’’ LNG = 0.12
November 2015 Send-out/Withdrawal rate: 17 bcm (NG) 300 meters of
mm3/day (NG) nTPA pipeline 24 inc.
connecting with
the above
transmission
pipeline
Greece LNG terminal in Revithoussa 2000 12.47 rTPA LNG terminal in
Revithoussa
Jordan Alshaikh Subah LNG Terminal 2015 490 MMSCF/D- Storage 160000 m3 nTPA 423 Alshaikh Subah LNG 2015
at Aqaba FSRU Terminal at Aqaba
FSRU
Italy Panigaglia LNG 2000 13 rTPA 200
Exemption as 2
Adriatica LNG 2010 26.4 Energy Pacage
rTPA
Livorno LNG 2015 15
rTPA
Storage Strogit, Edison, scc 2010 16 bcm
Storage Cornegliano 2014 16.6 rTPA
Malta FSU and regasification plant 2016 Discharge flow rate nominal 75840 125.000 m3 rTPA n/a
Nm3/hr (gas)
PCI code:LNG-N-211
17Ref: MED17-24GA -5.4.2
Gas Infrastructure Map of the Mediterranean region
Connection of Malta to the 2031 5.5 mcm/day 180.000 m3 rTPA 12 km from
European Gas Network-LNG offshore FSRU
Regasification infrastructure to Malta; 155 km
from Malta to
Sicily
Portugal Sines (LNG terminal) 2003 27,0 (NG) 0,24 (LNG) 0,39 (LNG) rTPA NA
Carriço (Storage) 2005 7,2 2,0 322,6 rTPA NA
Spain Barcelona (LNG) 1969 46800 (send-out)/0.00076 (tank) rTPA Barcelona(LNG) 1969
Huelva (LNG) 1988 32400(send-out)/0.0006195(tank) rTPA Huelva (LNG) 1988
Bilbao (LNG) 2003 19200 (send-out)/0.00045 (tank) rTPA Bilbao (LNG) 2003
Cartagena (LNG) 1989 32400(send-out)/0.000587 (tank) rTPA Cartagena(LNG) 1989
Mugardos (LNG) 2007 9907.2 (send-out)/0.0003 (tank) rTPA Mugardos LNG) 2007
Segunto (LNG) 2006 24000 (send-out)/0.0006 (tank) rTPA Segunto (LNG) 2006
Gaviota 1996 5700/4500/0.980 rTPA Gaviota 1996
Serrablo 1988 6800/3800/0.680 rTPA Serrablo 1988
Yela 2012 15000/10000/1.05 rTPA Yela 2012
Marismas 2012 400/400/0.062 rTPA Marismas 2012
Turkey BOTAS Silivri 2007 25 mm3/day 16 mm3/day 2.8 bcm rTPA
Underground Storage
1994 22,5 mm3/day 151 mm3/day 0.153 bcm rTPA
BOTAS Marmara 8.2 bcm/year
LNG Terminal 81 mm3/day 0.168 bcm rTPA
1998 16,44 mm3/day
EGEGAZ Aliaga 6 bcm/year
LNG Terminal
3 - INVESTMENT PLANS
Country Time span of the investment plans Period of investment plans
Albania 2016 8
Croatia 10
Italy 2020 10
Malta 2026
Portugal 10
Spain 2016 8
18Ref: MED17-24GA -5.4.2
Gas Infrastructure Map of the Mediterranean region
4 - Projected investments interconnection and storage
Country Name of Project Project The phase of Estimated Connected country Sort of cap- Target Access Required
Project Type type: New the project: operation year acity: Entry; Capacity Conditions: Transmis
(Interconnection/LNG) or Planning; Exit; Capacity rTPA sion
Upgrade Preliminary; Bilateral Increase or nTPA pipeline
Construction (bcm/year (km)
)
Albania TAP New 2015 2020 Entry / Exit 10-20 870
Interconnection
IAP New Nd nd 516
Interconnection
Fier Upgrade Nd Nd Entry / Exit 8-12
LNG Regasification
Croatia Lučko-Zabok-Rogatec New Preliminary 2018 Croatia - Slovenia Entry / Exit 5,547 rTPA 77
(HR/SLO) + compressor
stations
Interconnection
LNG evacuation pipeline New Preliminary 2020 Croatia - Hungary Entry / Exit 16,716 rTPA 198
Omišalj-Zlobin-Bosiljevo-
Sisak-Kozarac - PHASE I
(HR/HU)
LNG evacuation pipeline New Planning 2023 Croatia - Hungary 7,788 rTPA 128
Kozarac-Slobodnica -
PHASE II (HR/HU)
Peak storage facility New Preliminary 2021 5,520 - rTPA
Grubišno Polje (1st phase-floating
terminal)
LNG Terminal on island New Preliminary 2018 9,600 - 150.000 rTPA
Krk (1st phase- (2nd phase- onshore m3
floating terminal) LNG (2nd
terminal) phase)
2023
(2nd phase-
onshore
terminal)
Cyprus East-Med pipeline (The New 2020 (3Q) Greece The pipeline The main Nd 1900km (1400
project is included in the will have an flow of the km offshore,
PCI list-code 7.3.1.) estimated pipeline 500 km onshore
capacity of westbound
450 GWh/day will have
19Ref: MED17-24GA -5.4.2
Gas Infrastructure Map of the Mediterranean region
with delivery an annual
capacity of 30 foreseen
GWh/day to capacity in
Cyprus and the range
420 GWh/day of
to Greece. approximat
Power of the ely 7-15
compressor bcm/year
320 MW.
Cyprusgas 2EU Renaming of Preliminary 2022 Not decided Yes (Landing in
Mediterrane studies yet Vasilikos area,
an Gas (Prefeasibility/Fe south of
Storage asibility Studies) Cyprus)
Egypt Cyprus Pipeline New PL Planning 2020 Aphrodite in Cyprus to 7 bcm nTPA 340 km
Idku in Egypt
Total nTPA 5.5 km with 32
FRSU-3 New Q2-2017 2017 storage in
capacity:1
70.000 m3
LNG=0.12
bcm (NG)
Send-
out/Withdr
awal
rate:21
mm3/day
(NG)
France STEP New Under study, not Not decided Spain Interruptible F→S: 3,0 rTPA 224km (120 km
decided bilateral in France)
S→F: 4,5
MidCat New Under study, not Not decided Spain Firm bilateral F→S: 3,0 rTPA >320km (in
decided France)
S→F: 4,5
Greece Trans Adriatic Pipeline New Design and 2020 Greece, Albania, Italy Entry-Exit plus 10 bcm/y Exemption as 878 km
(TAP) permitting, FID Reverse-Flow up to 20 for Directive
bcm/y 2009/73/CE
Interconnection Greece – New Permitting 2020 Greece, Bulgaria Entry-Exit plus up to applied for 182 km
Bulgaria (IGB) Reverse-Flow 3bcm/y, up exemption,
to 5bcm/y not yet
(2nd phase) granted
20Ref: MED17-24GA -5.4.2
Gas Infrastructure Map of the Mediterranean region
ITGI - POSEIDON New Permitting 2020 Italy- Greece Entry-Exit plus 8 bcm/y Exemption as 216 km
Reverse-Flow for 2° Energy
Package
EastMed Pipeline New Planned 2022 Greece, Cyprus Up to 16 1900 km
bcm/y
Revithoussa LNG Terminal Upgrade Under 2018 Revithoussa Upgrade
(2nd upgrade) engineering- LNG
procurement- Terminal
construction (2nd
upgrade)
FSRU in Northern Greece New Permitting 2020 FSRU in New
(Alexandroupolis) completed Northern
Greece
(Alexandroup
olis)
Jordan Alshaikh Subah LNG New Nd Nd rTPA 423
Terminal at Aqaba
LNG
Israel Sodom- Jordan (North New planning Israel-Jordan exit 3 bcm 22.7
Jordan)
Palestinian Authority New preliminary Israel-PA exit 0.5 bcm
Sodom- Jordan (North New planning Israel-Jordan exit 3 bcm 22.7
Jordan)
Italy GALSI New Planning 2020 Italy-Algeria Entry Algeria- 8 Regulated 861
Interconnection Exit Italy
TAP New Planning 2020 Albania, Greece, Italy Entry-Exit plus 10-20 Exemption as 870
Interconnection Reverse Flow for Directive
2009/73/CE
ITGI-POSEIDON New Planning 2020 Italy-Greece Entry-Exit plus 8 Exemption as 207
Interconnection Reverse Flow for 2nd
Energy
Package
LNG Falconara New Planning 2020 19.8
mm3/day
LNG Porto Empedocle New Planning 2020 26.4
mm3/day
LNG Gioia Tauuro New Planning 2020 39.6
mm3/day
LNG Zaule New Planning 2025 26.4
mm3/day
LNG Monfalcone New Planning 2025 800mcm/y
LNG Trieste New Planning 2025 8 bcm/y
21Ref: MED17-24GA -5.4.2
Gas Infrastructure Map of the Mediterranean region
Malta PCI Code TRA-N-031 New 2026 2018 Malta-Italy The pipeline Entry rTPA 155 km
Connection of Malta to the will be (Italy-to-
European Gas Network- designed for Malta
Pipelines bilateral direction):
capacity but 2bcm/year
initially it will (in 2026)
be operated in Exit
the Italy-to- (Malta-to-
Malta flow Italy
direction direction):
2bcm/year
(in 2031)
FSU and regasification New Construction 2016 12 bcm/y rTPA
plant
PCI Code:LNG-N-211 New Planning 2031 Nd rTPA 12 km from
Connection of Malta to the offshore FSRU
European Gas Network- to Malta; 155km
LNG regasification from Malta to
Sicily
Portugal 3rd Interconnection Point New Planning 2024 Spain Entry 2,6 rTPA 247
3rd Interconnection Point New Planning 2024 Spain Exit 2,1 rTPA 247
Spain MIDCAT New PCI Spain-France Bilateral 7,2 bcm rTPA 25 Km in Spain
Interconnection (preliminary) (S-F)/ 2,5
(F-S)
Portugal New PCI Spain-Portugal Bilateral 4,5 bcm rTPA 85 Km in Spain
Interconnection (preliminary) (both)
El Musel (LNG) New Finished Mothballed 0.0003 rTPA
Bilbao (LNG) Upgrade Planning 2014 rTPA
(delayed)
Tenerife (LNG) New Planning 2015 0.000150 rTPA
(delayed)
Gran Canaria (LNG) New Planning 2016 0.000150 rTPA
(delayed)
Turkey BOTAS Silivri Underground Upgrade Construction 2020 Send-out/Withdrawal, 40 rTPA BOTAS Silivri Upgrade
Storage mm3/day Underground
Storage
Injection, 40 mm3/day
BOTAS Tuz Golu Tank/reservoir, 4.3 bcm
BOTAS Tuz
22Ref: MED17-24GA -5.4.2
Gas Infrastructure Map of the Mediterranean region
Underground Storage New Construction 2017 Send-out/Withdrawal ,40 rTPA Golu New
mm3/day Underground
2020 Storage
Injection, 40 mm3/day
Tank/reservoir, 0,5bcm,
1 bcm
EGEGAZ Aliaga LNG Upgrade Construction 2016 Upgrade
Terminal
2017 Send-out/Withdrawal, 24 rTPA EGEGAZ
mm3/day, 30 Aliaga LNG
mm3/day,40 mm3/day Terminal
Injection, 81 mm3/day
Tank/Reservoir, 0,168
bcm
New Construction 2016 rTPA New
Etki Liman FSRU Terminal
Send-out/Withdrawal, 14
mm3/day Etki Liman
FSRU
Injection, 86 mm3/day Terminal
Tank/reservoir, 0,084
bcm
23Ref: MED17-24GA -5.4.2
Gas Infrastructure Map of the Mediterranean region
5- The expected benefits and impact of each project listed, on security of supply (e.g. route and/or source
diversification, emergency role, N-1 condition), market development (e.g. reduction of congestions, entry of new
suppliers) and regional market integration.
Country Name of the facility Security of Supply Market development Regional Market Integration
Albania N/A
Croatia Interconnection pipeline Project will enable route Project will reduce bottlenecks at Project will enable supply of LNG
diversification and will increase N-1 Croatia/Slovenia border and in Croatia from Adriaic coast to expected
Lucko-Zabok-Rogatec criteria for security of supply in gas system which will enable full LNG markets:Slovenia, Austria
(HR/SLO)+compressor station Croatia and Slovenia entry/exit capacity of Dravaszerdahely and Slovakia. It will also provide
interconnection point at Croatia/hangar enhanced access to Baumgarten
border and Italian gas market
Project will enable route
LNG evacuation pipeline Project will enable route diversification and will improve
Project will create new transit route for remaining flexibility for Croatia,
Omisalj-Zlobin-Bosiljevo-Sisak- diversification and will increase N-1 LNG supply in Croatia and for
Kozarac-PHASE I (HR/HU) criteria for security of supply in Slovenia and hungary.
neighbouring countries. It will also reduce
Croatia and Hungary possible future bottlenecks.
LNG evacuation pipeline
Kozarac-Slobodnica-PHASE
II(HR/HU)
Project will significantly increase
Project will increase N-1 criteria for remaining flexibility in Croatia
Additional mid and and short term with influence on Slovenia and
Peak storage facility Grubsino security of supply in Croatia services will be offered to users which will
Polje Hungary.
consequently attract new shippers and
support further development of Croatian Project will enable supply of LNG
and regional gas market. from Adriatic coast to expected
LNG Terminal on Island Krk Project will enable source LNG markets: Croatia, Slovenia,
Project will create new LNG supply hungary, Austria, Serbia, Bosnia
diversification and will increase source for south-eastern and central
security of supply in Croatia and and Herzegovina, Slovakia and
European countries. It will also reduce Czech republic. Additional
Hungary. possible future bottlenecks. potential markets are:
Italy,Ukraine, Romania and
Bulgaria. It will also improve
remaining flexibility for Croatia,
Slovenia and hungary.
24Ref: MED17-24GA -5.4.2
Gas Infrastructure Map of the Mediterranean region
Ast-Med pipeline Security of Gas Supply to Cyprus End Cyprus and Crete nergy isolation Connect Eastern Mediterranean
Cyprus
countries with Europe
Security of Gas Supply to Cyprus End Cyprus and Crete energy isolation Connect Eastern Mediterranean
CyprusGas2EU countries with Europe
FSRU-1 Emergency role to cover the gap Cover the hight consumption of the
Egypt
between the supply & demand power generation plant
Emergency role to cover the gap
between the supply & demand
FSRU-2 Cover the hight consumption of the
Could be used in the reverse power generation plant
direction to secure some of the
domestic consumption
Arab Gas PL To export gas to Jordan
Emergency role to cover the new To export gas to Israel
EMG PL demand of the New Capital’s power
generation plant
FSRU-3 Cover the consumption of the New
Could be used to cover part of the Capital’s power generation plant
domestic consumption
Cyprus pipeline The gas will be processed and
liquefied in one the Egyptian LNG
facilities
Oltingue source diversification Implementation of bilateral
France
capacities
LNG terminal in Revithoussa According to the Preventive Action As the capacity of the two pipeline entries
Greece
Plan, Revithoussa is the largest to Greece was fully booked upstream,
infrastructure in terms of capacity. LNG cargoes to Revithoussa were, until
During the 2009 crisis, LNG from recently, the only way of entry of new
Revithoussa was driven, through suppliers (in 2011-2012 when LNG prices
reverse flow, to Bulgaria to cover were favourable, the incumbent had lost
vulnerable customers demand 12% of its market share via LNG spot
there. cargoes). Today some competition is
developing at the Bulgarian entry point,
however, the importance of the LNG
terminal remains crucial.
25Ref: MED17-24GA -5.4.2
Gas Infrastructure Map of the Mediterranean region
TAP TAP will be crucial for the
integration of the regional market,
linking Turkish and Greek to the
Italian gas market and thus the
rest of Europe.
IGB IGB will mainly be important for the It is expected to help the development of
SoS of Bulgaria, as its nominal flow the greek market, opening the route to
Greece to Bulgaria the North
(Bulgaria, Romania, Ukraine)
EastMed Pipeline It will add one more source of It will integrate the middle-eastern
supply. However, its impact has not to the greek and then European
been studied yet in the Risk market.
Assessment study.
Panigaglia LNG 200 13 rTPA
Italy
Adratica LNG 2010 26,4 Exemption as 2° Energy Package
Livorno LNG 2015 15 rTPA
Storage Stogit, Edison, scc. 2010 rTPA
16 bcm
Storage Cornegliano 2014 16,6 rTPA
FSU and regasification plant Energy in Malta is currently supplier The Malta LNG to Power Project shall
Malta
by fossil fuels with a minor introduce natural gas as a fuel source to
contribution from renewable energy. Malta’s electricity generation industry and
The new gas infrastructure is shall be the sole supply of natural gas to
expected to strongly contribute to the power station
security of supply by providing a
new vehicle for energy supply. The
project is expected to result in a
more reliable, secure and energy
efficient from of energy
The infrastructure is expected to
PCI Code TRA-N-031 strongly contribute to security of
Connection of Malta to the supply by providing a new vehicle The project will end Malta's isolation from
European Gas Network- for energy supply. The project is the Trans-European gas network and
Pipelines expected to result in a more reliable, thus contribute to gas market integration
secure and energy efficient form of and improved security of energy supply
transport of fuel. and diversification of fuels for the island.
The pipeline is expected to provide The project is expected to support
for diversification of energy sources, objectives of sustainability as it will The pipeline can be expected to
will facilitate the formulation and contribute towards the reduction of GHG provide for more flexible market
26Ref: MED17-24GA -5.4.2
Gas Infrastructure Map of the Mediterranean region
implementation of preventive and emissions whilst also acting as a back-up arrangements by, at the very
emergency action plans, is a more for renewable energy. It will contribute least, introducing a competing
reliable, secure and energy efficient towards diversification of imported form of transport. Furthermore
form of transport of fuel, and is in sources. In Malta, it will provide access to price convergence to the Italian
itself a short term storage facility as a potentially lower cost fuel for both Market price is expected once the
compressed gas contained in the power generation and the inland market gas pipeline is in service.
pipeline may be used in case that thereby improving competitiveness and The gas pipeline interconnection
the gas flow is interrupted at the affordability. will eliminate Malta’s isolation
terminal point in the supplying from the European Gas Network
infrastructure and will thus contribute to the
integration of the Internal Energy
Market. The physical
interconnection would replace the
shipping of LNG, time of transport
and externality costs. The project
will also contribute to the overall
The ‘LNG infrastructure’ component flexibility and interoperability of
besides meeting Malta’s natural gas the system as it will offer future
requirements including future possibility of capacity for reverse
demand for maritime LNG Energy demand will be increasing over flows
bunkering; shall also achieve the time and as LNG bunkering comes into
PCI Code LNG-N-211 gas N-1 infrastructure requirement with the establishment of criteria for the
as there would be two sources of use by liquefied natural gas carriers of
Connection of Malta to the natural gas supply to Malta and technological methods as an alternative
European Gas Network-LNG shall provide for the possibility to to using low sulphur marine fuels in line
regasification Infrastructure export gas to Italy/Europe. This will with the sulphur reduction requirements
enhance competition in Italy. The of the EU Sulphur Directive 2012/33/EU.
main project driver for this It is forecasted that bunkering will by This project is expected to
component of the PCI is the Gas 2054 account for about 80% of the total support the objective of
Security of Supply EU Regulation primary energy demand of the Maltese sustainability as it will contribute
No. 994/2010. This second phase of Islands. This therefore has a potentially towards the reduction of GHG
the PCI will contribute to the overall stronger element of fuel demand emissions. The LNG component
system flexibility and associated with maritime bunkering will also complement the
interoperability. The infrastructure activity centred in and around Malta, provisions of Directive
will be capable to offer capacity for which already serves as a key bunkering 2014/94/EU and the Energy
bi-directional flow through the gas hub within the Mediterranean, and will Union diversification strategy in
pipeline interconnector. play a key role in the implementation of fuel by the added entry point of
EU goals towards the supply of NG fuel natural gas to the EU i.e.
for the purposes of shipping activities in effectively contributing towards
the future. This serves as a basis for the the diversification of sources,
quantification of the demand for the routes and suppliers of gas to the
project itself, it informs the optimal choice EU.
between alternative options for its
27Ref: MED17-24GA -5.4.2
Gas Infrastructure Map of the Mediterranean region
implementation, furthermore serving to
quantify economic benefits under each of
the five dimensions to be served by the
PCI listed above.
Portugal Campo Maior Yes Yes Yes
Valença do Minho Yes No No
Sines (LNG terminal) Yes Yes Yes
Carriço (Storage) Yes Yes Yes
Spain MIDCAT Route and source of diversification Liquidity for the Iberian market Creation of the European internal
for Europe (alternative to Russian market
gas for central Europe)
Diversification (for Portugal)
Portugal Creation of the European internal
Diversification, N-1 condition market
Musel
Supply of gas in isolated system
Tenerife (Canary Islands)
Supply of gas in isolated system
(Canary islands)
Gran Canaria
Turkey Malkoclar (Western Line) Only interconnection point Entry of new suppliers
That private companies have
contracts
Gurbulak Source and route
Diversification, N-1 condition
Durusu Route diversification, N-1
(Blue Stream) Condition
Source and route
Turkgozu Diversification, N-1 condition
Source and route diversification
And N-1 condition with the Entry of new suppliers with the possible Only current exit to European
Possible investments for bilateral investments for bilateral flow markets
Kipi flow
Emergency role, seasonal storage
BOTAS Silivri Underground
Storage Source and route diversification, N-
1 condition
28Ref: MED17-24GA -5.4.2
Gas Infrastructure Map of the Mediterranean region
BOTAS Marmara LNG Terminal Entry of new suppliers
Source and route diversification, N-
EGEGAZ Aliaga LNG Terminal 1 condition
Entry of new suppliers
BOTAS Silivri Underground Emergency role, seasonal storage
Storage
Emergency role, seasonal storage Provide flexibility to market players
BOTAS Tuz Golu Underground
Storage Source and route diversification, N-
1 condition
EGEGAZ Aliaga LNG Terminal Source and route diversification, N- Provide flexibility to market players
1 condition
Etki Liman FSRU Terminal
Entry of new suppliers
Entry of new suppliers
6- The role of national regulatory agency in the overall investment plan
Country Approval of investment plan by Government sets investment plan and consults
NRA NRA
Albania x
Croatia x
Cyprus x
France x
Greece x
Israel x
Italy x
Jordan x
Portugal x
Spain x
29Ref: MED17-24GA -5.4.2
Gas Infrastructure Map of the Mediterranean region
7 - Implementation barriers
Implementation Barriers Albania Cyprus Croatia Egypt France Greece Jordan Israel Italy Malta Portugal Spain Turkey
a. Regulatory and/or 8 2 5 1 8 1 1 4 8 5
legal obstacles (ex.
administration,
permitting, licencing,
etc….)
b. Lack of interest in 8 6 3 7 8 8 5 2 8
interconnection
projects (ex. Inter-
Governmental
agreements)
c. Technical barriers 8 3 4 6 3 8 3 7 6
d. Financial feasibility 3 1 2 5 2 1 4 x 1 8 2
of the project (e.g.
adequate revenues)
e. Insufficient market 3 8 1 8 1 2 1 2 2 1 1* 1
demand
f. Lack of internal 3 7 7 2 8 3 4 6 8 4
reforms
g. Political instability 8 5 8 3 8 5 8 3 8 3
and/or lack of clear
institutional
framework (including
geopolitical barriers)
h. Lack of coordination 8 7 8 4 8 7 6 7 4
and/or cooperation
(ex. between TSOs,
between TSOs and
Regulators)
30Ref: MED17-24GA -5.4.2
Gas Infrastructure Map of the Mediterranean region
8 - Infrastructure key performance indicators
2014 2015 2016 (planned/forecast)
Number of TSOs 1 1 1
Pipeline length (km) 2.694 2.694 -
Pipeline pressure (bar) 50 bar; 75 bar 50 bar; 75 bar 50 bar; 75 bar
Annual consumption (bcm) 2,627 2,745 -
Seasonal demand swing (%) - - -
Croatia Daily peak demand (mcm) 12,545 11,779 -
Length of pipeline/consumption (km/bcm) 1.025,45 981,46 -
Storage capacity/consumption (%) 20,40 19,34 -
LNG terminal capacity/consumption (%) - - -
LNG + storage daily send out / peak demand (%) 41,3 40,5 -
Number of entry zones 1 1 1
Number of exit zones 1 1 1
Number of compressor stations 0 0 0
Pipeline length / # compressor stations - - -
2014 2015 2016 (planned/forecast)
Number of TSOs - - -
Pipeline length (km) - - -
Pipeline pressure (bar) - - -
Annual consumption (bcm) - - -
Seasonal demand swing (%) - - -
Cyprus Daily peak demand (mcm) - - -
Length of pipeline/consumption (km/bcm) - - -
Storage capacity/consumption (%) - - -
LNG terminal capacity/consumption (%) - - -
LNG + storage daily send out / peak demand (%) - - -
Number of entry zones - - -
Number of exit zones - - -
Number of compressor stations - - -
Pipeline length / # compressor stations - - -
31Ref: MED17-24GA -5.4.2
Gas Infrastructure Map of the Mediterranean region
2014 2015 2016 (planned/forecast)
Number of TSOs 1 1 1
Pipeline length (km) 7667 7872 8000
Pipeline pressure (bar) 7-70 bar 7-70 bar 7-70 bar
Annual consumption (bcm) 48.019 47.812 51.627
Seasonal demand swing (%) 20 20 20
Daily peak demand (mcm) 130 136 151
Length of pipeline/consumption (km/bcm) 59 58 53
Egypt Storage capacity/consumption (%)
LNG terminal capacity/consumption (%)
LNG + storage daily send out / peak demand (%) 1000 1300
Number of entry zones 20 21 22
Number of exit zones 607 607 607
Number of compressor stations 1 1 1
Pipeline length / # compressor stations 7667 7872 8000
2014 2015 2016 (planned/forecast)
Number of TSOs 1 1 1
Pipeline length (km) 423 423 423
Pipeline pressure (bar) Up to 80 Bars Up to 80 Bars Up to 80 Bars
Annual consumption (bcm) 3.4
Seasonal demand swing (%) - - -
Jordan Daily peak demand (mcm) 25 MMSCF/D 200 MMSCF/D 444 MMSCF/D
Length of pipeline/consumption (km/bcm) - - -
Storage capacity/consumption (%) - - -
LNG terminal capacity/consumption (%) - - -
LNG + storage daily send out / peak demand (%) - 490 MMSCF/D 490 MMSCF/D
Number of entry zones - - -
Number of exit zones - - -
Number of compressor stations - - -
Pipeline length / # compressor stations 423/1 compressor st. 423/1 compressor st. 423/1 compressor st.
32Ref: MED17-24GA -5.4.2
Gas Infrastructure Map of the Mediterranean region
2014 2015 2016 (planned/forecast)
Number of TSOS 1 1 1
Pipeline length (km) 1459.33 1466.17 1492.47
Pipeline pressure 70 bar 70 bar 70 bar
Annual consumption (bcm) 2.99 3.26 3.4
Seasonal demand swing (%) 65% 65%
Daily peak demand (mcm)
Length of pipeline/consumption (km/bcm) 488.07 449.75 438.96
Greece
Storage capacity/consumption (%)
LNG terminal capacity/consumption (%) 167% 153% 154%
LNG + storage daily send out / peak demand (%) 68.25% 63%
Number of entry zones 3 3 3
Number of exit zones 3 (39 exit point) 3 (41 exit point) 3
Number of compressor stations 1 1 1
Pipeline length / # compressor stations 1459.33 1466.17 1492.47
2014 2015 2016 (planned/forecast)
Number of TSOS 2 2 2
Pipeline length (km) around 37 000 km around 37 000 km around 37 000 km
Pipeline pressure 16 to 95 bar 16 to 95 bar 16 to 95 bar
Annual consumption (bcm) 36,2 38,9 42,6
Seasonal demand swing (%)
Daily peak demand (mcm)
Length of pipeline/consumption (km/bcm)
France
Storage capacity/consumption (%) ~28% ~28% ~28%
LNG terminal capacity/consumption (%) ~85% ~85% ~85%
LNG + storage daily send out / peak demand (%)
Number of entry zones 2 2 2
Number of exit zones 2 2 2
Number of compressor stations
Pipeline length / # compressor stations
33Ref: MED17-24GA -5.4.2
Gas Infrastructure Map of the Mediterranean region
2014 2015 2016 (planned/forecast)
Number of TSOs 1 1 1
Pipeline length (km) 530
Pipeline pressure (bar)
Annual consumption (bcm) 7.5 8.4 9.4
Seasonal demand swing (%)
Daily peak demand (mcm) 27.335 37,101
Length of pipeline/consumption (km/bcm)
Storage capacity/consumption (%)
Israel
LNG terminal capacity/consumption (%)
LNG + storage daily send out / peak demand (%)
Number of entry zones
Number of exit zones
Number of compressor stations
Pipeline length / # compressor stations
2014 2015 2016 (planned/forecast)
Number of TSOs 10 10 10
Pipeline length (km) 32339 34857
Pipeline pressure 24-75 bar
Annual consumption (bcm) 61.9 67.5
Seasonal demand swing (%)
Daily peak demand (mcm)
Italy
Length of pipeline/consumption (km/bcm)
Storage capacity/consumption (%)
LNG terminal capacity/consumption (%)
LNG + storage daily send out / peak demand (%)
Number of entry zones*
Number of exit zones*
34Ref: MED17-24GA -5.4.2
Gas Infrastructure Map of the Mediterranean region
Number of compressor stations
Pipeline length / # compressor stations
2014 2015 2016 (planned/forecast)
Number of TSOs 0 0 0
Pipeline length (km) 0 0 0
Pipeline pressure (bar) N/A N/A N/A
Annual consumption (bcm) N/A N/A 4.4838
Seasonal demand swing (%) N/A N/A N/A
Daily peak demand (mcm) N/A N/A N/A
Malta Length of pipeline/consumption (km/bcm) N/A N/A N/A
Storage capacity/consumption (%) N/A N/A N/A
LNG terminal capacity/consumption (%) N/A N/A 0.03%
LNG + storage daily send out / peak demand (%) N/A N/A N/A
Number of entry zones N/A N/A
Number of exit zones N/A N/A
Number of compressor stations N/A N/A N/A
Pipeline length / # compressor stations N/A N/A N/A
2014 2015 2016 (planned/forecast)
Number of TSOs 1 1 1
Pipeline length (km) 1375 1375 1375
Pipeline pressure (bar) 70 70 70
Annual consumption (bcm) 3,8 4,4 NA (Non Available)
Portugal Seasonal demand swing (%) 0,43 0,47 NA
Daily peak demand (mcm) 15,5 17,4 NA
Length of pipeline/consumption (km/bcm) 361,8 312,5 NA
Storage capacity/consumption (%) 8,2 7,6 NA
LNG terminal capacity/consumption (%) 5,9 5,1 NA
LNG + storage daily send out / peak demand (%) 174,2 155,2 NA
Number of entry zones 1 1 1
35You can also read