Gas Market Report - Australian Energy ...
←
→
Page content transcription
If your browser does not render page correctly, please read the page content below
Gas Market Report

13 – 19 June 2021
Weekly Summary
Average market prices continued to increase across the east coast, rising from mid-week.
This follows prices climbing above $8/GJ in the short term trading markets (STTMs) from the
start of the month. In Victoria, cold weather drove up demand alongside a significant
increase to gas powered generation requirements from the previous week.1 Demand in the
STTMs remained relatively stable, reducing slightly in Adelaide.

Upstream gas generation demand in South Australia combined with the higher Victorian
GPG contributed to a significant increase in east coast GPG demand from the previous
week, despite levels reducing in Queensland and New South Wales (Figure 5.1). For the
latter regions, lower gas generation coincided with Callide B units starting to return to service
from 16 June.2 In Victoria, flooding at the Yallourn coal-fired generator from the previous
week contributed to higher GPG demand, particularly on 17 June.3

LNG export pipeline flows decreased following increased export flows on APLNG and GLNG
pipelines from last week, with QCLNG commencing a planned maintenance outage from
15 June.4

Net flows south on the QSN link continued this week. However, these dropped off
significantly with flows reversing to deliver gas north into Queensland over 14-15 June.5
Following QSN redirecting gas south from 16 June, flows west from Wallumbilla increased
markedly from 17 June while Victorian supply north via Culcairn dropping off briefly over 17-
18 June.

In Brisbane, ex ante prices were $1.08/GJ higher on average compared to D-2 forecasts,
with GPG gentailers rebidding capacity to higher price bands.

1
        Weekday demand in Victoria increased to 1.05-1.15 PJ/day, with maximum temperatures in Melbourne ranging
        between 12.9-16.4 degrees across the week and severe weather bringing strong winds and flooding across the state
        from the previous week. Market schedule prices in Victoria increased to higher levels during the day on 17 and 18
        June, the coldest days alongside demand forecast being revised up during both gas days.
2
        In Queensland, the coal-fired Callide power station came offline from 25 May, following an explosion and fire in the
        turbine hall of unit 4 at Callide C. The Callide C generator remains offline. Callide B1 returned to service from the
        afternoon of 16 June, while Callide B2 came back online from 22 June.
3
        Flooding at the Yallourn coal-fired generator significantly reduced base load generation capacity in the region from
        12 June. In addition, very low levels of wind generation output over the first half of this week contributed to higher
        levels of gas and hydro generation being dispatched to fill in the generation shortfall. Gas generation demand
        accounted for around 127-212 TJ of daily gas demand within the Declared Transmission System. With the exception
        of 17 and 18 June, significant quantities of gas were also being exported north via Culcairn over the week (81-
        146 TJ/day, averaging 123 TJ/day over those 5 days).
4
        The scheduled maintenance outage window from 15 June to 13 July affects export capacity of more than half but less
        than one LNG export train.
5
        This was driven by a significant decrease in delivery nominations into Moomba on the SWQP, with MSP receipts from
        Moomba reducing close to zero on those days. Southern market prices were also relatively lower than Brisbane from
        13 June. Prices in Brisbane were relatively flat sitting around $11/GJ from 10-15 June, while Sydney and Adelaide
        prices reduced from higher levels seen towards the end of last week. The price in Sydney last week peaked on
        11 June ($11.76/GJ) and low wind in South Australia from 11 June coincided with ex ante prices rising to $11.44/GJ.
        Victorian prices remained significantly lower than the STTMs across the week.

© Commonwealth of Australia                                  1                     AER reference: 39270 – #12,446,749
In Sydney, D-2 forecast prices climbed higher again from the previous week, reaching close
to $13/GJ on average. With the exception of 16 June, where demand was 56 TJ higher in
the ex ante schedule, prices reduced by around $2.18/GJ from those levels in ex ante
schedules.6 This occurred alongside exporter/producers offering around 45 TJ/day of extra
supply capacity below $10/GJ in ex ante schedules.

On 13 and 15 June, MOS service payments in Sydney reached around $45,000. A decrease
MOS requirement on 13 June resulted from over forecast network demand, while an
increase requirement on 15 June was driven by higher network demand and backhaul
nominations.

Trading on the Day Ahead Auction remained strong, with record levels of capacity being won
across June. Capacity won this week exceeded 1900 TJ across 10 facilities, setting a record
for the third consecutive week. The majority of capacity was won on the MSP, RBP and
SWQP (569 TJ, 338 TJ and 266 TJ respectively).7 Trading on the EGP was also up at
around 192 TJ of capacity, with close to 2/3 won into Horsley Park following increased
participation over June.

Long term statistics and explanatory material
The AER has published an explanatory note to assist with interpreting the data presented in
its weekly gas market reports. The AER also publish a range of longer term statistics on the
performance of the gas sector including gas prices, production, pipeline flows and consumer
demand.

Market overview
Figure 1 sets out the average daily prices ($/GJ) for the current week, and demand levels,
compared to historical averages. Regions shown include the Victorian Declared Wholesale
Market (VGM or Victorian gas market) and for the Sydney (SYD), Adelaide (ADL) and
Brisbane (BRI) Short Term Trading Market hubs (STTM).

Figure 1: Average daily prices and demand – all markets ($/GJ, TJ)8

                               Victoria                   Sydney              Adelaide                   Brisbane

                            Price      Demand       Price       Demand      Price     Demand       Price      Demand

13 Jun - 19 Jun 2021        9.47        1052       11.08         318       11.42         73       11.65         127

% change from
previous week
                             12           13          7            1         10          -3         12           0

20-21 financial YTD         5.55         554        6.01         254        6.34         57        6.17         106

% change from
previous financial YTD
                            -17           -4         -8            5        -12          0           5           17

6
         A significant driver of higher demand on 16 June related to the addition of a 43 TJ controllable demand bid above
         $15/GJ in ex ante schedule, in addition to an extra 11.3 TJ of pipeline backhaul being cleared.
7
         More than a 1/3 of the capacity won on the MSP was on routes towards Moomba, with almost all SWQP capacity
         going towards Wallumbilla. While decreasing from the previous weeks, RBP activity was largely linked to GPG
         supply.
8
         Average daily quantities are displayed for each region. The weighted average daily imbalance price applies for
         Victoria.

                                                            2
Figure 2 sets out price and demand information for the voluntary Wallumbilla and Moomba
Gas Supply Hubs (GSH).

Figure 2: Average prices and total quantity – Gas supply hub ($/GJ, TJ)9

                                            Moomba                      South East Queensland                         Wallumbilla

                                    Price              Quantity              Price              Quantity           Price           Quantity

13 Jun - 19 Jun 2021                  -                      -               10.57               131               10.61             148

% change from
previous week
                                      -                      -                30                  -77               16               -68

20-21 financial YTD                 3.04                338                  6.08                6556              5.85            16106

% change from
previous financial YTD
                                    -55                  -37                  6                   -15               -5                    9

Figure 3 illustrates the daily prices in each gas market, as defined in figures 1 and 2.

Figure 3: Daily gas market prices ($/GJ)
      14

      12

      10

           8
    $/GJ

           6

           4

           2

           0
                13 Jun             14 Jun           15 Jun               16 Jun              17 Jun            18 Jun            19 Jun
                    Sydney (Ex ante STTM)                        Adelaide (Ex ante STTM)                    Brisbane (Ex ante STTM)
                    Victoria (6am DWGM)                          Wallumbilla (VWA)                          Moomba (VWA)
                    South East Queensland (VWA)

Figure 4 compares average ancillary market payments (VGM) and balancing gas service
payments (STTM) against historical averages.

Figure 4: Average daily ancillary payments ($000)

                                                      Victoria                    Sydney                Adelaide              Brisbane
                                                  Ancillary Payments*                MOS                   MOS                    MOS

13 Jun - 19 Jun 2021                                         -                       31.61                 10.04                  1.53

% change from previous week                                  -                        21                    68                    135

20-21 financial YTD                                                                  19.80                 7.73                   3.56

% change from previous financial
YTD
                                                                                      -6                    81                    125

* Ancillary payments reflect the compensation costs for any additional injections offered at a price higher than the market price.
Note: only positive ancillary payments, reflecting system constraints will be shown here.

9
               The prices shown for the GSH in Moomba, South East Queensland and Wallumbilla are volume weighted average
               (VWA) prices for all products traded across the period. The total quantity contributing to the weighted price is
               displayed for these GSH. Reported values for Moomba are the aggregate of trades on the Moomba to Adelaide
               Pipeline (MAP) and the Moomba to Sydney Pipeline (MSP). Historic trades for RBP and SWQP are grouped under
               WAL, (including in-pipe trades on the RBP).

                                                                         3
More detailed analysis on the VGM is provided in section 1.
Figure 5 shows the quantity and volume weighted prices of products traded in the Gas
Supply Hub locations at Moomba, South East Queensland and Wallumbilla.
Figure 5: Gas supply hub products total traded for the current week ($/GJ, TJ)10
Moomba South East Queensland Wallumbilla*
VWA price Quantity VWA price Quantity VWA price Quantity
Balance of day - - 11.12 46.0 10.80 45.0
Daily - - - - 10.75 31.0
Day ahead - - 10.26 85.0 10.44 72.0
Weekly - - - - - -
Monthly - - - - - -
Total - - 10.57 131.0 10.61 148.0
* includes non-netted (off-market) trades.
Figure 6 shows Bulletin Board pipeline flows for the three LNG export pipeline facilities and
the production output at related production facilities in the Roma region.
Figure 6: Average daily LNG export pipeline and production flows (TJ)*
APLNG GLNG QCLNG Total
Production 1536 1008 1664 4208
Export Pipeline Flows 1576 1196 791 3563
% change from previous
week (pipeline flows)
6 34 -38 -2
20-21 financial YTD Flows 1469 1000 1311 3780
* Production quantities represent flows from facilities operated by APLNG, Santos and QGC. Gas from individual facilities may
also supply the domestic market, other LNG projects or storage facilities.
10
Further information about new product trading locations in Victoria (Culcairn) and Sydney (Wilton) is available in
section 6. Gas Supply Hub).
4Detailed Market Figures
1. Victorian Declared Wholesale Market
In the Victorian gas market, gas is priced five times daily at 6 am, 10 am, 2 pm, 6 pm and
10 pm. The imbalance weighted price on a gas day tends towards the 6 am price11 which is
the schedule at which most gas is traded.
The main drivers12 of price are demand forecasts and bids to inject or withdraw gas from the
market. Figures 1.1 to 1.4 below show the daily prices, demand forecasts13, and
injection/withdrawal bids for each of the five pricing schedules. Figure 1.5 provides
information on which system injection points were used to deliver gas, in turn indicating the
location and relative quantity of gas injection bids cleared through the market.
Ancillary payments for gas injected above the market price are shown above in figure 3.
Figure 1.1: Prices by schedule ($/GJ)
16
14
12
10
8
$/GJ
6
4
2
0
13 Jun 14 Jun 15 Jun 16 Jun 17 Jun 18 Jun 19 Jun
6am 10am 2pm 6pm 10pm Daily Imbalance Weighted Average Price
Figure 1.2: Demand forecasts (TJ)
1300
1200
1100
1000
900
800
700
600
TJ
500
400
300
200
100
0
13 Jun 14 Jun 15 Jun 16 Jun 17 Jun 18 Jun 19 Jun
6am 10am 2pm 6pm 10pm
11
Prices for subsequent schedules are applied only to the differences in scheduled quantities (imbalances) to calculate
the weighted price. The 6 am price applies to the entire scheduled quantity in the initial schedule.
12
The price might also be affected by transmission or production (contractual) constraints limiting how much gas can be
delivered from a locale or System Injection Point (SIP) from time to time.
13
These are Market Participants’ aggregate demand forecasts adjusted for any override as applied by AEMO from time
to time. These forecasts must be scheduled and cannot respond to price like withdrawal bids.
5Figure 1.3: Injection bids by price bands (TJ)
2500
2000
1500
TJ
1000
500
0
6am
6pm
6am
6pm
2pm
6pm
2pm
6pm
2pm
6am
2pm
6am
2pm
2pm
6am
6am
6am
6pm
6pm
2pm
6pm
10pm
10pm
10am
10am
10am
10pm
10am
10am
10am
10pm
10am
10pm
10pm
10pm
13 Jun 14 Jun 15 Jun 16 Jun 17 Jun 18 Jun 19 Jun
$02. Sydney STTM
In each STTM hub, a daily gas price is calculated before the gas day (the ex ante price) and
after the gas day (the ex post price). The main drivers of these prices are participant demand
forecasts, and offers to inject or bids to withdraw gas traded at the hub.14 Divergences in
ex ante and ex post prices for a gas day may occur due to differences in scheduled
(forecast) and allocated (actual) quantities. Pipeline acronyms are defined in the user guide.
Market Operator Service balancing gas (MOS) payments arise because the amount of gas
nominated on pipelines for delivery on a gas day will either exceed or fall short, by some
amount, of the amount of gas consumed in the hub. In such circumstances, MOS payments
are made to participants for providing a service to park gas on a pipeline or to loan gas from
a pipeline to the hub.15
Figures 2.1 and 2.2 show daily prices, demand, offers and bids. Figures 2.3 and 2.4 show
gas scheduled and allocated on pipelines to supply the hub, indicating the location and
relative quantity of gas offers across pipelines and also the amount of MOS allocated for
each pipeline.
Figure 2.1: SYD STTM daily ex ante and ex post prices and quantities
Sun Mon Tue Wed Thu Fri Sat
Ex ante price ($/GJ) 10.10 10.30 10.38 11.69 11.50 11.79 11.84
Ex ante quantity (TJ) 301 309 332 360 332 319 276
Ex post price ($/GJ) 10.00 10.00 10.99 11.29 11.58 11.30 12.50
Ex post quantity (TJ) 288 302 357 353 335 309 297
Figure 2.2: SYD daily hub offers and daily hub bids in price bands ($/GJ)
900 600
800
500
700
600 400
Bids (TJ)
Offers (TJ)
500
300
400
300 200
200
100
100
0 0
13 Jun 14 Jun 15 Jun 16 Jun 17 Jun 18 Jun 19 Jun 13 Jun 14 Jun 15 Jun 16 Jun 17 Jun 18 Jun 19 Jun
Pricetaker 0Figure 2.3: SYD net scheduled and allocated gas hub supply (excluding MOS)
Figure 2.3 shows the daily scheduled and allocated quantities sorted by facility for Sydney
this week. For a more detailed description of this figure, please refer to the user guide.
350
300
250
200
150
TJ
100
50
0
Sched Alloc Sched Alloc Sched Alloc Sched Alloc Sched Alloc Sched Alloc Sched Alloc
13 Jun 14 Jun 15 Jun 16 Jun 17 Jun 18 Jun 19 Jun
EGP MSP ROS NGS
Figure 2.4: SYD MOS allocations (TJ), service payments and commodity
payments/charges ($000)16
80 $300
60 $200
40
$100
20
$0
TJ
0
-$100
-20
-$200
-40
-60 -$300
-80 -$400
13 Jun 14 Jun 15 Jun 16 Jun 17 Jun 18 Jun 19 Jun 13 Jun 14 Jun 15 Jun 16 Jun 17 Jun 18 Jun 19 Jun
EGP - Allocation MSP - Allocation
EGP - Decrease MSP - Decrease MOS Service Payment MOS Commodity Payment MOS Commodity Charge
EGP - Increase MSP - Increase
16
The commodity cost of MOS illustrated on the right of the figure represents the commodity quantity at the D+2
ex ante price. Commodity payments and charges for a given gas day relate to quantities traded two days earlier. That
is, the commodity cost for services provided on Sunday will appear in the chart for Tuesday, when the D+2 price is
set. In contrast, service payments are shown alongside the day they occurred.
83. Adelaide STTM
The Adelaide STTM hub functions in the same way as the Sydney STTM hub. The same
data that was presented for the Sydney hub is presented for the Adelaide hub in the figures
below.
Figure 3.1: ADL STTM daily ex ante and ex post prices and quantities
Sun Mon Tue Wed Thu Fri Sat
Ex ante price ($/GJ) 10.80 10.76 10.80 11.31 11.60 12.19 12.50
Ex ante quantity (TJ) 66 62 75 84 80 73 70
Ex post price ($/GJ) 10.01 10.55 10.40 11.10 11.24 12.40 12.50
Ex post quantity (TJ) 58 56 67 81 77 78 68
Figure 3.2: ADL daily hub offers and daily hub bids in price bands ($/GJ)
300 160
140
250
120
200
100
Bids (TJ)
Offers (TJ)
150 80
60
100
40
50
20
0 0
13 Jun 14 Jun 15 Jun 16 Jun 17 Jun 18 Jun 19 Jun 13 Jun 14 Jun 15 Jun 16 Jun 17 Jun 18 Jun 19 Jun
Pricetaker 04. Brisbane STTM
The Brisbane STTM hub functions in the same way as the Sydney STTM hub. The same
data that was presented for the Sydney hub is presented for the Brisbane hub in the figures
below.
Figure 4.1: BRI STTM daily ex ante and ex post prices and quantities
Sun Mon Tue Wed Thu Fri Sat
Ex ante price ($/GJ) 11.08 11.05 11.37 12.10 12.49 11.72 11.73
Ex ante quantity (TJ) 118 130 132 133 133 125 118
Ex post price ($/GJ) 10.82 11.20 11.80 12.10 12.40 12.19 10.91
Ex post quantity (TJ) 116 133 139 134 129 129 107
Figure 4.2: BRI daily hub offers and daily hub bids in price bands ($/GJ)
300 250
250 200
200
150
Bids (TJ)
Offers (TJ)
150
100
100
50
50
0 0
13 Jun 14 Jun 15 Jun 16 Jun 17 Jun 18 Jun 19 Jun 13 Jun 14 Jun 15 Jun 16 Jun 17 Jun 18 Jun 19 Jun
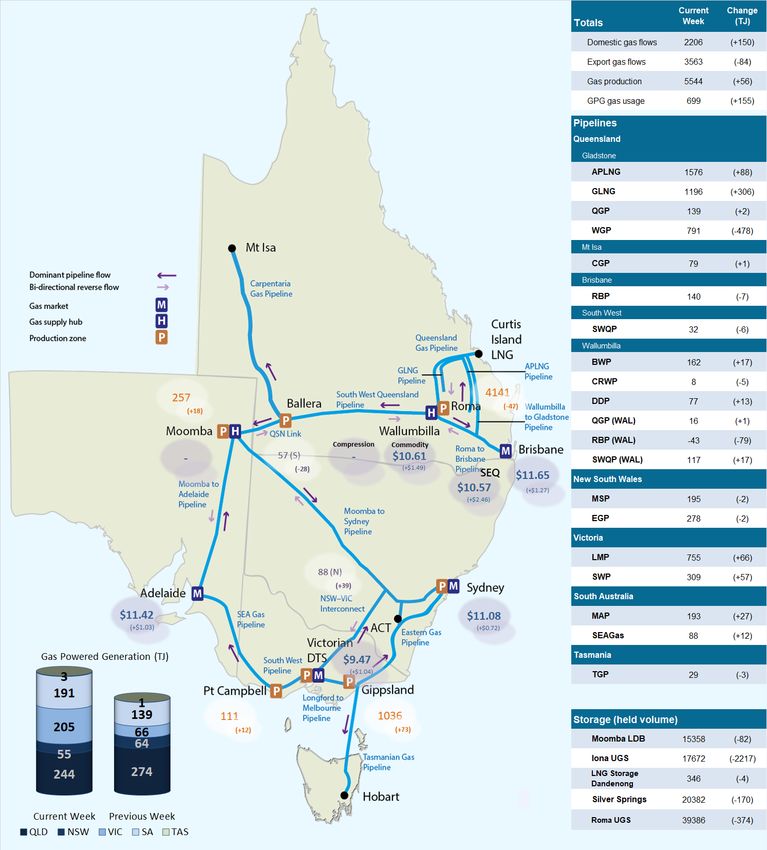
Pricetaker 05. National Gas Bulletin Board
Figure 5.1 shows average daily actual flows for the current week17 from the Bulletin Board
(changes from the previous week’s average are shown in brackets). Average daily prices18
are provided for gas markets and gas supply hubs. Average daily quantities are provided for
gas powered generation for each region.
Figure 5.1: Gas market data ($/GJ, TJ); Bulletin Board flows (TJ)19
17 Domestic gas flows are calculated as the total of: SA = MAP + SEAGAS; VIC = SWP + LMP + (flows towards
Victoria on the ‘NSW-VIC interconnect’); NSW/ACT = EGP + MSP; TAS = TGP; QLD (Brisbane) = RBP;
QLD (Mt Isa) = CGP; and QLD (Gladstone) = QGP.
Export gas flows are calculated as the total of: the APLNG pipeline; the GLNG pipeline; and the Wallumbilla to
Gladstone pipeline.
GPG volumes may include gas usage that does not show up on Bulletin Board pipeline flows.
18 GSH supply is the average daily volume of gas ‘traded’, while price is a volume weighted average. Optional hub
services (for compression and redirection) are shown separately from commodity trades.
19 Net flows are shown for Bulletin Board facilities, as outlined in the user guide.
116. Gas Supply Hub
The gas supply hub was established at Wallumbilla in March 2014 to facilitate the voluntary
trading of gas between participants, with products listed for sale and purchase at delivery
points on three major connecting pipelines. There are separate products for each trading
location and delivery period (daily, day-ahead, balance-of-day, weekly and monthly
products).20
The Moomba hub commenced operation from June 2016 to further facilitate trading on the
MAP and MSP, with trading between the two hubs on the SWQP via a spread product
(representing the price differential between the hubs). From October 2016, the addition of a
Wallumbilla Compression Product was introduced to facilitate the supply hub’s transition
from three different trading locations into one. From March 2017, Wallumbilla transitioned
into an optional hub services model, replacing the three trading locations (QGP, SWQP and
RBP) with a single product at Wallumbilla (WAL) and an in-pipe RBP trading location at
South East Queensland (SEQ). On 28 January 2021, trading locations at Wilton (Sydney)
and Culcairn (Victoria) were introduced.
This week there were 35 trades for 279 TJ of gas at a volume weighted price of $10.59/GJ.
These consisted of 17 trades at WAL (148 TJ at $10.61/GJ) and 18 trades at SEQ (131 TJ
at $10.57/GJ).
Figure 6.1 shows the quantity of gas traded by product type for each trading day on pipeline
trading locations in the Wallumbilla and Moomba Gas Supply Hubs.21
Figure 6.1: GSH traded quantities
90
80
70
60
Volume Traded (TJ)
50
40
30
20
10
0
WAL*
SEQ
WAL*
SEQ
WAL*
SEQ
WAL*
SEQ
WAL*
SEQ
WAL*
SEQ
WAL*
SEQ
13 Jun 14 Jun 15 Jun 16 Jun 17 Jun 18 Jun 19 Jun
Balance of day Daily Day ahead Monthly Weekly
20 Additional information on trading locations and available products is detailed in the user guide.
21 Non-netted (off-market) trades, allowing the selection of specific delivery point at a trading location, are included with
other Wallumbilla trades (WAL*). Non-netted trades at Moomba are shown separately (MOO) from MAP and MSP.
127. Day Ahead Auction
The DAA is a centralised auction platform providing the release of contracted but un-
nominated transportation capacity on designated pipelines and compression facilities across
eastern Australia. The auction, enables transportation facility users to procure residual
capacity on a day-ahead basis after nomination cut-off, with a zero reserve price and
compressor fuel provided.
Participants may bid in to the DAA in order to procure the following services:
park services;
forward haul pipeline services with products offered in both directions on bi-
directional pipelines;
interruptible backhaul services; and
stand-alone compression services.
This week, 15 participants took part in the DAA, winning 1912 TJ of capacity across 10
different facilities.
Figure 7.1 shows the quantities of gas and auction legs won through the DAA by gas date,
with gas deliverable up to the level of capacity procured. Auction legs reflect each individual
facility transaction.22
Figure 7.1: DAA traded quantities and auction legs won
450 45
Capacity quantity won (TJ)
400 40
350 35
Auction legs won
300 30
250 25
200 20
150 15
100 10
50 5
0 0
13 Jun 14 Jun 15 Jun 16 Jun 17 Jun 18 Jun 19 Jun
MSP SWQP RBP WCFA WCFB
EGP CGP MCF BWP MAPS
ICF QGP VICHUB Auction legs
Australian Energy Regulator
July 2021
22
Additional information is available in the user guide to the AER gas weekly report.
13You can also read