Gas Price Formation, Structure & Dynamics - Note de l'Ifri
←
→
Page content transcription
If your browser does not render page correctly, please read the page content below
Note de l’Ifri

        Gas Price Formation,
        Structure & Dynamics

                       Romain Davoust
                                  April 2008

                      Gouvernance européenne
                      et géopolitique de l’énergie
The Institut Français des Relations Internationales (Ifri) is a research
   center and a forum for debate on major international political and
   economic issues. Headed by Thierry de Montbrial since its founding
   in 1979, Ifri is a non-governmental and a non-profit organization.
   As an independent think tank, Ifri sets its own research agenda,
   publishing its findings regularly for a global audience.
   With offices in Paris and Brussels, Ifri stands out as one of the rare
   French think tanks to have positioned itself at the very heart of
   European debate.
   Using an interdisciplinary approach, Ifri brings together political and
   economic decision-makers, researchers and internationally
   renowned experts to animate its debate and research activities.

      The opinions expressed in this text are the responsibility of the
                            authors alone.

                              ISBN: 978-2-86592-278-9
                            © All rights reserved, Ifri, 2008

IFRI                                                             IFRI-BRUXELLES
27 RUE DE LA PROCESSION                                          RUE MARIE-THÉRÈSE, 21
75740 PARIS CEDEX 15 - FRANCE                                    1000 - BRUXELLES, BELGIQUE
TÉL. : 33 (0)1 40 61 60 00 - FAX: 33 (0)1 40 61 60 60            TÉL. : 00 + (32) 2 238 51 10
Email: ifri@ifri.org                                             Email: info.bruxelles@ifri.org
                                  SITE INTERNET : www.ifri.org
CONTENTS
INTRODUCTION ..................................................................................... 2
Methodological note: ..........................................................................3
A] NORTH AMERICA ............................................................................ 5
1) A brief history of prices and regulation ...........................................5
2) Gas price trends .................................................................................6
3) Integration of spot and futures prices..............................................7
4) LNG prices...........................................................................................8
5) End-use prices ....................................................................................9
B] EUROPE ....................................................................................... 11
1) The pricing structure in Continental Europe .................................11
2) Spot developments ..........................................................................13
3) LNG pricing .......................................................................................14
4) Retail prices ......................................................................................15
5) The case of the United Kingdom.....................................................16
5) a) main features............................................................................16
5) b) price history and formation.......................................................16
6) Table of European gas prices……………………………………..…...18
C] ASIA............................................................................................. 21
1) Gas sector overview.........................................................................21
2) LNG price determination and evolution in Asia ............................21
3) End-use prices ..................................................................................23
4) Table of Northeast Asian gas prices ..............................................26
CONCLUSIONS.................................................................................... 27
BIBLIOGRAPHY ................................................................................... 31
1R. Davoust / Gas Price Formation, Structure & Dynamics
Introduction
Our study, focused on gas prices in importing economies, describes
wholesale prices and retail prices, their evolution for the last one or
two decades, the economic mechanisms of price formation.
While an international market for oil has developed thanks to
moderate storage and transportation charges, these costs are much
higher in the case of natural gas, which involves that this energy is
still traded inside continental markets. There are three regional gas
markets around the world: North America (the United States,
importing mainly from Canada and Mexico), Europe (importing mainly
from Russia, Algeria and Norway) and Asia (Japan, Korea, Taiwan,
China & India, importing mainly from Indonesia, Malaysia &
Australia). A market for gas has also developed in South America, but
it will not be covered by our paper.
In Europe and the US, due to large domestic resources and
strong grids, natural gas is purchased mostly through pipelines. In
Northeast Asia, there is a lack of such infrastructures, so imported
gas takes mainly the form of Liquefied Natural Gas (LNG), shipped on
maritime tankers. Currently, the LNG market is divided into two
zones: the Atlantic Basin (Europe and US) and the Pacific Basin (Asia
and the Western Coast of America). For the past few years, the
Middle East and Africa have tended to be crucial suppliers for both
LNG zones.
Gas price formation varies deeply between regional markets,
depending on several structural factors (regulation, contracting
practises, existence of a spot market, liquidity, share of imports…).
Empirically, the degree of market opening (which corresponds to the
seniority in the liberalization process) seems to be the primary
determinant of pricing patterns.
North America has the most liberalized and well-performing
natural gas industry in the world. Gas pricing is highly competitive and
is based on supply/demand balances. Spot and futures markets are
developed. The British gas sector is also deregulated and thus
follows a similar paradigm. Gas-to-gas competition now prevails.
Long-term contracting is still the dominant model in Continental
Europe and Northeast Asia, because of their dependence on external
imports. Thus, pricing there is more rigid, and due to an indexation
clause, gas prices closely follow the tendency of oil markets (as we
will see further, American and British prices are also coupled to oil,
but for less contractual reasons).
© Ifri 2R. Davoust / Gas Price Formation, Structure & Dynamics
Logically, the first part of our study analyses North American
gas prices, the second part European prices and the third part Asian
prices. Since American and British gas markets exhibit the same
nature and similar pricing features, it would be more relevant to treat
them together. However, if these two markets are close conceptually,
there is no specific price connection between them. Indeed, due to
the presence of the Interconnector, a pipeline passing under the
Channel, UK prices tend to be rather linked to the European
Continent’s. Therefore, in our paper, the case of the UK is simply
studied inside Europe, although in a dedicated paragraph.
While observing mid and long-period price series, we will
obviously seek common trends, since price integration (convergence
or simple correlation) is generally evidence in favor of market
integration. Price indications will thus guide us with a view to answer
two crucial questions:
1) Did liberalization policies succeed in the US and EU,
in their attempt to make natural gas a freely traded
commodity?
2) Is a world market for gas emerging? In other words,
is natural gas becoming a worldwide traded
commodity?
The first question concerns intra-regional integration of
markets: common price trends between local spot markets (in the
case of the US), between member states (in the case of EU), and
between piped gas and LNG (in both cases).
The second question concerns inter-regional integration of
markets. In this view, the case of LNG will be of an overriding
importance. Indeed, the higher technical flexibility of the LNG supply
chain implies rising LNG international arbitrage, cargoes being
diverted to the most profitable destinations. Co-movements are then
expected between regional quotes, leading to the potential
emergence of a world gas market with a single price.
Methodological note
In order to facilitate comparisons, all prices (wholesale and retail)
have been converted into a common unit: dollars per millions of
British Thermal Units ($ / MBtu). Also, in order to flatten the usual
volatility or seasonality in gas prices, we always use yearly average
prices.
All prices displayed in figures, tables and text are nominal
values (except figures n°11 and 13: prices are expressed in dollars of
2000). Using market prices (which integrate inflation) is suitable for
the present study. Indeed, the presence of inflation doesn’t impede
the analysis of price determination or structure. Regarding price
trends over time, inflation, with its distorting effect, can become more
© Ifri 3R. Davoust / Gas Price Formation, Structure & Dynamics problematic. Real prices, deflated through constant values, usually offer a clearer vision of gas sector fundamentals (for example, constant prices are required in order to assess the evolution of the balance between reserves, production and consumption). However, more than the sense of trajectories, this paper tries particularly to check the parallelism between them (between spot and import prices for example) and from this point of view, inflation (an overwhelming, macroeconomic effect) doesn’t interfere. © Ifri 4
R. Davoust / Gas Price Formation, Structure & Dynamics

North America

1) A brief history of prices and regulation

The Natural Gas Act of 1938 orders companies to charge “cost-of-
service” rates for interstate gas trade. Such quotes consist of historic
costs plus a reasonable return on investment (ETC, 2007). In 1954, a
Supreme Court Judgement extended control to wellhead prices, but
only regarding gas sold by interstate pipelines. As a result, price
distortions occur between interstate and intrastate markets on the one
hand, and between gas and energies such as oil and coal on the
other hand.
       A partial deregulation of wellhead prices occurred in 1978 with
the Natural Gas Policy Act. But in the meantime, international energy
prices soared due to the oil shocks, so when full de-regulation finally
became effective seven years later, gas rates rose suddenly, creating
an extended market surplus called “the gas bubble”, which lasted until
the mid-1990’s (ETC, 2007).
        At the beginning of the 1980’s, gas transactions were long-
term contracts between producers, pipeline traders and Local
Distribution Companies (LDC), including a minimum bill provision in
order to secure the value chain. In 1984, the Federal Energy
Regulatory Commission (FERC) Order n°380 released utility buyers
such as LDC from the commitment to purchase the transportation
capacity they reserve, which led to a deep fall in average wellhead
prices. Consequently, from 1986 until 2000, demand resumed its
growth with major reliance on imports from Canada (ETC, 2007).
Figure n°1 thus shows that American wholesale prices rose steadily
over the period: the yearly average spot price at the Henry Hub
swelled from 1.70 $ / MBtu in 1989 to 2.75 $ in 1996.
        During the winter 2000-01, gas prices peaked to more than
4 $ / MBtu because of a structural supply shortage (Canadian exports
were not sufficient to fuel the increase of the US gas demand) (ETC,
2007). Between 2001 and 2005, an upward thrust occurred in gas
prices, in line with the “third oil shock”: Henry Hub quoted average
8.80 $ / MBtu in 2005. Since spring 2006, the gas market has
slackened a bit, and so have prices.

  © Ifri                                 5
R. Davoust / Gas Price Formation, Structure & Dynamics
Figure n°1: Wholesale average prices of natural gas in US (1989-2006)
14.00
12.00
10.00
$/ 8.00
M
Bt
u 6.00
4.00
2.00
0.00
89 90 91 92 93 94 95 96 97 98 99 00 01 02 03 04 05 06
year
Wellhead Spot (Henry Hub) WTI spot
Source: US DOE, BP Statistical Review & Energy Prices & Taxes
2) Gas price trends
The North American market for gas consists of the United States,
Canada and, to a lesser extent, Mexico. The US natural gas market is
competitive, liquid and transparent, to such an extent that gas-to-gas
competition now prevails. But this physical spot market is frequently
volatile. Therefore, since 1989, agents manage price fluctuation risks
with futures contracts on the New York Mercantile Exchange
(NYMEX).
Henry Hub, a major pipeline junction in Louisiana is the
reference point of the North American pricing system; rates for other
hubs are defined by difference from it. These quote gaps (called
“basis differentials”) reflect the transportation costs required to bring
the gas to Henry Hub, but also correspond to market conditions at
different national hubs (ETC, 2007).
Although American gas prices are set by supply/demand
equilibriums, independently from any reference to oil, they run parallel
to petroleum trends in the long run. Indeed, due to inter-energy
substitution effects at the end-use side, monthly gas prices range
inside a corridor formed by a lower limit, heavy fuel rate, and an
upper limit, light fuel rate. Indeed, in case of a gas price spike,
households switch to light fuel oil, large industries switch to heavy fuel
oil and power plants switch to coal (Maisonnier, 2005).
© Ifri 6R. Davoust / Gas Price Formation, Structure & Dynamics
More precisely, the Energy Treaty Charter states that since
the restructuring of the North American gas industry, gas-to-gas
competition is the dominant pattern when the sector is in surplus, but
when the market tightens, the correlation reappears due to inter-fuel
replacements. For instance, when the American gas market was still
at ease during the first part of the 1990’s (period of “gas bubble”), gas
rates evolved in quite a different manner than a barrel of West Texas
Intermediate (WTI) (figure n°1). Since the end of the 90’s and new
restrictions on gas supply in the US (fading domestic production),
they seem to be moving more in line.
3) Integration of spot and futures prices
Several empirical studies (de Vanys & Walls 1993 & 1994, King &
Cuc 1996, Cuddington & Wang 2006, Park, Mjelde & Bessler 2007)
suggest that liberalization policies (pipeline open access since FERC
order n°436 in 1985), by reinforcing spatial arbitrage activity in the
long run, have strengthened the US gas market integration. A
common finding is that the number of co-integrated local markets has
increased within the 5 to 10 years following the reform. This
convergence is simply proved by the rising price spread correlations
between geographical locations. Finally, Serletis & Rangel-Ruiz
(2004, cited by Park, Mjelde & Bessler 2007) conclude that North
American natural gas prices are largely defined by Henry Hub price
trends. Nevertheless, King & Cuc (1996) and Cuddington & Wang
(2006, cited by Park, Mjelde & Bessler 2007) discover an East-West
spit inside the North American natural gas market, since the Western
side seems to be weakly integrated within the rest of the country.
To summarize, the North American gas sector is a single, fully
liberalized, highly competitive and strongly integrated market. This
spot market maturity should then bolster the futures market efficiency
in its capacity to integrate the sum of private information and
expectations concerning gas supply and demand. In other words,
prices as formed in the futures market should represent an accurate
forecast of future spot prices. Indeed, Walls (1995, cited by Wong-
Parodi, Dale & Lekov 2006) finds that gas futures prices are unbiased
predictors of future spot prices. Wong-Parodi, Dale & Lekov (2006)
state that the futures market is a more accurate predictor of natural
gas prices within a two-year horizon than is the Short-Term Energy
Outlook (STEO) of Energy Information Administration. As an
explanation, Henry Hub forward prices are determined economically
by the agent’s expectations while the STEO derives analytically from
an extrapolation of past price trends.
However, Felder (1995) affirms that the deregulation of gas
industries has created new price volatility, and therefore one should
give up deterministic approaches of price forecasting and opt for
random walk models.
© Ifri 7R. Davoust / Gas Price Formation, Structure & Dynamics
4) LNG prices
North America is part of the Atlantic Basin LNG market (with Europe).
But in America, LNG trade is encompassed in the overall competitive
evolution that affects the whole gas and electricity sector. As a result,
LNG price determination is more or less disconnected from oil
reference, and follows the trends of the existing gas-to-gas
competition in the US.
Figure n°2 confirms this statement: pipeline import prices and
LNG import prices follow a similar trajectory, which is given by market
conditions at Henry Hub spot. As for an explanation, LNG is imported
through short-term contracts on a netback basis, including a constant
reference to gas market yardsticks like Henry Hub (ETC, 2007). More
generally, such common movements between LNG, piped and spot
gas (econometrically proved by Siliverstives, l’Hegaret, Neumann &
von Hirschausen, 2004) have witnessed the better integration of
American gas prices since the industrial deregulation.
Figure n°2: Average import prices of natural gas in US (1989-2006)
10
9.00
8.00
7.00
$/MBtu
6.00
5.00
4.00
3.00
2.00
1.00
0.00
year 89 90 91 92 93 94 95 96 97 98 99 00 01 02 03 04 05 06
Spot (Henry Hub) Pipeline import LNG import
Source: BP, Energy P&T
Besides, self-contracting practises with destination flexibility
have been introduced along the LNG chain, which reinforced
competition in LNG pricing (ETC, 2007). Thus, figure n°2 displays that
LNG import rates, which were much higher than pipeline import rates
during the 90’s, tends afterwards to equalize to this latter. This
relatively lower price of LNG can moreover be explained by
technological improvements all along the LNG supply chain
© Ifri 8R. Davoust / Gas Price Formation, Structure & Dynamics
(liquefaction, shipping) and by progressive diversification of supplying
countries. Finally, thanks to the new gas market environment in the
US, characterized by declining internal reserves and rising quotes,
LNG import prices are becoming more and more interesting with a
view to matching American gas needs in the future.
5) End-use prices
Figure n°3: End-use average prices of natural gas in US (1989-2006)
$/MBtu
16.00
14.00
12.00
10.00
8.00
6.00
4.00
2.00
0.00
year 89 90 91 92 93 94 95 96 97 98 99 00 01 02 03 04 05 06
Spot (Henry Hub) Residential Industrial Power generation
Source: US DOE
Rates applied to the industrial and power sector tend to harmonize
over time by moving closer to the spot price. Walls (1994, cited by
Park, Mjelde & Bessler 2007) has indeed discovered that the city gate
prices at certain locations are co-integrated with field market prices
(wellhead). Household tariffs are higher than other quotes by a factor
2. This residential over-tariff (which is a world-wide feature) is caused
by additional costs that are specific to that sector: distribution costs,
which structurally represent a major part of the final price. Those
distribution charges usually correspond to the commercial margins
levied by LDCs at the city gate before delivering to small consumers.
However, end-use sectors (residential, industrial and
electrical) have natural gas delivered under different technical
conditions; they have different demand functions, including a variety
of factors. But in spite of that variability, convergences between
existing ranges of price, combined with a relatively low level of gas
tariffs, attest the success of deregulation policies in the United States.
© Ifri 9R. Davoust / Gas Price Formation, Structure & Dynamics
6) US gas prices
Table of US gas prices ($/Mbtu)
WHOLESALE END-USE
Spot Well Pipe LNG House
year Industry Power G
(Hen.H.) head import* import* holds
1989 1.70 1.64 1.76 2.15 5.47 2.87 2.36
1990 1.64 1.66 1.85 2.40 5.63 2.84 2.31
1991 1.49 1.59 1.76 2.29 5.65 2.61 2.11
1992 1.77 1.69 1.78 2.46 5.71 2.75 2.29
1993 2.12 1.98 1.96 2.13 5.98 2.98 2.53
1994 1.92 1.79 1.80 2.21 6.22 2.96 2.21
1995 1.69 1.50 1.44 2.23 5.88 2.63 1.96
1996 2.75 2.10 1.90 2.72 6.15 3.32 2.61
1997 2.52 2.25 2.09 2.66 6.73 3.48 2.70
1998 2.08 1.90 1.89 2.55 6.62 3.05 2.33
1999 2.27 2.12 2.16 2.40 6.49 3.01 2.54
2000 4.23 3.57 3.86 3.40 7.53 4.35 4.25
2001 4.06 3.88 4.31 4.22 9.34 5.08 4.47
2002 3.34 2.86 3.04 3.31 7.65 3.90 3.57
2003 5.62 4.73 5.07 4.65 9.34 5.71 5.40
2004 5.85 5.30 5.63 5.65 10.43 6.33 5.93
2005 8.80 7.11 7.85 8.01 12.45 8.30 8.23
2006 6.76 6.23 6.63 6.97 13.34 7.65 6.88
* average price
Source: DOE, BP, Energy P&T
© Ifri 10R. Davoust / Gas Price Formation, Structure & Dynamics
Europe
1) The pricing structure in Continental Europe
Continental Europe relies increasingly on gas imports. Transactions
generally regard large volumes extracted from giant fields. Natural
gas is imported through long-term contracts from Russia, Algeria,
Norway, Nigeria or Libya (but gas can be bought inside the European
Union: the United Kingdom, Germany, the Netherlands, Italy…).
In Continental Europe, the pricing is based on the
“replacement value” of gas, which corresponds to the value of
alternative energies on the final gas markets inside the buyer’s
country. This market value of gas is then netted back to the exporting
state’s border by subtracting intermediary charges to deliver to the
customer (transportation cost, distribution cost and other costs), and
this gives the final reselling price (the producer price). Historically, this
concept of long-term contract with a price based on replacement
value was designed first for exports from the Dutch field of Groningen
(first large reserve discovery in Europe).
Moreover, contracts include a review clause: price is adapted
regularly in line with the development of the competitive situation of
gas in each of the residential, industrial and power sectors. In other
words, the price formula is re-calculated (usually every three months)
in order to reflect movements in the share of gas in power generation,
and changes in the mix of the competing fuels, mainly light fuel oil
and heavy fuel oil but also crude oil, coal, electricity or inflation (ETC,
2007). More recently, since the creation of the Interconnector
between the UK and the Continent, a reference to gas-to-gas
competition has been integrated in the indices. But despite variations
in the shares of different components, the price of gas in Continental
Europe remains mainly pegged to fuel oil products. The Energy
Sector Inquiry (ESI, 2007) empirically confirms that the rates of
European long-term contracts are mainly linked to oil and oil
derivatives, according to a volume-weighted indexation.
© Ifri 11R. Davoust / Gas Price Formation, Structure & Dynamics
Figure n°4: Average import price of natural gas in EU (1986-2006)
$/MBtu
14.
12.
10.
8.0
6.0
4.0
2.0
0.0
86 87 88 89 90 91 92 93 94 95 96 97 98 99 00 01 02 03 04 05 06
year
Brent Gas imports
Source: BP, Energy P&T
Indeed, in figure n°4, due to a wide indexation to fuel oil
products, the import contracts average price in Continental Europe
closely tracks the oil barrel, although with a lag of more or less 6
months. According to Siliverstives, l’Hegaret, Neumann & von
Hirschausen (2004), import gas prices in Europe follow developments
in North Sea Brent Crude Oil (a reference for many gas import
contracts in Europe) with a lag of about 4-8 months. As shown in
figure n°5, purchase prices all over Europe consequently move in an
identical manner.
Figure n°5 Average import prices in EU member states (1999-2006)
14
12
10
$/MBtu 8
6
4
2
0
99 00 01 02 03 04 05 06
year
Austria Belgium Finland
Germany Greece Ireland
Netherlands Spain Brent spot
Source: Energy P&T
© Ifri 12R. Davoust / Gas Price Formation, Structure & Dynamics
To be more precise, the indexation pattern varies by import
source. According to the ESI, imports from Russia, Norway and the
Netherlands have a similar indexation with a pegging of over 80% to
fuel oil products and as a result, gas purchased from those countries
display similar price levels. By contrast, Algerian gas is mostly linked
to crude oil for 70% (it is the cheapest gas sold in Europe).
Price indexation also varies according to the purchaser’s
region, with a big split between the UK and Continental Europe. In the
UK, fuel oil products account for only 30% of the total pegging. On
Continental Europe, the importance of fuel oil is much higher: 80% in
Western Europe, 95% in Eastern Europe.
The observation of price convergence between different
member states provides a good indicator of the achievement of the
European internal gas market since liberalizing reforms were
undertaken (European Single Act of 1986, EU Gas Directives of 1998
& 2003). For instance, using co-integration analysis of import prices,
Asche, Osmunden & Tveteras (2001, 2002, cited by Robinson, 2006)
infer that the French, Belgium and German markets are integrated.
2) Spot developments
It seems obvious that the continental import model is not favorable to
a reactive gas price based on gas-to-gas competition. There is in fact
a weak price-elasticity of demand on the Continent, which comes
from two factors: gas imports often involve wholesale players
(national companies) on both sides of the exchange, and natural gas
is used less in power plants in Continental Europe than in the UK or
the US (ETC, 2007). Despite substantial measures aimed at creating
a single competitive gas market (removal of destination clauses and
take-or-pay obligations, mandatory Third Party Access), long-term
contracts still remain the dominant practice for imports of natural gas,
although with a fostered flexibility.
Owing to the new regulatory environment, several gas hubs
have nevertheless developed through Western Europe: Zeebrugge in
Belgium, Bunde in Germany, Title Transfer Facility (TTF) in the
Netherlands (virtual)… The pricing at those spots reflects the supply
and demand situation. But, because they still welcome mainly large
industrial players, such trading hubs have reduced activity. Therefore,
they have a low liquidity, which allows for price manipulations (ESI,
2007). Neumann, Siliverstovs & von Hirschausen (2005, cited by
Robinson 2006) find for example that prices at Zeebrugge and Bunde
are not connected. Moreover, hub prices are much more volatile than
long-term contract rates. They display a seasonality trend, due to
climate conditions (a fall in demand during summer, a rise during the
winter) (ESI, 2007)
© Ifri 13R. Davoust / Gas Price Formation, Structure & Dynamics
3) LNG pricing
In Continental Europe, LNG imports rely on traditional long-term
contracts mainly from Algeria, and also from Nigeria or Trinidad. Price
is pegged to crude oil or oil products, but due to increasing
competition from pipeline gas, the indexation pattern for LNG tends to
follows the same structure as on-shore gas, with references to coal,
electricity… More generally, the liberalization process on the
Continent is making LNG pricing more competitive (ETC, 2007).
Figure n°6 clearly supports these facts. The pegging to crude
oil is obvious. Consequently, pipe import and LNG import display
similar price levels year after year. Siliverstives, l’Hegaret, Neumann
& von Hirschausen (2004) assert that this co-movement of LNG and
piped gas, caused by similar contract and price structure, provides
evidence of regional gas price integration in Continental Europe.
Moreover, price competitiveness of LNG relative to piped gas is
constantly improving: while in 1999, LNG deliveries were more
expensive than piped gas, LNG became cheaper in 2002; and by
2006, the LNG price was 6.62 $ / MBtu, piped gas costs
7.32 $ / MBtu.
Figure n°6: Gas imports average price in EU (1999-2006)
$/MBtu
14.
12.
EU pipe gas
10. import
8.0 EU LNG
6.0 import
4.0 Brent
2.0
0.0
99 00 01 02 03 04 05 06
year
Source: Energy P&T
© Ifri 14R. Davoust / Gas Price Formation, Structure & Dynamics
4) Retail prices
Figure n°7: Residential gas prices in EU member states (1998-2006)
40.00
Austria
35.00 Czech Republic
30.00 Denmark
Finland
25.00
France
$/MBtu
20.00 Greece
Hungary
15.00
Ireland
10.00 Italy
5.00 Netherlands
Poland
0.00
Slovak Repub-
98 99 00 01 02 03 04 05 06
lik
Spain
year
Source: Energy P&T
Figure n°8: Industrial gas prices in EU member states (1998-2006)
14.00
Czech Republik
12.00
Finland
10.00 France
Greece
8.00 Hungary
$/MBtu
6.00 Ireland
Italy
4.00 Netherlands
Poland
2.00
Portugal
0.00 Slovak Republik
98 99 00 01 02 03 04 05 06 Spain
year
Source: Energy P&T
Two main features emerge: since 1998, end-use prices have strongly
risen on average, and the price spread between member states has
even widened. On those two points, gas directives seem to have
more or less failed in the short term since the opening policy was
theoretically supposed to generate both lower prices and price
convergence. However, conjuncture factors, like the recent surge in
© Ifri 15R. Davoust / Gas Price Formation, Structure & Dynamics
international oil markets, account for the boost in retail gas prices
(final gas prices in the residential, industrial and power sector are
indeed based on the market value of substitutes, mainly fuel oil).
Moreover, the persistent price divergence across Europe has
a structural explanation, such as substantial differences in national
taxation (especially in the residential sector, where the percentage of
taxes ranges between 5% in the UK and 33% in Netherlands as of
2006). Recently, an important bias was introduced by the termination
of cross-subsidies between end-use sectors (large users would
indirectly finance small users). Put more simply, the gaps can be
linked to differences in transportation and distribution costs that are
included in the final price (for example, Eastern countries, closer from
Russia, bear lower transportation charges). Asche, Osmunden &
Tveteras (2002) justify the relative price discrepancy through Europe
by pointing to the natural complexity of gas import contracts, which
depend on a wide range of elements, including political risk and even
oil taxation.
However, Robinson (2007) analyses retail gas prices
trajectories in the long term inside the European Union. Based on a
sample of member states, he notices a long-run convergence of
national prices between 1978 and 2004, reflected by diminishing price
differentials over time.
5) The case of the United Kingdom
a) main features
Contrary to the Continent, which is still dependent on long-term
contracts, the British gas industry is fully liberalized. In this sense, it
follows closely the current North American paradigm, thus displaying
similar features: spot transactions, responsive short-term pricing and
gas-to-gas competition. But while Henry Hub represents a physical
spot, the National Balancing Point is a virtual point, an intangible
trading place which quotes prices for all gas passing through the
national grid according to a system of “entry-exit” rights (ETC, 2007).
Linked to the NBP, a futures market for gas has developed at the
International Petroleum Exchange.
b) price history and formation
The Natural Gas Act of 1986 triggered a large movement of
deregulation, by introducing Third Party Access and also by
terminating British Gas’s monopoly selling and monopsony buying of
gas. In the meantime, the electric power industry was liberalized in
1989. This relieved power plants from the obligation to use coal, thus
setting a more price-elastic demand for gas. In 1998, the supply of
© Ifri 16R. Davoust / Gas Price Formation, Structure & Dynamics
the residential sector was opened to free competition, which drove
down NBP rates (ETC, 2007).
Since then, trends of gas rates are more or less coupled with
the trajectory of alternate fuels (gas oil, heavy fuel oil). Thus, despite
the existence of a well-developed spot market for gas in the UK,
which theoretically involves an autonomous gas price formation
based on national fundamentals, figure n°9 establishes a correlation
between NBP prices and crude oil references over the recent period.
Figure n°9: Comparison between NBP spot, EU import and oil barrel
(1999-2006)
14.00
12.00
10.00
8.00
$/MBtu
6.00
4.00
2.00
0.00
99 00 01 02 03 04 05 06
year
Brent spot NBP average spot EU average pipe import
Source: BP, Energy P&T
Due to a recent decline in North Sea production, the United
Kingdom switched in 2004 from being a net exporter to a net
importer, and this led to a strengthening in British gas prices. Indeed,
as shown in figure n°9, the NBP rate suddenly soared from an
average of 4.46 $ / MBtu in 2004 to 7.38 $ in 2005. This price spike
can also be explained by a more temporary factor, namely the cold
winter of 2005/06.
Since 1998, the British gas sector is connected with the
Continent through the Interconnector, a pipeline linking the Bacton
Terminal with the Zeebrugge Hub in Belgium. The long-term export
contracts to the Continent include a clause that allows the supplier
arbitrage with spot prices in the UK. The price implications of the
Interconnector, which enables two-way gas flows, are displayed in
figure n°9. NBP spot rates and Continental contract prices show
common up and down trends over the period. Indeed, gas trade and
arbitrage through the Interconnector had the effect of setting a price
channel between British and Continental gas (the UK market had
previously remained isolated).
© Ifri 17R. Davoust / Gas Price Formation, Structure & Dynamics
More precisely, before 2004, NBP prices were lower than
Continental prices. These latter held as a ceiling to the UK market,
which was then still wide. Nevertheless, in October 2003, with
tensions emerging on British supply, Continental rates become a
lower limit to NBP quotes. However, due to the Interconnector, a price
equilibrium was set between the UK and the Continent (Maisonnier,
2005)
As recognized by the International Energy Agency (2002, cited
by Ferreira, Soares & Araujo, 2003), liberalization policies in the UK
have brought substantial benefits to consumers. Retail prices are
lower than the EU average, especially in the household sector.
6) Table of European gas prices
Wholesale prices (average import prices, except NBP = spot price)
($/Mbtu)
Year NBP EU AUT BEL FIN DEU IRL NLD ESP EU
pipe LNG
1999 1.58 1.88 - 2.06 2.02 1.86 2.14 1.99 1.63 2.00
2000 2.71 2.79 - 2.83 2.35 2.83 2.3 2.43 3.24 3.09
2001 3.17 3.51 3.55 3.52 2.58 3.64 2.67 3.13 3.93 3.54
2002 2.37 3.16 3.34 3.03 2.55 3.27 2.77 2.84 3.36 3.14
2003 3.33 3.91 4.06 - 3.21 4.03 3.08 3.57 4.28 3.63
2004 4.46 4.2 4.48 4.27 - 4.4 3.81 3.9 4.37 3.89
2005 7.38 5.33 5.87 - - - 4.42 4.95 5.45 5.1
2006 7.87 7.32 7.66 - - - - - 7.33 6.62
Source: BP, Energy P&T
© Ifri 18R. Davoust / Gas Price Formation, Structure & Dynamics
End-use prices (H = Households, I = Industry, P = Power Generation)
($/Mbtu)
Finland France Germany
Year H I P H I P H I P
1998 4.69 3.85 3.33 12.14 4.38 - 11.25 4.94 4.09
1999 4.34 3.56 2.99 10.77 4.09 - 10.61 4.49 3.87
2000 4.43 3.63 3.15 9.65 4.95 - 10.37 5.22 4.26
2001 6.14 3.50 3.03 11.19 5.48 - - - -
2002 5.60 3.53 3.03 11.82 5.07 - - - -
2003 6.94 4.41 3.78 14.49 6.72 - - - -
2004 7.49 4.73 4.04 15.12 7.28 - - - -
2005 8.28 5.28 4.60 16.40 9.17 - - - -
2006 9.79 6.89 6.20 19.64 11.45 - - - -
Source: BP, Energy P&T
Italy Netherlands
Year H I P H I P
1998 19.19 4.76 - 10.93 3.69 3.38
1999 17.73 - - 10.25 3.24 -
2000 - - - 9.98 4.63 -
2001 - - - 11.15 4.88 -
2002 - - - 12.70 4.57 -
2003 - - - 16.74 6.18 -
2004 21.62 8.35 - 18.96 - -
2005 22.87 9.77 - 22.23 - -
2006 26.02 12.62 - 24.99 - -
Source: BP, Energy P&T
© Ifri 19R. Davoust / Gas Price Formation, Structure & Dynamics
Spain United Kingdom
Year H I P H I P
1998 14.81 3.83 3.56 9.18 3.02 3.51
1999 13.35 3.65 3.33 8.92 2.86 3.19
2000 13.65 4.87 4.58 8.13 2.91 2.89
2001 14.11 4.89 - 7.96 3.90 3.09
2002 13.80 4.60 - 8.81 4.07 2.95
2003 16.51 5.67 - 9.77 4.58 3.60
2004 17.87 5.99 - 11.75 5.63 4.50
2005 19.02 7.06 - 13.38 8.30 5.96
2006 21.03 9.86 - 17.88 10.66 7.64
Source: BP, Energy P&T
© Ifri 20R. Davoust / Gas Price Formation, Structure & Dynamics
Asia
1) Gas sector overview
The current Asian market for gas is composed of Japan, Korea,
Taiwan, and for a few years, China and India. These countries import
from Malaysia, Indonesia, Australia, the Middle East and the United
States. The construction of an international pipeline grid being too
costly due to the specific geographical aspect of the Asian Continent,
importing economies are almost totally dependent on Liquefied
Natural Gas, supplied through medium and long-term contracts. In
Japan, there is a substantial coupling between gas and electricity
sectors, LNG purchases being mainly routed to electricity generators.
Because of this linkage, gas markets in Northeast Asia are vertically
integrated, although in Japan and Korea, a few juridical steps have
been made recently towards the opening of the retail supply (Skeer,
2004).
2) LNG price determination and evolution
in Asia
Liquefied Natural Gas import prices in the Pacific Basin are more
expensive by roughly 1 $ / MBtu compared with the Atlantic Basin.
This premium (the “Asian premium”) is due to long-haul shipping of
gas, high charges applied to the use of LNG terminals and lastly the
absence of competition from piped gas.
Since the 90’s, the Northeast Asian pricing formula is based
on the Japanese pattern, and is P=a+bX type. It is split between two
components: a base part (a), constant, set firmly by negotiation, and
a floating part, termed “escalator” (X), designed to reflect variations in
oil rates. Usually, a coefficient (“pass-through factor”, b, inferior to
unit) is used to integrate petroleum tendencies in the Liquefied
Natural Gas price.
A very common price escalator in the Asia Pacific region is the
Japanese Crude Cocktail (JCC), a basket of different crude oils
imported from the Middle East. Such a benchmark is another factor of
the Asian gas price premium: shipping crude oils from the Middle
© Ifri 21R. Davoust / Gas Price Formation, Structure & Dynamics
East to Japan is particularly expensive while, for example, European
gas prices are only linked to pre-burner competitive prices – mainly oil
products (Fujime, 2005).
Moreover, floor and capping mechanisms were introduced in
the pricing system in order to regulate the impact of barrel ups-and-
downs. This curving factor, which acts as a “shock absorber”, thus
mitigates the direct effect of higher or lower oil prices for the sake of
the buyer or seller (Suzuki). Nevertheless, with the emergence of tight
competition for LNG in Asia, those price limits have been softened or
eliminated (ETC, 2007).
For three decades, LNG pricing in Asia has been punctually
re-adjusted in line with the ups-and-downs in the oil market, in order
to maintain a financial compromise between importers and suppliers.
More precisely, the base price (a) and the pass-through factor (b)
were re-calculated (a being lowered and b raised, or conversely).
Over the recent period, with the barrel skyrocketing, the base price for
LNG has been set at a higher level in line with the new fundamentals
of the oil market, but the linkage coefficient to oil has been flattened in
order to reduce the potential effects of the barrel surge. Moreover, the
price-capping mechanism, by maintaining LNG quotes under a
certain threshold, has more or less led to a de facto decoupling from
petroleum conditions (ETC, 2007).
Figure n°10: LNG average import price in Japan (1986-2006)
$/MBtu
14
12
10
8 Japan LNG
import
6 Crude oil import cost
4 in Japan
2
0
86
05
06
87
88
89
90
91
92
93
94
95
96
97
98
99
00
01
02
03
04
year
Source: Energy P&T
The linkage to crude oil appears in figure n°10, and is
explained by the JCC reference in the LNG pricing formula. However,
since 2002 and the oil price flare-up, purchase rates of LNG have
risen, but to a much lesser extent. This is due to moderating
instruments in the LNG price: price-capping, pass-through factor.
Geographically, China and India represent a convergence
point in Asian LNG pricing. Indeed, these countries started to import
LNG at a time when Asian demand for natural gas was still low
(beginning of 2000’s). Moreover, the important size of these two
© Ifri 22R. Davoust / Gas Price Formation, Structure & Dynamics
potential markets triggered an active competition between LNG
suppliers to penetrate them. In this context, Chinese and Indian
prices for LNG were negotiated at particularly low levels with a
weaker pegging to oil rates. Such prices still more or less prevail
despite the strengthening of hydrocarbon markets. Consequently,
when renewing their contracts, Northeast Asian LNG purchasers
target lower rates in accordance with Chinese prices. Importers also
invoke reduced LNG technical costs to obtain price cuts.
However, gas price determination in Asia should become
more and more competitive due to the diversification of LNG import
sources, densification of gas infrastructures (new terminals and
pipelines projects), multiplication of players at different levels of the
supply chain (from the exporting country to the end-user), and
increased pressure from competing fuels in electricity generation
(clean coal and nuclear).
3) End-use prices
Contrary to the case of United States or Europe where wholesale and
retail trends are coupled, there is an important dichotomy between
import and end-use rates in Japan. In figures n°11 & 12, one notices
the particularly high level of quotes applied to households, which are
by far the most expensive of the three global regions. For example,
during 2006, households would pay 13.34 $ / Mbtu on average in the
US, while they would be charged more than 34 $ in Japan.
© Ifri 23R. Davoust / Gas Price Formation, Structure & Dynamics
Figure n°11: Sectoral end-use gas prices and crude oil prices in Japan
(1985-2000)
Source: International Energy Agency, provided by Skeer, 2004
Figure n°12: End-use gas prices in Japan
40.
35.
30.
25. Industry
20. Residential
$/MBtu
15. LNG
10.
5.0
0.0
98 99 00 01 02 03 04 05 06
year
Source: Energy P&T
In fact, retail price structure in Japan can be explained by the
industrial organization, in other words by a differentiated access point
to gas. Residential or commercial customers, who can be supplied
only through the final distribution grid, pay both transmission and
distribution charges. Industrial users, who can connect directly to
high-pressure pipelines, pay only transmission charges (which are
rather high charges). Electric utilities usually receive gas deliveries at
© Ifri 24R. Davoust / Gas Price Formation, Structure & Dynamics
their own LNG terminals, and therefore bear lower costs. As a
consequence, retail prices for electricity are closely linked to the trend
of crude oil (figure n°11), while industrial and residential rates,
including substantial transmission and distribution charges, are more
loosely linked to the barrel. Finally, in Japan, gas prices for electricity
are twice lower than gas for industry, which is itself twice or three
times cheaper than residential tariffs (Skeer, 2004).
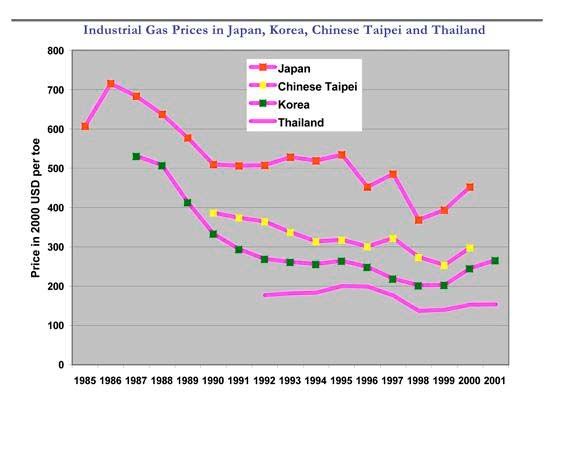
However, as shown in figure n°13, there is an important
variability in end-use prices throughout Asia. In the case of
households, distribution charges can vary substantially from one
country to another, leading to ranges in residential rates (Skeer,
2004).
Figure n°13: Industrial gas prices in Japan, Korea, Chinese Taipei
and Thailand
Source: International Energy Agency, provided by Skeer, 2004
© Ifri 25R. Davoust / Gas Price Formation, Structure & Dynamics
4) Northeast Asian gas prices
Table of Northeast Asian Gas Prices ($ / Mbtu)
Japan Korea
LNG* Industry Power LNG* Industry Power
Year
House G House G
holds holds
1998 29.68 9.89 - - - - -
1999 3.18 33.24 10.72 - 3.15 - - -
2000 4.73 35.95 12.58 - 2.04 - - -
2001 4.64 32.45 11.29 - 4.95 - - -
2002 4.32 30.18 9.92 - 4.41 - - -
2003 4.82 33.20 10.69 - 5.03 - - -
2004 5.23 35.32 10.90 - 5.74 12.62 9.50 8.14
2005 6.04 34.60 11.15 - 6.96 14.67 10.90 10.20
2006 7.18 34.40 12.09 - 8.75 17.82 13.76 13.25
*average import price
Source: Energy P&T
© Ifri 26R. Davoust / Gas Price Formation, Structure & Dynamics
Conclusions
First of all, we noted the fundamental importance of regulation in gas
pricing. Price efficiency, levels, transparency and the related social
welfare varies substantially between the USA, the UK, Continental
Europe and Northeast Asia since those regions are simply situated at
different stages of the liberalization movement. In other words, they
are at different points in the temporal evolution towards a freed gas
market, along an East-West axis:
Northeast Asia is in the first stages of the
liberalization process, although measures or trends
have been recently taken in this direction. A more
deregulated sector could emerge during the 2010’s.
Continental Europe, where the gas market has
been legally opened since the 2000’s, is still in the
long-term transition between an old, rigid, regulated,
monopolistic model and the targeted competitive
situation.
Then, the United Kingdom, whose gas market
has been open since the 90’s, is obviously more
advanced in the deregulation procedure, but structural
improvements still need to be done, such as increasing
the liquidity at the National Balancing Point.
Finally, North America, liberalized since the
80’s, is by far the most competitive area: gas market
opening is now complete, and the market for gas is
nearly a “total market”. The American gas sector
represents a paradigmatic target for European and
Asian markets.
In the United States, the liberalization movement proved
pragmatically a success: US gas tariffs are converging, and are
currently lower than in the rest of the world. Gas pricing is essentially
intra-sectoral, but alternate energies like oil and coal still play a price
regulator, according to the economic rule of substitutable goods on
the consumer’s side. Despite the existence of a regulatory framework
favorable to gas-to-gas competition and moderate prices, the recent
emergence of physical constraints (declining domestic resources,
rising import needs) should raise US gas prices in the future.
© Ifri 27R. Davoust / Gas Price Formation, Structure & Dynamics
In Europe, the case seems more complicated. It is maybe too
early to assess the final effect of the directives on gas prices. The
recent upwards bias induced by the third oil shock furthermore
complicates the legibility of gas price trajectories. At its core, there is
a technical, economic, juridical and fiscal disparity of gas sectors
throughout the Continent. Despite decisive steps made towards a
single gas market, this complexity of the European gas world might
delay retail price harmonization in the short-term.
There is a common agreement that indexation of European
prices on oil products should still prevail in the near future, because
traditional long-term contracting represents for players an essential
way to secure gas transactions (reservation of transportation
capacities…). But owing to higher flexibility requirements and the
growing use of gas in electricity production, the oil reference should
be less determining. More relevant indicators, like gas spot prices at
various hubs or power quotes could play an increased role. Moreover,
contract prices should coexist with spot prices in the landscape of the
coming decades, considering the forecasted importance of spot hubs
in European gas.
Concerning price levels in Europe, high rates could be
persistent due to a strengthened structural dependence on external
imports. However, competitive pressures generated by deregulation,
entry of multiple players at different stages of the value chain and
geographical diversification of import sources should maintain gas
prices in bearable limits.
Regarding Asia, gas price levels are rather expensive due to a
long geographical distance between producing regions and
consuming locations, which indeed involves high transportation costs.
The Asian pricing system is particularly rigid, so a lot of additional
welfare can be expected from liberalization policies. In any case,
multilateral competitive pressures following the rising importance of
Asia in international gas should naturally generate improved market
efficiency. Substantial price cuts can also be obtained through
technological progress in the production and transportation of LNG.
Nevertheless, despite an active diversification of supplying sources,
the boosting Asian LNG demand, fueled by China or India, might
generate a spike in LNG prices inside this region
We turn now to the second question asked in the introduction
of this paper: is a global price for natural gas emerging? This issue is
directly related to the case of LNG, since LNG shipped through
maritime tankers allows for intercontinental gas trade (LNG becomes
very competitive compared with piped gas over long distances).
Continuously declining LNG costs should furthermore reinforce
international LNG trade and arbitrage.
Currently, there is important LNG arbitrage between the
United States and Europe. With Africa and the Middle East becoming
significant suppliers of LNG, an arbitrage activity is also developing
between the Atlantic Basin and the Asia Pacific Basin. Siliverstives,
© Ifri 28R. Davoust / Gas Price Formation, Structure & Dynamics
l’Hegaret, Neumann & von Hirschausen (2004) thus mentions co-
movements between LNG import prices in Europe and in Japan by
2004. Nevertheless, North American price moves slightly differently
than in other regions. Figure n°14 confirms the integration of LNG
quotes between Europe and Japan, and the existing split with North
American prices. However, by 2006, one observes a price
convergence and equalization between the three LNG regions: LNG
average import cost is 6.62 $ / MBtu in Europe, 7.05 $ in the US and
7.18 $ in Japan.
Figure n°14 LNG average import price
(1999 2006)
9.00
8.00
7.00
$/ 6.00 US
Mbtu 5.00 Europe
4.00
3.00 Japan
2.00
1.00
0.00
99 00 01 02 03 04 05 06
year
Source: Energy P&T
In Europe and the US, LNG represents a small portion of the
natural gas supply. This tends to restrict LNG arbitrage in its ability to
transmit price signals and initiate a gas price harmonization between
regional markets. Moreover, international spot arbitrage might be
limited by the persistence of long-term contracting as a mean to
secure LNG capital investments.
Finally, there is a widespread feeling that, rather than a single
world gas price, we might observe correlations or convergences
between regional prices within the next several years. Of course, this
doesn’t preclude the thesis of a unique gas price in the long-term.
The dollar, invoicing currency in international trade, has been
the unit mainly used in gas imports to the United States, Europe and
Asia. In the recent context of the dollar depreciation, the United
States suffers relatively more from the recent surge in purchase
prices than Europe and Asia, where the rise can be partly eliminated
through currency translation (such a situation prevails more generally
in the hydrocarbons market). Thus, the United States could partly
loose their natural price advantage over other gas regions for
monetary reasons (unfavorable exchange rate), combined with
sectoral ones (higher dependence on external imports) and also due
to globalization (more price channels between regions).
© Ifri 29R. Davoust / Gas Price Formation, Structure & Dynamics
Concerning the European Union, gas import contracts should
be increasingly expressed in euros, as the dollar becomes less
relevant. In the meantime, exporting countries (especially inside the
Middle East) tend to diversify their selling currencies beyond the
dollar. Indeed, they opt for stronger currencies, intending to cushion
their revenue shortfall caused by the dollar depreciation.
© Ifri 30R. Davoust / Gas Price Formation, Structure & Dynamics
Bibliography
ARAUJO, M., P. FERREIRA & I. SOARES, “Liberalisation,
consumption heterogeneity and the dynamics of energy prices”,
Energy Policy, vol. 33, n° 17, November 2005, pp. 2244-2255
ASCHE, F., P. OSMUNDEN & R. TVETERAS, “European
market integration for gas? Volume flexibility and political risk”,
Energy Economics, vol. 24, n° 3, May 2002, pp. 249-265
AUSTVIK, O. G., “Gas pricing in a liberalized European
market; will the rent be taxed away?”, Energy Policy, vol. 25, n° 12,
1997, pp. 997-1012
BALL, A., “Asia Pacific LNG Market”, Australian Commidities,
vol.12, n°2, June 2005,
BESSLER, D., H. PARK, & J. MJELDE, “Price interactions
and discovery among natural gas spot markets in North America”,
Energy Policy, vol. 36, n° 1, January. 2008, pp. 290-302
CHEVALIER, J.-M., “Détermination du Prix du Gaz Naturel”, in
Maurice J. (dir.), Rapport « Prix du pétrole », Complément G,
pp. 147-150, Paris, Conseil d’analyse économique/La Documentation
Française, 2001
DALE, L., G. WONG-PARODI & A. LEKOV, “Comparing price
forecast accuracy of natural gas models and futures markets”, Energy
Policy, vol. 34, n° 18, December 2006, pp. 4115-4122
ENG, G., “A Formula for LNG pricing”, Ministry of Economic
Development, New-Zealand, May 2006,
FELDER, F. A., “Modelling natural gas prices as a random
walk: The advantages for generation planning”, The Electricity
Journal, vol. 8, n° 9, November 1995, pp. 61-67
FESHARAKI, F., K. WU & S. BANASZAK, Natural Gas: The
Fuel of the Future in Asia, Hawai, East West Center,
2000,
FISHHAUT, E., “LNG makes headway”, Global View, 2005,
© Ifri 31R. Davoust / Gas Price Formation, Structure & Dynamics
FUJIME, K., LNG Market and Price Formation in East Asia,
Tokyo, Institute of Energy Economics, Japan, 2002,
GALLON, S., “Les Perspectives du Marché du Gaz en
Europe”, in Maurice J. (dir.), Rapport « Prix du pétrole », Complément
H, pp. 151-170, Paris, Conseil d’analyse économique/La
Documentation Française, 2001
JOHNSSON, F. & J. KJARSTAD, “Prospects of the European
gas market”, Energy Policy, vol. 35, n° 2, February 2007, pp. 869-888
L’HEGARET, G., A. NEUMANN, B. SILIVERSTOVS & C.
VON HIRSCHHAUSEN, “International market integration for natural
gas? A cointegration analysis of prices in Europe, North America and
Japan”, Energy Economics, vol. 27, n° 4, July 2005, pp. 603-615
LIEN, D. & T. ROOT, “Convergence to the long-run
equilibrium: the case of natural gas markets”, Energy Economics
vol. 21, n° 2, November 1999, pp. 95-110
MACAVOY, P. & N. MOSHKIN, “The new trend in long-term
price of natural gas”, Resource & Energy Economics, vol. 22, n° 4,
October 2000, pp. 315-338
MAISONNIER, G., “The ties between natural gas and oil
prices,” Panorama 2006, Natural gas: what growth, for what markets,
as regards high oil prices?, Rueil-Malmaison, IFP, 2006,
MORITA, K., LNG: Falling Price and Increasing Flexibility of
Supply, Tokyo, Institute of Energy Economics, Japan, March 2003,
ROBINSON, T., “Have European gas prices converged?”,
Energy Policy, vol. 35, n° 4, April 2007, pp. 2347-2351
SKEER, J., Asian LNG Trade and Gas Market Reform:
Implications for Gas and Power Consumers, Oxford, Oxford Institute
for Energy Studies, NG 6, November 2004,
SUZUKI, T., Future LNG price in Asian Market, Tokyo,
Institute of Energy Economics, Japan, 2006,
WIDDERSHOVEN, C. “LNG ruling the world? OPEC loosing
grip”,
“Natural Gas Prices,” BP Statistical Review of World Energy
2007,
“Putting a Price on Energy: International Pricing Mechanisms
for Oil and Gas,” Energy Charter Secretariat, March 2007, Energy
Charter Treaty,
© Ifri 32You can also read