GasLog Partners LP Q2 2019 Results Presentation - July 25, 2019
←
→
Page content transcription
If your browser does not render page correctly, please read the page content below
GasLog Partners LP
Q2 2019 Results Presentation
July 25, 2019
2
                   Forward-Looking Statements
All statements in this presentation that are not statements of historical fact are “forward-looking statements” within the meaning of the U.S. Private Securities Litigation Reform Act of 1995. Forward-looking statements include
statements that address activities, events or developments that the Partnership expects, projects, believes or anticipates will or may occur in the future, particularly in relation to our operations, cash flows, financial position,
liquidity and cash available for dividends or distributions, plans, strategies, business prospects and changes and trends in our business and the markets in which we operate. We caution that these forward-looking statements
represent our estimates and assumptions only as of the date of this press release, about factors that are beyond our ability to control or predict, and are not intended to give any assurance as to future results. Any of these
factors or a combination of these factors could materially affect future results of operations and the ultimate accuracy of the forward-looking statements. Accordingly, you should not unduly rely on any forward-looking
statements.
Factors that might cause future results and outcomes to differ include, but are not limited to, the following:
▪   general LNG shipping market conditions and trends, including spot and multi-year charter rates, ship values, factors affecting supply and demand of LNG and LNG shipping, technological advancements and opportunities for
    the profitable operations of LNG carriers;
▪   fluctuations in charter hire rates and vessel values;
▪   our ability to secure new multi-year charters at economically attractive rates;
▪   our ability to maximize the use of our vessels, including the re-deployment or disposition of vessels which are not under multi-year charters, including the risk that certain of our vessels may no longer have the latest
    technology at such time which may impact the rate at which we can charter such vessels;
▪   changes in our operating expenses, including crew wages, maintenance, dry-docking and insurance costs and bunker prices;
▪   number of off-hire days and dry-docking requirements including our ability to complete scheduled dry-dockings on time and within budget;
▪   planned capital expenditures and availability of capital resources to fund capital expenditures;
▪   fluctuations in prices for crude oil, petroleum products and natural gas;
▪   fluctuations in exchange rates, especially the U.S. dollar and Euro;
▪   our ability to expand our portfolio by acquiring vessels through our drop-down pipeline with GasLog or by acquiring other assets from third parties;
▪   our ability to leverage GasLog’s relationships and reputation in the shipping industry;
▪   the ability of GasLog to maintain long-term relationships with major energy companies and major LNG producers, marketers and consumers;
▪   GasLog’s relationships with its employees and ship crews, its ability to retain key employees and provide services to us, and the availability of skilled labor, ship crews and management;
▪   changes in the ownership of our charterers;
▪   our customers’ performance of their obligations under our time charters and other contracts;
▪   our future operating performance, financial condition, liquidity and cash available for distributions;
▪   our ability to obtain financing to fund capital expenditures, acquisitions and other corporate activities, funding by banks of their financial commitments, funding by GasLog of the revolving credit facility and our ability to
    meet our restrictive covenants and other obligations under our credit facilities;
▪   future, pending or recent acquisitions of ships or other assets, business strategy, areas of possible expansion and expected capital spending;
▪   risks inherent in ship operation, including the discharge of pollutants;
▪   any malfunction or disruption of information technology systems and networks that our operations rely on or any impact of a possible cybersecurity event;
▪   the expected cost of and our ability to comply with environmental and regulatory conditions, including changes in laws and regulations or actions taken by regulatory authorities, governmental organizations, classification
    societies and standards imposed by our charterers applicable to our business;
▪   potential disruption of shipping routes due to accidents, political events, piracy or acts by terrorists;
▪   potential liability from future litigation; and
▪   other risks and uncertainties described in the Partnership’s Annual Report on Form 20-F filed with the SEC on February 26, 2019, available at http://www.sec.gov.
We undertake no obligation to update or revise any forward-looking statements contained in this presentation, whether as a result of new information, future events, a change in our views or expectations or otherwise, except
as required by applicable law. New factors emerge from time to time, and it is not possible for us to predict all of these factors. Further, we cannot assess the impact of each such factor on our business or the extent to which
any factor, or combination of factors, may cause actual results to be materially different from those contained in any forward-looking statement.
The declaration and payment of distributions are at all times subject to the discretion of our board of directors and will depend on, amongst other things, risks and uncertainties described above, restrictions in our credit
facilities, the provisions of Marshall Islands law and such other factors as our board of directors may deem relevant.
3
                           GasLog Partners’ Q2 2019 Highlights

     ▪ Highest-ever quarterly Partnership Performance Results(1) for Revenues and EBITDA(2),
       increasing 23% and 27%, respectively, compared with Q2 2018
     ▪ Closed acquisition of the GasLog Glasgow from GasLog Ltd. (“GasLog”) for $214.0
       million, with attached multi-year charter to a subsidiary of Royal Dutch Shell plc (“Shell”)
     ▪ Successfully re-chartered the GasLog Shanghai for three-and-a-half years with a
       subsidiary of Gunvor Group Ltd. (“Gunvor”)
     ▪ Reduced expected cost of capital by eliminating the GasLog’s incentive distribution
       rights (“IDRs”) for 2,532,911 common units plus 2,490,000 Class B units
     ▪ Repurchased 476,351 common units at an average price of $20.81 per unit for a total
       amount of $9.9 million
     ▪ Cash distribution of $0.55 per common unit for the second quarter, unchanged from Q1
       2019 and 3.8% higher than Q2 2018
                    ‒ Distribution coverage ratio(3) of 1.10x or 1.16x adjusted for dry-docking of Solaris
     ▪ Reiterating 2% - 4% distribution growth guidance for 2019

1. Partnership Performance Results represent the results attributable to GasLog Partners which are non-GAAP financial measures.
2. EBITDA is a non-GAAP financial measures, and should not be used in isolation or as a substitute for GasLog Partners’ financial results presented in accordance with International Financial Reporting Standards (“IFRS”). For the definition and reconciliation
   of this measure to the most directly comparable financial measure calculated and presented in accordance with the Partnership Performance Results, please refer to the Appendix to these slides.
3. Distribution coverage ratio represents the ratio of Distributable cash flow to the Cash distribution declared.
4
                     GasLog Partners: A Differentiated LNG MLP

                                             85   US Listed MLPs

                                             41   Alerian MLP Index + Marine LNG MLPs

                                             8    Form 1099, No K-1

                                             5    Pure Play LNG Infrastructure MLPs

                                             2    Recent Distribution Growth

                                             1    EBITDA CAGR Since IPO > 35%

                                             1    No IDRs

Source: MLPA, Alerian, Bloomberg
5
Success In Re-Chartering Our Fleet…
Vessel GasLog Santiago Vessel GasLog Sydney
Start Date August 2018 Start Date December 2018
Duration 3.5 years plus extension options Duration 18 months plus extension options
Methane Jane Elizabeth or
Vessel
Methane Alison Victoria
Start Date November or December 2020
Duration 1 year plus extension options
Vessel GasLog Shanghai
Start Date June 23, 2019
Duration Approximately 3.5 years
Vessels 12 Charter Rate Variable with a floor and a ceiling
Duration Expiring 2019-2026 Utilization 100%
Four New Charters To Three New Customers Since Q1 20186
…Increases Our Backlog And Charter Coverage
GasLog Partners’ Revenue Backlog ($B)(1) 2019 and 2020 % Of Contracted Days(1)
Average Charter Duration Of Approximately 3 Years
1. As of June 30, 20197
IDR Elimination Reduces Expected Cost Of Capital
IDR Elimination Transaction Transaction Highlights
Effective Date June 30, 2019
▪ Immediately accretive to DCF per LP unit
▪ Cash flow neutral to GLOG and GLOP
Q1 19 IDR Payment
$5.6 million
Annualized ▪ Reduces expected cost of capital
2,532,911 common units
Consideration ▪ Enhances potential accretion from future acquisitions
2,490,000 Class B units
No voting rights, distributions or ▪ Strengthens GP/LP alignment
Class B Rights earnings until conversion into
common units
415,000 units per annum on July 1, GasLog Partners Dropdown Pipeline
Class B Conversion
2020, 2021, 2022, 2023, 2024 and
Schedule 2025
14,376,602 Common units
GLOG Ownership In
2,490,000 Class B units
GLOP (Units) 1,021,336 GP units
GLOG Ownership (%) 35%
Public Ownership
33,178,801 Common units
(Units)
Public Ownership (%) 65%Highest-Ever Partnership Performance Results(1) For 8
Revenues And EBITDA
% change % change
(US$,000 unless otherwise stated) Q2 2018 Q1 2019 Q2 2019
vs Q2 2018 vs Q1 2019
Revenues 74,909 86,325 91,805 23% 6%
GasLog Shanghai net pool performance (1,081) 3,442 1,938 - -
OPEX 15,110 17,118 18,548 23% 8%
Ownership days (ex. Solaris) 1,067 1,170 1,274 19% 9%
Unit OPEX (US$ per vessel per day) 14,161 14,631 14,559 3% (0%)
EBITDA(1) 53,260 62,901 67,503 27% 7%
Distributable cash flow(2) 22,915 27,608 29,399 28% 6%
Quarterly Cash Distribution ($/unit) $0.53 $0.55 $0.55 4% 0%
Annualized Cash Distribution ($/unit) $2.12 $2.20 $2.20 4% 0%
Distribution Coverage Ratio 0.94x 1.03x 1.10x
Adjusted Distribution Coverage Ratio(3) 1.18x 1.03x 1.16x
1. Partnership Performance Results repsent the results attributable to GasLog Partners which are non-GAAP financial measures
2. EBITDA and Distributable cash flow are non-GAAP financial measures, and should not be used in isolation or as a substitute for GasLog Partners’ financial results presented in accordance with International Financial Reporting
Standards (“IFRS”). For the definition and reconciliation of these measures to the most directly comparable financial measure calculated and presented in accordance with the Partnership Performance Results, please refer to the
Appendix to these slides.
3. Excludes the impact of the scheduled dry-dockings of GasLog Santiago and GasLog Sydney in Q2 2018 and the Solaris in Q2 2019.Debt Amortizing At Twice The Rate Our Ships 9
Depreciate Builds Balance Sheet Capacity For Growth
Example: Impact Of GasLog Glasgow’s Debt Profile On Its Vessel-Level Pro Forma Credit Metrics
Vessel GasLog Glasgow
Charter Period / Customer June 2026 to Shell
Estimated NTM EBITDA(2) $23.5 million
Debt Assumed $134.1 million
Total Scheduled Amortization (2019-2020)
1. EBITDA is a non-GAAP financial measure, and should not be used in isolation or as a substitute for GasLog Partners’ financial results presented in accordance with International Financial Reporting Standards (“IFRS”). For the definition and reconciliation
of these measures to the most directly comparable financial measure calculated and presented in accordance with IFRS, please refer to the Appendix to these slidesGasLog Glasgow Acquisition And New GasLog Shanghai 10
Charter Enhance Our Revenue And Cash Flow Visibility
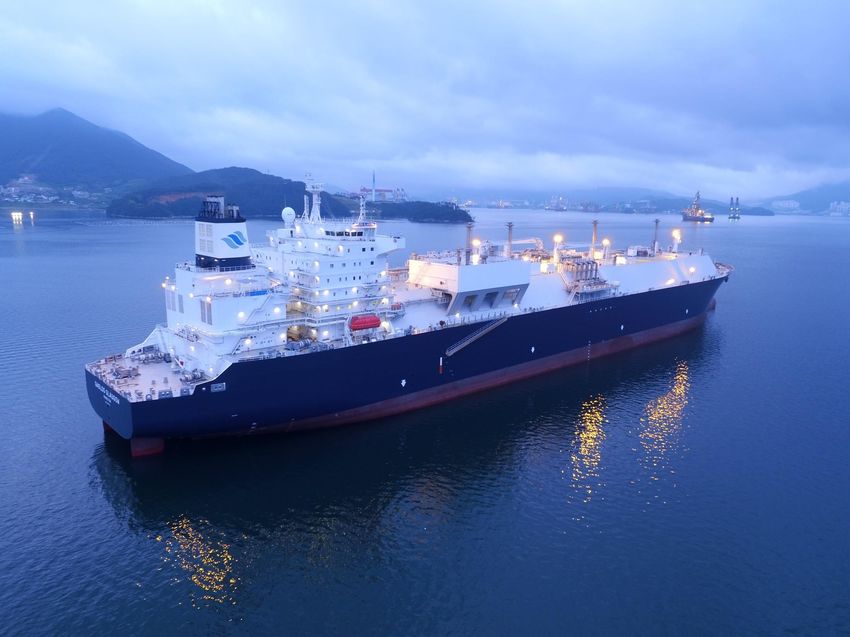
GasLog Partners Fleet*
No Additional Dropdowns Required To Meet Our 2-4% Distribution Growth Guidance For 2019
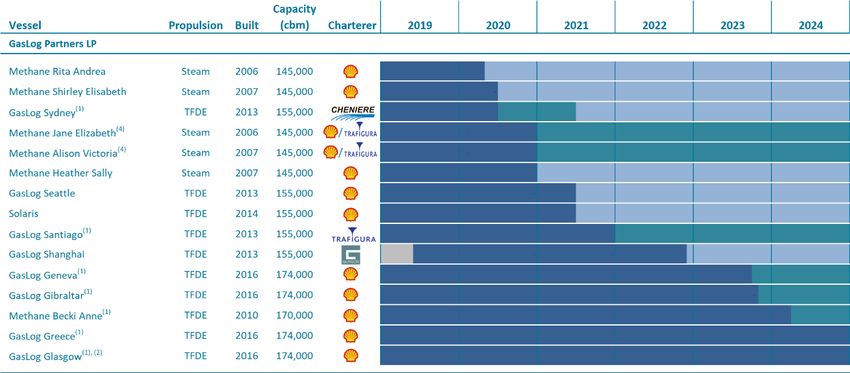
* Please refer to the Appendix of this presentation for notes pertaining to GasLog Partners’ fleetOver $280 Million In Annualized EBITDA In Our 11
Dropdown Pipeline
Dropdown Pipeline At GasLog Ltd.*
Average Charter Duration Of Approximately 8 Years
* Please refer to the Appendix of this presentation for notes pertaining to GasLog Ltd.’s fleet12
LNG Demand Continues To Increase…
LNG Demand (MT) By Country On Trailing 12-Month Basis
LNG Demand Demand from top 10
Q3 17 – Q2 18: 304 million tonnes countries increased by 42
mtpa year-over-year,
Q3 18 – Q2 19: 342 million tonnes
representing 55% growth
YoY increase: 13%
Source: Poten13
…And Forecasted Demand Growth Is Globally Diverse
LNG Demand Growth 2018-2025 (MT)
Over 80% Of Forecasted Demand Growth Is Outside Of China During 2018-25
Source: Wood MackenzieExpected LNG Supply Growth Through 2024 14
Underpinned By US Production And Recent FIDs
Actual And Expected LNG Capacity Additions Q2 18-2024
FID in 2018 / 19
▪ At least 107 mtpa of new liquefaction capacity is scheduled to come online during 2019-24
‒ Approximately 60% of new capacity is located in the US
▪ Approximately 55 mtpa of new capacity has been sanctioned in the last 12 months
▪ Wood Mackenzie anticipates 45 mtpa of additional LNG capacity to be sanctioned by end 2019
Source: Wood MackenzieUS Exports Of LNG Continue To Support A Shipping 15
Multiplier In Excess of Historical Levels
Q2 19 US LNG Export Destinations(1) US Exports And Shipping Multiplier Q1 16 – Q2 19(2)
▪ The US exported 116 cargoes in Q2 2019, compared with 75 in Q2 2018 and 110 in Q1 2019
– 28% of US exports were delivered to Asia, despite limited arbitrage between Atlantic and Pacific gas prices
– Approximately 50% of long-term LNG supply agreements out of the US are to buyers in Asia
▪ Since the start of US exports, approximately 1.8 ships have been needed for each 1 mtpa of US supply,
compared to a historical global average shipping multiplier of 1.3x
1. Numbers represent the number of cargoes imported to each country
2. Normalised to a vessel capacity of 160,000 m3
Source: Poten16
LNG Shipping Demand Expected To Increase
Projected LNGC Vessel Supply & Demand Balance (160k CBM Vessel Equivalent)
Vessel Demand
(LNG Demand(1) @ 2.0x US & 1.35x RoW)
Vessel Supply
(no scrappages)
Vessel Demand
(LNG Demand(1) @ 1.6x US & 1.25x RoW)
1. Projected LNG Vessel Demand high and low cases are based on Wood Mackenzie LNG Demand(3) (4) forecast and the respective vessel-to-volume multipliers, as annotated in the chart legend
2. Projected LNG Vessel Demand are based on Wood Mackenzie LNG Supply(3) (4) forecast and the respective vessel-to-volume multipliers, as annotated in the chart legend
3. Demand breakdown between US and Rest of World (RoW) is based on Wood Mackenzie supply estimates
4. Annual Wood Mackenzie demand & supply forecasts assumed to increase quarterly on a linear basis
Source: Wood Mackenzie, PotenSpot Rates This Year Have Followed Their Historic 17
Seasonal Pattern…
Average Monthly Headline TFDE Spot Rate Average Monthly Headline TFDE Spot Rate (2011-18)
Clarksons Currently Assessing TFDE Spot Rates At $64,000/Day
Source: Clarksons…While Multi-Month / Multi-Year Charter Activity And 18
Time Charter Rates Have Increased
Avg Quarterly Headline TFDE Spot / 1-Yr TC Rate ($/Day) v. Number Of Fixtures Between 6 Months And 7 Years
Poten Currently Assess 1-Year Time Charter For TFDEs At $85,000/Day
Source: Clarksons, Poten19
Distribution Growth History And Guidance
Trailing 12-Month Capital Return Q2 2019 Distribution 2019 Distribution Guidance
$25 Million Unit Buyback Programme Provides Additional Source Of Capital Return20
Review And Outlook
Continued commercial success, with four new charters to three new
1
customers since Q1 2018
IDR elimination, 13 vessel dropdown pipeline and access to debt and
2
equity capital support our future growth
4% distribution growth over Q2 2018, and reiteration of distribution
3
growth guidance of 2% to 4% for 2019
New liquefaction and strong LNG demand support improving LNG
4 shipping market and re-chartering opportunitiesAPPENDIX
22
             Non-GAAP Reconciliations

Non-GAAP Financial Measures:

EBITDA is defined as earnings before interest income and expense, gain/loss on derivatives, taxes, depreciation and amortization. EBITDA, which is a non-GAAP
financial measure, is used as a supplemental financial measure by management and external users of financial statements, such as investors, to assess our financial
and operating performance. The Partnership believes that this non-GAAP financial measure assists our management and investors by increasing the comparability of
our performance from period to period. The Partnership believes that including EBITDA assists our management and investors in (i) understanding and analyzing the
results of our operating and business performance, (ii) selecting between investing in us and other investment alternatives and (iii) monitoring our ongoing financial
and operational strength in assessing whether to purchase and/or continue to hold our common units. This increased comparability is achieved by excluding the
potentially disparate effects between periods of financial costs, gain/loss on derivatives, taxes, depreciation and amortization, which items are affected by various
and possibly changing financing methods, financial market conditions, capital structure and historical cost basis, and which items may significantly affect results of
operations between periods.

EBITDA has limitations as an analytical tool and should not be considered as an alternative to, or as a substitute for, or superior to, profit, profit from operations,
earnings per unit or any other measure of operating performance presented in accordance with IFRS. Some of these limitations include the fact that it does not
reflect (i) our cash expenditures or future requirements for capital expenditures or contractual commitments, (ii) changes in, or cash requirements for, our working
capital needs and (iii) the cash requirements necessary to service interest or principal payments, on our debt. Although depreciation and amortization are non-cash
charges, the assets being depreciated and amortized will often have to be replaced in the future, and EBITDA does not reflect any cash requirements for such
replacements. It is not adjusted for all non-cash income or expense items that are reflected in our statement of cash flows and other companies in our industry may
calculate this measure differently to how we do, limiting its usefulness as a comparative measure. EBITDA excludes some, but not all, items that affect profit or loss
and these measures may vary among other companies. Therefore, EBITDA as presented herein may not be comparable to similarly titled measures of other
companies.

Distributable cash flow means EBITDA, on the basis of the Partnership Performance Results, after considering financial costs for the period, including realized loss on
derivatives, interest rate swaps and forward foreign exchange contracts and excluding amortization of loan fees, lease expense, estimated dry-docking and
replacement capital reserves established by the Partnership and accrued distributions on preference units, whether or not declared. Estimated dry-docking and
replacement capital reserves represent capital expenditures required to renew and maintain over the long-term the operating capacity of, or the revenues
generated by, our capital assets. Distributable cash flow, which is a non-GAAP financial measure, is a quantitative standard used by investors in publicly-traded
partnerships to assess their ability to make quarterly cash distributions. Our calculation of Distributable cash flow may not be comparable to that reported by other
companies. Distributable cash flow has limitations as an analytical tool and should not be considered as an alternative to, or substitute for, or superior to, profit or
loss, profit or loss from operations, earnings per unit or any other measure of operating performance presented in accordance with IFRS.
23
Non-GAAP Reconciliations
GasLog Glasgow - Estimated NTM EBITDA
For the entity owning GasLog Glasgow, estimated EBITDA for the first 12 months of operation following the completion of the acquisition is based on the following assumptions:
• timely receipt of charter hire specified in the charter contract;
• utilization of 363 days per year and no drydocking;
• vessel operating and supervision costs and charter commissions per current internal estimates; and
• general and administrative expenses based on management’s current internal estimates.
GasLog and GasLog Partners consider the above assumptions to be reasonable as of July 25, 2019, but if these assumptions prove to be incorrect, actual EBITDA for the entity owning the vessel could differ
materially from our estimates. The prospective financial information was not prepared with a view toward public disclosure or with a view toward complying with the guidelines established by the
American Institute of Certified Public Accountants, but, in the view of management, was prepared on a reasonable basis and reflects the best currently available estimates and judgments. However, this
information is not fact and should not be relied upon as being necessarily indicative of future results, and readers of this document are cautioned not to place undue reliance on the prospective financial
information. Neither our independent auditors nor any other independent accountants have compiled, examined, or performed any procedures with respect to the prospective financial information
contained above, nor have they expressed any opinion or any other form of assurance on such information or its achievability and assume no responsibility for, and disclaim any association with, such
prospective financial information.
.24
Non-GAAP Reconciliations
1. The Partnership’s Q2 2014 results reflect the period from May 12, 2014 to June 30, 2014.
2. Includes realized loss / gain on interest rate swaps and excludes amortization of loan fees.
3. Refers to movement in reserves (other than the drydocking and replacement capital reserves) for the proper conduct of the business of the Partnership and its subsidiaries (including reserves for future capital expenditures and for anticipated future
credit needs of the Partnership and its subsidiaries).25
The GasLog Ltd. And GasLog Partners Fleets
1. The period shown reflects the expiration of the minimum optional period and the maximum optional period. The charterer of the GasLog Santiago may extend the term of this time charter for a period ranging from one to seven years, provided that the charterer
provides us with advance notice of declaration. The charterer of the GasLog Sydney may extend the term of this time charter for a period ranging from six to twelve months, provided that the charterer provides us with advance notice of declaration. The charterer of the
Methane Becki Anne and the Methane Julia Louise has unilateral options to extend the term of the related time charters for a period of either three or five years at their election, provided that the charterer provides us with advance notice of declaration of any option in
accordance with the terms of the applicable charter. The charterer of the GasLog Greece and the GasLog Glasgow has the right to extend the charters for a period of five years at the charterer’s option. The charterer of the GasLog Geneva and the GasLog Gibraltar has the
right to extend the charter by two additional periods of five and three years, respectively, provided that the charterer provides us with advance notice of declaration. The charterer of the GasLog Houston, the GasLog Genoa and the GasLog Gladstone has the right to
extend the charters by two additional periods of three years, provided that the charterer provides us with advance notice of declaration. The charterer of the GasLog Hong Kong has the right to extend the charter for a period of three years, provided that the charterer
provides us with advance notice of declaration. Endesa has the right to extend the charter of the GasLog Warsaw by two additional periods of six years, provided that the charterer provides us with advance notice of declaration.
2. On March 13, 2019, GasLog entered into an agreement with GasLog Partners to sale 100% of the shares in the entity that owns and charters the GasLog Glasgow. The sale closed on April 1, 2019.
3. “Total” refers to Total Gas & Power Chartering Limited, a wholly owned subsidiary of Total S.A.
4. On March 22, 2018, a new charter party agreement was signed with Trafigura Maritime Logistics PTE Ltd. (“Trafigura”) for either the Methane Jane Elizabeth or the Methane Alison Victoria (as nominated by the Partnership) commencing in either November or December
2019, at the Partnership’s option, until November or December 2020, with the charterer having the option to extend the charter from one to four years.
5. On February 24, 2016, GasLog’s subsidiary, GAS-twenty six Ltd., completed the sale and leaseback of the Methane Julia Louise with Lepta Shipping. Lepta Shipping has the right to on-sell and lease back the vessel. The vessel was sold to Lepta Shipping for a total
consideration approximately equivalent to its current book value. GasLog has leased back the vessel under a bareboat charter from Lepta Shipping for a period of up to 20 years. GasLog has the option to re-purchase the vessel on pre-agreed terms no earlier than the end
of year ten and no later than the end of year 17 of the bareboat charter. The vessel remains on its eleven-year-charter with MSL, a subsidiary of Shell.You can also read