Gehlen Bräutigam Capital - Small Caps. Great Value.
←
→
Page content transcription
If your browser does not render page correctly, please read the page content below
Gehlen Bräutigam Capital
                             Small Caps. Great Value.

Equities fund focused on deeply undervalued European micro & small caps
Gehlen Braeutigam Value HI
July 2019

                                Presentation suitable for professional investors and eligible counterparties.   Presentation suitable for professional investors and eligible counterparties.
Passionate value investors …
High-performing, experienced team

                                      Daniel Gehlen                                                                           Marc-Lennart Braeutigam

 •   2015 – 2017: Investment banking at Barclays in Frankfurt. Advised German and                •   2015 – 2017: Investment banking at Barclays in London. Origination and execution of
     European corporates as well as private equity investors on strategic decisions with a           equity capital markets transactions (IPOs, rights issues, block trades) for corporates as
     focus on mergers and acquisitions                                                               well as private equity investors in the German-speaking and broader EMEA region

 •   Previously, investment banking at Goldman Sachs, portfolio management (European             •   Previously, investment banking at UniCredit, portfolio management at a value investing
     small and mid cap equities) at Union Investment as well as equity and macro research            boutique and equity capital markets as well as equity research and equity sales at
     at DZ Bank                                                                                      Commerzbank

 •   Studied at London School of Economics (MSc Finance, 2015 best student of the year)          •   Co-op degree programme with Commerzbank at DHBW Stuttgart (BA Hons) and the
     and at Frankfurt School of Finance and Management (BSc) as well as Harvard                      University of California in San Diego, including two academic studies on value
     University and MIT                                                                              investing

                                                                                                                                Presentation suitable for professional investors and eligible counterparties.
                                                                                             1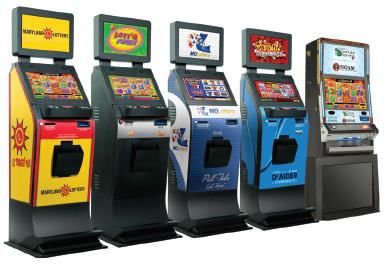
… focused on deeply undervalued European micro & small caps
Investment philosophy

                                    •   Actively managed public equities fund, focused on deeply undervalued European micro & small caps

                                    •   Bottom-up selection of single stocks

     What is the                    •   High conviction, concentrated portfolio consisting of 20 – 30 single stocks
       fund?                        •   Independent, not benchmark driven

                                    •   Alignment of interests through co-investments from Daniel Gehlen and Marc-Lennart Braeutigam

                                    •   Limitation of fund volume to c. € 100m (-R- & -I- class are currently open for investments)

                                    •    Long-term oriented deep value approach

                                    •    Focus on value characteristics and contrarian situations in idea generation process

                                    •    High effort in the selection of single stocks through in-depth due diligence
      How is it
                                    •    Supported by industry experts, including from own investor base
     managed?
                                    •    Tailor-made financial models, always based on conservative assumptions

                                    •    Buying at substantial fundamental undervaluation (safety margin of at least 30 – 40%)

                                    •    Investments only in industries and companies whose value drivers we can understand and reasonably predict

                                                                 Our goal is to profit from the highest possible value growth in the long-term

Note: The prospectus and other investor information about the Gehlen Braeutigam Value HI fund can be found at www.hansainvest.com.

                                                                                                                                                 Presentation suitable for professional investors and eligible counterparties.
                                                                                                                            2
We find value where others see none!
Differentiated positioning in the asset management landscape
    Growth

                                       “Small cap specialists”                                                    “Active core”
                                              Focus on                                                      Main playing field for most
                                         hidden champions                                                     institutional investors
    Quality

                                                                                      “Value specialists”
    Value

                      Gehlen Bräutigam Capital

                              “Sweet spot“
    Deep value

                                                                 “Distressed” and other
                                                                   specialized funds

                 Micro caps                  Small caps                 Mid caps                               Large caps                                                    Mega caps

Note: Own diagram.

                                                                                                                 Presentation suitable for professional investors and eligible counterparties.
                                                                            3
Why small & micro caps?
“Fish where the fish are!” – Unknown

                                           Presentation suitable for professional investors and eligible counterparties.
                                       4
Small & micro caps offer a rich hunting ground …
European equities (I/II)

                                                                  Approximately 85% of all listed companies in Europe are small or micro caps

                                                                                                                           3.6%
                                                                                                               12.7%

                                                                                                         6.3%

                                                                                                                                              77.4%

Segment                                       Market capitalisaton (€ bn)                       No. of companies                             % of companies                      Market capitalisaton (€ bn)                        Market capitalisation (%)

           Large caps                                        >10                                         264                                        3.6%                                         8,782                                            70.0%

           Mid caps                                         1 – 10                                       925                                        12.7%                                        3,054                                            24.3%
                                                                                                                                     >5x
           Small caps                                      0.5 – 1                                       452                                        6.3%                                           324                                             2.6%

           Micro caps
… for mispriced investment opportunities
European equities (II/II)

                                       Average number of research analysts of banks / brokers per listed company by market capitalization (EUR)

      20

                                                                                                                                                                                                  16
      16

                                                                                                                                                         13

      12

                                                                                                                    9
                                   “Sweet spot”
       8

                                                                                                  5
                                                                          4
       4                                              3
                            2

       0
                        < 100m                    100m - 200m        200m - 500m              500m - 1bn         1bn - 3bn                          3bn - 5bn                                  > 5bn

                                             Our goal is to discover mispriced small and micro caps through our own independent analysis

Source: FactSet, as of 30 June 2017.

                                                                                                                         Presentation suitable for professional investors and eligible counterparties.
                                                                                          6
How do we identify undervalued equities?
“Small & micro caps from a refreshingly different perspective.” – Sven Hoppenhoeft*
* Managing Director, Pro BoutiquenFonds GmbH (previously: Department head of Vermögensverwalter Office, Joh. Berenberg, Gossler & Co. KG).
Presentation suitable for professional investors and eligible counterparties.
7Strong focus on net assets and current earnings power
Tailored deep value framework
Competitive advantages Barriers to entry
Market
Bargaining power
outlook/prediction
Positioning Profitability of growth
Corporate Visibility of
governance growth
Promising and
Hidden assets
innovative products
Further growth
Book value
potential & disruption
Safety Speculation
Margin of safety
“Prediction is very difficult, especially about the future.” – Niels Bohr
* Danish physicist and Nobel Prize winner.
Note: Our value framework is significantly influenced by B. Graham, B. Greenwald, H. Marks and S. Klarman.
Presentation suitable for professional investors and eligible counterparties.
8Structured multi-level approach
Investment process
1 2 3 4 5
Portfolio Decision making /
Idea generation Due diligence Valuation
construction Monitoring
Tailor-made Bottom-up selection of Structured decision
Value characteristics In-depth analyses
financial models ~20-30 stocks making process
Management, client & Conservative
Contrarian situations Not benchmark driven Team discussions
expert interviews assumptions
Adequate
Variety of sources Onsite visits High margin of safety Ongoing monitoring
diversification
We have a long-term investment horizon - and only invest in companies that we can understand and evaluate – “easy ones!”
Note: Own diagram.
Presentation suitable for professional investors and eligible counterparties.
9We uncover opportunities that others overlook
1. Idea generation
What are we looking for? How do we find what we are looking for?
Value characteristics Specialised value screens / filters Small & Micro Cap Research / Newsletters
Low P/B(2)
High returns
Low P/E(1)
on capital
Strong corporate
governance Hidden winners
Contrarian situations Access to management / IR(3) Network
Current losers Index Industry experts
Spin-offs exclusions
Pending litigations Crises Management Brokers
“Unlucky” Unpopular
IPOs Meetings & Fund managers Lawyers & bankers
sectors Further conferences
calls
We add ideas to our watchlist, from which we select the most promising situations for our in-depth due diligence process
(1) P/E = Price/earnings ratio. (2) P/B = Price/book ratio. (3) IR = Investor relations.
Presentation suitable for professional investors and eligible counterparties.
10Better understanding of our investments through in-depth analyses
2. Due diligence
Company analysis Market analysis Competitor analysis Meetings & field trips
~4-7 days ~2-3 days ~2-5 days ~2-5 days
Selected parts of the due diligence
Research on peers /
Financial statement analyses Market / industry outlook Field trips*
competitors
Very thorough due diligence: c. 10-20 days for each investment
Note: Own diagram. * Selected example: London Toy Fair visit in January 2019.
Presentation suitable for professional investors and eligible counterparties.
11The right price-to-value ratio makes the difference
3. Valuation
Tailor-made financial models … … based on conservative assumptions
1 Upside case
2 Conservative case
Margin of safety
Share price
3 Buy range
Downside case
• We discuss potential investments without regard to our egos – we always see each other as sparring partners, not competitors
• We only invest with a high margin of safety of at least 30 – 40%, based on conservative assumptions in our financial model
• Prior to an investment decision, we always assess and discuss the portfolio allocation of the single stock
“Anything can be a good idea at one price and time, and a bad one at another.” – Howard Marks
Note: Own diagram.
Presentation suitable for professional investors and eligible counterparties.
12Individual weighting of single stocks in a concentrated portfolio
4. Portfolio construction
What are we looking for on the single stock level?*
Margin of safety
Conviction Balance sheet quality
Cyclicality (fluctuation with the market) Company-specific risks
What we are looking for on the portfolio level?
• Bottom-up selection of absolutely attractive investment opportunities (never relative)
• Concentrated portfolio consisting of 20 – 30 single stocks
• Only invest in industries and companies whose value drivers we can understand (1)
• Appropriate diversification across regions and industries
• Active avoidance of cluster risks(2)
“In the short run, the market is a voting machine but in the long run, it is a weighing machine.” – Benjamin Graham
* Selected key criteria. 1. This inevitably causes us to hold few to no investments in some (sub-) industries, e.g. in Biotech or parts of the Energy / Power & Utilities / Oil & Gas sectors. 2. Additional use of derivatives to selectively hedge currency risks.
Presentation suitable for professional investors and eligible counterparties.
13A continuous and dynamic process
5. Decision making & monitoring
Due diligence & valuation
Team discussion
Follow-up needed Decision made
Entry price & Continuous
Further analysis Back on watchlist
weighting monitoring
Note: Own diagram.
Presentation suitable for professional investors and eligible counterparties.
14Portfolio allocation & case study
Case study illustrating our investment approach
Presentation suitable for professional investors and eligible counterparties.
15Focus on deeply undervalued European micro & small caps
Portfolio allocation
Allocation by market cap (EUR) Top 10 holdings*
1 Character Group 8.2% 6 Koenig & Bauer 5.2%
1bn 4 JPJ Group 5.9% 9 Fjord1 2.9%
12.6% (1)
Cash or cash equivalents 5 Akwel 5.3% 10 Ctac 2.9%
18.4%
Allocation by sector Allocation by country
Industrials Germany
23.8% 23.8%
Consumer United Kingdom
33.5% 35.0%
Utilities France
2.9% Healthcare Sweden
3.7% Financials 10.1%
Other
6.8% Information technology Cash or cash equivalents (1)
(1)
3.9%
6.8% Cash or cash equivalents 6.7%
22.4% 20.5%
„The single greatest edge an investor can have is a long-term orientation.” – Seth Klarman
Source: Gehlen Bräutigam Capital, as of 30 June 2019. 1. Incl. liquidity fund (currently 7.4%). * Top 10 holdings out of 21 holdings in total.
Presentation suitable for professional investors and eligible counterparties.
16Niche player with weak post-IPO performance …
Case study (I/III)
Despite an attractive business and a good operating performance … … the shares lost over two-thirds of their value post-IPO
Share price in CAD
4.5
4.0
2,176 machines -8.5%
3.5
in operation(1)
3.0
2.5
2.0
• Mainly active in B2G(2). Lottery providers 1.5
use LT-3 products to increase sales 1.27
1.0 -68.3%
• LT-3s in “non-traditional venues”(3) are
compliant with lottery laws 0.5
May-15 Jul-15 Sep-15 Nov-15 Jan-16 Mar-16 May-16
• High barriers to entry through licenses,
patents and close relationships with state
Innova Gaming Group S&P/TSX Composite
institutions and regulators
Source: Innova Gaming Group; Bloomberg. 1. in Q1 2016. 2. B2G: business to government. 3. e.g. veteran halls, bingo halls, racetracks, bars/restaurants.
Presentation suitable for professional investors and eligible counterparties.
17… available at a deep discount to its intrinsic value
Case study (II/III)
Very undemanding valuation … … reflecting neither profitability nor growth potential
in CAD m
recurring revenues revenues from state institutions
95% in 2015
63% in 2015
Market cap 25.2
in USD m +20.8% +10.3% +14.6%
of market
Net cash 9.1 >35% capitalisation 21.2
18.5 21.1% 21.6%
16.8
Enterprise value 16.1 13.9
3.9 4.6
4.3%
2.5% 0.3 0.7
2012 2013 2014 2015
EV/EBITDA 2016E 2.2x
Revenue Adj. EBITDA % Margin Revenue growth
EV/EBITDA 2017E 1.7x
P/E 2016E 13.8x CAGR ’12-’15
2,354
P/E 2017E 9.3x P/E ratio does not 2,002 2,138
477 +15.4%
sufficiently reflect 1,530
Cash-P/E 2017E 6.0x 763
net cash position 1,015 -20.9%
964 1,877
Strong balance sheet 987 1,375 +49.1%
P/B 2015A 0.76x 566
without intangibles
2012 2013 2014 2015
LT-3 Machines AGP Machines
Source: Innova Gaming Group.
Presentation suitable for professional investors and eligible counterparties.
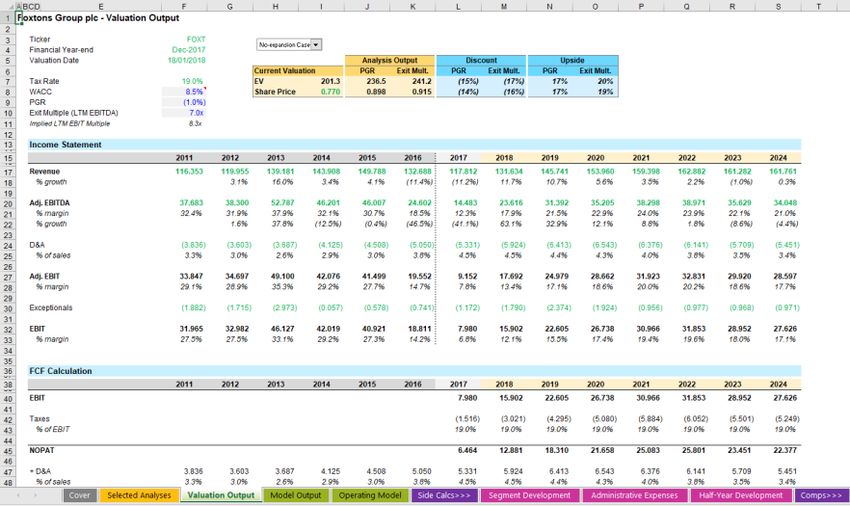
18Takeover process uncovers huge undervaluation!
Case study (III/III)
In our opinion, even the improved offer far from adequately reflected the company’s intrinsic value
Share price in CAD
12.0 Pollard Banknote – share price
+28.3m
30 June 2017: Pollard increases
11.0 offer to CAD 2.50 per share. Innova
2.75 agrees to friendly takeover
Market cap.:
10.0 +41.2m
2.50 2.50
Sell
+96.9%
9.0
Final takeover price:
2.25 CAD 50.8m
8.0
2.00 3 May 2017: Innova’s board recommends
7.0
not accepting Pollard’s offer as it
Feb-17 Apr-17 May-17 Jul-17
significantly undervalues Innova
1.75
1.50
+8.7%
1.25 9 March 2017: Pollard announces
intention to acquire Innova for
Buy CAD 2.10 per share(1)
1.00
May-16 Aug-16 Oct-16 Jan-17 Mar-17 Jun-17 Aug-17
Innova Gaming Group S&P/TSX Composite
Source: Innova Gaming Group; Bloomberg, as of 18 January 2017.
1. Includes “support agreement”: Amaya (largest shareholder at 40.75%) agreed to the takeover and promised Pollard Banknote a “right-to-match”. The official offer issued on 19 April had a minimum acceptance threshold of 50%.
Presentation suitable for professional investors and eligible counterparties.
19USPs & fund information
Presentation suitable for professional investors and eligible counterparties.
20We are in the same boat, out of conviction …
USPs
Excellent investment opportunities through focus on attractive universe
Concentrated and focused portfolio. In-depth understanding of our investments
Investments only at deep undervalues
Sustainable strategy through early limitation of fund volume*
Alignment of interests through co-investments from Daniel Gehlen and Marc-Lennart Braeutigam
Fundamental, long-term, concentrated, thorough due diligence, deep value… active management delivering value-add!
* Fund volume is limited to approx. EUR 100m.
Presentation suitable for professional investors and eligible counterparties.
21… invest with us!
Fund information (I/II)
Fund Gehlen Braeutigam Value HI
Investment objective Achieving the highest possible value growth over a complete cycle
Recommended minimum investment period Min. 5 years
Category European equity fund (min. 51% stocks)
Legal form UCITS
Classes -R- -I-
WKN / ISIN A2JQHQ / DE000A2JQHQ2 A2N811 / DE000A2N8119
Inception date 7 September 2018 2 January 2019
Currency EUR
Utilization of returns Distributing
Minimum investment No minimum investment EUR 200,000
Offering premium Currently 0.00%
Redemption fee None
Management fee % p.a. 1.60% 1.20%
Performance fee 15% of the performance above 4%, with high-water mark*
Order acceptance deadline for issues / returns 4pm (CET) of the previous day (forward pricing); Closing day (t): T + 5
Review frequency Daily
Partner
KVG HANSAINVEST Hanseatische Investment-GmbH
Custodian Joh. Berenberg, Gossler & Co. KG
Liability umbrella BN & Partners Capital AG
* 15% per year of positive performance above the reference value 4% p.a. (absolute positive share performance) calculated as a performance fee, but a maximum of 15%. A negative performance must be reversed first.
Note: The prospectus and other investor information about the Gehlen Braeutigam Value HI fund can be found at www.hansainvest.com.
Presentation suitable for professional investors and eligible counterparties.
22Risk / return profile
Fund information (II/II)
Typically low return and low risk
The Gehlen Braeutigam Value HI is classified in category 6 because its unit price has
fluctuated sharply and therefore both risk of loss and opportunity can be high.
This indicator is based on historical data – a forecast of future developments is not possible.
The classification of the fund may change in the future and does not constitute a guarantee.
Typically high return and high risk Even a fund classified in category 1 is not a completely risk-free investment.
The following additional risks may be significant to the fund:
• Liquidity risks: The fund invests a substantial part of its assets in financial instruments, • Custody risks: Custody of assets, especially abroad, may involve a risk of loss resulting
which are not traded on the official market on a stock exchange or on a similar market or from bankruptcy, breach of duty of care or abusive conduct by the custodian or sub-
that are otherwise difficult to sell and for which it may not be possible to find a buyer in the custodian
short-term. This may increase the risk of suspension of the unit redemption of the fund
• Operational risks: Human or technical failure, both internally and externally, but also other
• Default risks: The fund concludes transactions with various contractual partners. There is events (such as natural disasters or legal risks) may cause losses to the fund
a risk that contractual partners can no longer meet payment or delivery obligations
Note: The prospectus and other investor information about the Gehlen Braeutigam Value HI fund can be found at www.hansainvest.com.
Presentation suitable for professional investors and eligible counterparties.
23Contact us
In value we trust
Phone: + 49 (0) 69 6677 48118 | Email: info@gbcvalue.com
Bockenheimer Landstrasse 2-4 | OpernTurm | 60306 Frankfurt am Main | Germany
www.gbcvalue.com
Presentation suitable for professional investors and eligible counterparties.
24Disclaimer
This document is a customer information (“CI”) in the sense of the German Securities Trading Act (WpHG). Responsible as the author for the content is the tied agent listed below. This “CI” is used
exclusively for information purposes and cannot replace an individual suitable investment advice. This “CI” does not constitute a contract or any other obligation or kind of contractual offer. Furthermore, the
content does not constitute investment advice, an individual investment recommendation, an invitation to subscribe for securities or a declaration of consent or a solicitation of an agreement on a
transaction in financial instruments.
This “CI” is intended only for professional customers and eligible counterparties with a habitual residence or domicile in Germany and has not been written with the intention of giving legal or tax advice.
The tax treatment of transactions is dependent on the personal circumstances of the respective customer and may be subject to future changes.
Recommendations and forecasts are non-binding estimates of future events. They can therefore prove to be inaccurate regarding the future development of a product. The information contained in this
document is based exclusively on the date on which this “CI” was provided. A guarantee for the actuality and correctness cannot be given. Past performance is not a reliable indicator of future performance.
This information is protected by copyright, no reproduction or commercial use is permitted. Date: July 1 st, 2019
Author/Issuer: Daniel Gehlen, Marc-Lennart Braeutigam – Gehlen Bräutigam Capital GmbH, Bockenheimer Landstraße 2-4, 60306 Frankfurt am Main, Germany acting as a tied agent (§ 2 section 10
German Banking Act) in the order, in the name, for account and under the liability of the responsible liability holder BN & Partners Capital AG, Steinstraße 33, 50374 Erftstadt. BN & Partners Capital AG
has a authorization from the German Federal Financial Supervisory Authority (Bundesanstalt für Finanzdienstleistungsaufsicht) pursuant to § 32 German Banking Act for the provision of investment
advisory service pursuant to § 1 section 1a no. 1a Banking Act and the investment brokerage pursuant to §1 section 1a no. 1 German Banking Act.
The above content only reflects the author's opinions, which may differ from those of BN & Partners Capital AG. A change of this opinion is possible at any time, without it being published. BN & Partners
Capital AG assumes no liability for the content, correctness and up-to-dateness of the information contained therein and does not accept any liability for damage resulting from the use of the “CI” or parts
thereof.
Presentation suitable for professional investors and eligible counterparties.
25You can also read