Gender Bias in Job Referrals: An Experimental Test - Munich ...
←
→
Page content transcription
If your browser does not render page correctly, please read the page content below
Munich Personal RePEc Archive

Gender Bias in Job Referrals: An
Experimental Test

Beugnot, Julie and Peterlé, Emmanuel

CRESE EA3190, Université Bourgogne Franche-Comté

May 2018

Online at https://mpra.ub.uni-muenchen.de/87538/
MPRA Paper No. 87538, posted 08 Jul 2018 17:02 UTC
Gender Bias in Job Referrals: An Experimental Test∗
                        Julie Beugnot†and Emmanuel Peterlé‡
        Univ. Bourgogne Franche-Comté, CRESE EA3190, F-25000 Besançon, France

                                        May 29, 2018

                                           Abstract

      Employee referral programs, while efficient for the employer, have been shown to
      amplify sex-based occupational segregation in the labour markets. We present evi-
      dence from a laboratory experiment designed to shed light on same-gender bias in
      job referrals within gender-balanced networks. Our data suggest that women tend
      to favor women in their referral choice, whereas men do not attach much importance
      to the gender of potential candidates. Our experimental design allows us to disen-
      tangle between statistical discrimination, preferences, and pure same-gender bias.
      Our findings add to the existing literature by highlighting that gendered networks
      alone do not explain the observed gender homophily in referred-referrer pairs.

JEL Classification numbers: C91, J16, J71, J21, M51.

Keywords: Same-gender bias, job referral, laboratory experiment.

  ∗
     Financial support from the Université Franche-Comté (UFC) is gratefully acknowledged.
  †
     Corresponding author, Univ. Bourgogne Franche-Comté, 45D Avenue de l’observatoire, 25030 Be-
sançon (France), E-mail: julie.beugnot@univ-fcomte.fr
  ‡
   Univ. Bourgogne Franche-Comté, 45D Avenue de l’observatoire, 25030 Besançon (France), E-mail:
emmanuel.peterle@univ-fcomte.fr
1 Introduction
The importance of social networks in labour markets and particularly in job search is well
established. Indeed, social networks can facilitate job search by providing information
regarding vacancies to job seekers or by directing referrals to employers. Both in sociology
and in labour economics, many studies highlight the prominent role of personal contacts
in matching vacant jobs and job seekers (see Gorman and Marsden (2001) for a literature
review in sociology and Topa (2011) for a literature review in economics). The use of
social networks in referrals can be either informal through word-of-mouth communication
or formal through employee referral programs. Nowadays firms widely recruit thanks to
referrals, making it the first external source of hiring in the United States according to
annual reports from the human resources think tank CarrerXRoad.
An employee referral program (ERP) is a recruiting strategy in which employers en-
courage current employees to refer possible candidates from both their personal and pro-
fessional networks to fill current vacancies in the organization. The main difference with
word-of-mouth referral is that the referrer employee gets monetary or non-monetary re-
wards if their referred applicant is ultimately hired. Employers use ERPs to reduce in-
formation asymmetry, which is inherent in the hiring process. Employees act as selection
mechanism of potential candidates by making referrals (Montgomery, 1991; Beaman and
Magruder, 2012; Dustmann et al., 2016). Consequently, as many empirical studies have
shown, resulting matches are generally of higher quality than those resulting from usual
recruitment processes in terms of wage, productivity and tenure (Castilla, 2005; Burks
et al., 2015; Brown et al., 2016). In a field experiment investigating an online labour
market, Pallais and Sands (2016) show that referred workers always perform better and
have lower turnover rates than non-referred ones. Referrals are thereby efficient in re-
vealing positive information, especially when made by high-quality workers. However,
Calvo-Armengol and Jackson (2004) show theoretically that such hiring process can exac-
erbate labour market inequalities between groups in the long run. In their paper, the use
of referrals disadvantages unemployed workers in job search because employed workers
are out of their networks. Thus, employees’ network composition appears as an essential
factor in referral-based hiring outcomes.
Many empirical studies have shown that social networks tend to be gender homophilous1
(see McPherson et al. (2001) for a literature review in sociology). Therefore, gendered
networks and the increasing use of job referrals are involved in sex-based occupational seg-
1
The homophily is the tendency of people to prefer interacting with similar others. In case of gender
homophily, my social network is mainly made up of others of my gender.
1regation and inequalities in the labour markets. Self-selection, discrimination and human
capital investment are not the only ones at fault.
The tendency to refer someone of the same gender is empirically well-established.
Brown et al. (2016) find that the extent of gender homophily in referred-referrer pairs is
significant in a mid-sized US corporation. Among all of the hires observed from 2000 to
the first half of 2011, 63.5% of referral matches are between people of the same gender.
Similarly, using data from a call center in the U.S., Fernandez and Sosa (2005) find that
75% of referrals by female employees were women and only 44% of referrals by male
workers were men. However, they cannot conclude to gender biased referral behavior for
women because data do not pertain to referrals attempts. Indeed, such observations may
result from gender differences in job preferences2 .
A few experimental investigations deal with gender bias in referrals. In a recruitment
experiment run in Malawi, Beaman et al. (2018) investigate how the referral contract
interacts with the gender and the quality of referred applicants and conclude that such
hiring process disadvantages women. Indeed, they find that men tend to refer fewer women
irrespective of the constraints and incentives associated to ERPs, whereas women refer
women at approximately the same rate by which they apply traditionally. As women do
not manage to refer high-quality women, hiring through referrals fails in identifying high-
quality female workers. Unfortunately, having no information about subjects’ network,
Beaman et al. (2018) are not able to highlight exactly why men present a higher gender
bias in selecting referrals than women or why women refer low-quality candidates. In
a recruitment experiment run in a Business School in Stockholm, Hederos et al. (2015)
ask to students to refer another student at the school for actual part-time jobs. Next,
asking them the names of their closest friends, they assess whether networks are gender
homophilous. They find strong evidence of same-gender bias in referrals for both genders.
However, even though networks are gender homophilous, this propensity to refer someone
of the same gender cannot be fully explained by network composition given that it remains
unchanged when students refer someone outside of their own network. Last but not least,
their findings hold irrespective of the gender stereotypes associated to the considered jobs.
In this paper we investigate whether a ‘pure’ same-gender bias exists in job referrals.
In other words, we attempt to identify whether a same-gender bias would persist irre-
spectively of network composition. For this purpose, we run a laboratory experiment
in which we control the composition of the network from which subjects make referral
2
Women can prefer such job and then apply more frequently when employees of the call center refer
them.
2choices3 , the set of available information about network members and the environment in
which subjects are led to interact with referrals (cooperation or competition). We focus
our analysis on the referrers’ choice without considering the outcome of their referrals in
term of hiring. Our contribution is manifold. First, running laboratory rather than field
experiment allows controlling the network of referrers. Thus, an exogenous network rules
out the social tie which may be present in the referrer-referred pairs. Moreover, the gender
balance in the network eliminates the effect of social network composition on same-gender
referrals, as highlighted by Hederos et al. (2015). We can thereby explore whether same-
gender bias is robust when networks are exogenous and gender-balanced. Second, by
comparing referral choices in cooperative and competitive environments, we can analyze
whether gender bias changes with the nature of future interactions between the referrer
and her/his referral. Third, by varying relevant displayed information, we can investigate
to what extent same-gender bias persists when subjects have information regarding net-
work members’ productivity. In this way, we can distinguish statistical discrimination and
preferences from ‘pure’ same-gender bias in job referral choices. Nowadays, organizations
are especially concerned about workforce diversity. Understanding how employees make
their referral choice seems essential to help them succeed.
Our findings allow us to rule out statistical discrimination in job referral decisions
within our setting. Indeed, gender-biased choices are not influenced by the future inter-
actions with the referrals. Moreover, we show that only women are concerned by the
gender of referral candidates. Whereas men refer candidates from both genders at the
same rate, women tend to refer more women in competitive environment, irrespective of
information flows, and in cooperative environments when no other relevant information is
available. Such behaviors suggest the existence of a ’pure’ same-gender bias in job referral
decisions of women mainly in case of future cooperation with referrals and support female
preferences for same-gender competition.
2 Experimental design
2.1 Preliminary stages
We run a preliminary questionnaire to collect information about participants’ character-
istics. Participants provide information regarding their demographics (gender and age)
and academic background (current year of study, specialization and school admission pro-
3
As presented below, we provide gender-balanced networks with equal distribution of productivity
between gender.
3cess). The experiment is conducted in a business school, for which several specializations
are available (International Business, Marketing & Business Development, Wine Tourism)
4
. The school admission process is divided in two categories : students who attended a
preparatory class and students who accessed school from a parallel admission. The ques-
tionnaire is run beforehand, because most of the collected information is necessary in the
referral game.
During the experiment, participants perform on multiple occasions in a real-effort
task. We use a decoding task (Charness et al., 2014) where participants have to decode
sets of two-digits numbers into letters from a grid of letters displayed on the screen (see
screenshot in appendix A). This real-effort task is particularly suited to the context of our
experiment as previous studies have found no gender differences in performance under this
task (Charness et al., 2014; Kuhn and Villeval, 2015). After answering the preliminary
questionnaire, participants are presented with the decoding task. They first take part
to a trial period of two minutes with no monetary reward. This is intended to familiar-
ize participants with the task. Then, all participants perform for four minutes under a
piece-rate remuneration scheme. Participants earn e0.10 for each correctly solved task.
Performance in this preliminary game is henceforth used as a measure of productivity.
2.2 The referral game
In the main game of our experiment, participants take one of two roles : referrer or refer-
ral candidate. Each experimental session includes N participants. Six participants (three
females and three males) take the role of referral candidate, while the (N-6) remaining
participants take the role of referrer. The attribution of these roles is not random, as
the panel of referral candidates must meet certain criteria. The algorithm used to match
participants in their respective roles is described in the next subsection.
In the first stage of the referral game, participants in the role of referrer face four
independent decisions. Each decision consists in selecting one of the six referral candi-
dates in the panel in a particular situation. Participants are informed that one of those
four decisions will be randomly selected as effective for the second stage of the game. In
this second stage, all participants perform in the decoding task. Payoffs in the referral
4
As participant are in their first year of study and given that specialization is effective in the third
year of study, participants express a wish only in the preliminary questionnaire.
4game depend on the role, the referral choices and the performance of participants. We
implement a 2 × 2 factorial design in a within-subject fashion, amounting to the four
decisions undertaken by referrers. The selection process varies in two dimensions.
Competitive vs. cooperative environment
First, we vary the structure of the payoffs of participants. More precisely, we compare
two types of remuneration schemes which induce two types of future interaction between
the referrer and her/his referral. Indeed, when a worker refers another one for a position
in the organization, she/he may have to work with her/him or compete against her/him
for promotions in the future.
In the competitive environment, each referrer enter a competition with her/his referral.
The participant who has the lowest performance receives a payoff of e0. The participant
who performs the best receives a positive payoff, which is decreasing with the distance
between her/his own performance and the performance of the opponent. We use such
payoff structure to incite referring a high quality candidate despite the future competi-
tion with her/him5 . Overall, referrers in this situation have a monetary incentive to select
a candidate marginally less performing than them for referral.
Payoff structure in the competitive environment :
πi = e6 − e0.10 × (own performance-performance of opponent) if the competition is won
πi = e0 if the competition is lost
In the cooperative environment, each referrer enter a cooperation with her/his referral.
Participants in both roles receive the same payoff, which is based on the average perfor-
mance of the referrer/referred pair.
Payoff structure in the cooperative environment :
πi = e0.10 × [(own performance+performance of opponent)/2]
Low vs. high information
5
In ERPs, only high quality referred candidates are recruited and referrers are better off referring such
candidates even though they will compete with them for promotions. Consequently, in order to reduce
threats to external validity, we use a payoff structure which avoids the ease of referring a low quality
candidates in case of competition.
5Second, we vary the information available to referrers when making their referral
choices. In the low information treatments, referrers have access to information regarding
the gender, the age, the specialization wish and the school admission process of the six
referral candidates. In the high information treatments, referrers also get information
regarding referral candidates’ performance in the preliminary game. This information
is given in the form of a noisy signal, that can take any integer value in a range from
two units below to two units above the actual performance in the preliminary game. For
instance, an actual performance of 50 will be associated to a signal lying between 48 and
52.
2.3 Panel formation
In our experiment, the panel of referral candidates from which referrers make referral
choices is given but not random. Indeed, controlling environment is the main asset of lab-
oratory experiments compared to field data and, as explained previously, controlling net-
work composition is essential in our pure same-gender bias identification. Consequently,
after the preliminary game, an algorithm selects three men and three women among all
participants so that we obtain an equal gender performance distribution.6 More precisely,
the panel of candidates consists of three homogeneous female-male pairs. Within each
pair, performances in the preliminary piece-rate task are either equal, or differ by one unit
only. Thereby, referrers always have the choice between a low performer, a mid performer
and a high performer of either gender. This information is particularly relevant in the
high information treatments where a signal regarding performance is provided. Keep in
mind that the panel of referral candidates stay unchanged between treatments, only the
set of information changes between the low and the high information treatments.
2.4 Experimental procedure
The experiment was programmed using z-Tree (Fischbacher, 2007). In total, 211 partic-
ipants (93 women and 118 men) took part in the experiment. The subject pool consisted
of students from the Burgundy School of Business in Dijon (France). The sessions lasted
approximately 45 minutes. Subjects’ average earnings were e11.
6
The panel formation algorithm is described in appendix B.
6To control for potential order effects, the sequence of treatments was modified between
sessions. Table 1 displays an overview of our experimental sessions.
Table 1: Characteristics of the experimental sessions
Session Number of subjects Number of females Sequence of treatments†
1 36 10 Competiton - Cooperation
2 35 17 Cooperation - Competition
3 35 18 Competiton - Cooperation
4 36 19 Cooperation - Competition
5 35 17 Competiton - Cooperation
6 34 12 Cooperation - Competition
Total 211 93
†
The low information treatments are always run before the high information ones.
For instance, the treatment sequence in session 1 was: i) Competition/Low info -
ii) Cooperation/Low info - iii) Competition/High info - iv) Cooperation/High info.
3 Theoretical framework and predictions
Beaman et al. (2018) develop a theoretical model of referral choice to investigate which
characteristics drive referral choices towards men rather than women. In our controlled
environment, this theoretical framework is simplified so that theoretical predictions about
referral choices can be tested. Each referrer i has a network Ni = Fi ∪ Mi , where Fi
(Mi ) is the set of female (male) referral candidates, which consists of |Fi | females and
|Mi | males. Given that Ni is exogenous, no idiosyncratic social benefit comes from
making referrals. Moreover, as our experiment is an anonymous one-shot game, there
is no ambient incentive to refer the more efficient worker so that no reputational effects
plays. Consequently, in our intentionally simplified case, only direct financial incentives
drive referral choices. These incentives change between the competitive and cooperative
environment. In the high information treatments, the referrer i observes a signal Qj about
the quality Yj of each referral candidate j of the network7 such that: Qj = Yj + ǫ, with
ǫ ∼ U [−2, 2]. Thus, the referrer i chooses her/his optimal referral j ∗ both in cooperative
7
Remind that the signal about quality of referral candidates is based on their performance in the
preliminary game.
7and competitive environment such that
j ∗ = arg max E [Pi (Yj )|Qj ] , (1)
j∈Ni
where Pi (Yj ) gives her/his payoff as a function of the quality of the referral j and depends
on the environment in which the referrer and the referral interact8 . As a consequence, only
the quality of referrals matters, others characteristics are irrelevant. In our experiment,
each network Ni (panel of referral candidates) consists of as many females as males, i.e.
|Fi | = |Mi |. Moreover, the panel formation algorithm guarantees that the distributions of
referral candidates quality are similar among genders, i.e. E[Yj |j ∈ Mi ] = E[Yj |j ∈ Fi ],
which implies that E [Pi (Yj )|Qj ] does not depend on the gender of j ∈ Ni . As a conse-
quence, we can make the following predictions.
Prediction 1 In treatments without signal about referral candidates quality (low in-
formation treatments), the probability to refer a female p(j ∗ ∈ Fi ) or a male p(j ∗ ∈ Mi )9
equals to 50%, as |Fi | = |Mi |.
Prediction 2 In treatments with signal about referral candidates quality (high in-
formation treatments), referrers are concerned about signals of referral candidates only
when making referral choices.
Prediction 3 In treatments with signal about quality (high information treatments),
the probability to refer a female p(j ∗ ∈ Fi ) or a male p(j ∗ ∈ Mi ) equals to 50%, as
|Fi | = |Mi | and E[Yj |j ∈ Mi ] = E[Yj |j ∈ Fi ].
4 Results
In this section we report our findings. We start with an overview of the data we collected
in the experiment. As a next step we show preliminary evidence of same-gender bias in the
referral decision of female referrers. We finally confirm this finding through econometric
analysis. We run Wilcoxon Mann-Whitney tests (henceforth WMW ) and proportion tests
(henceforth prtest) to support our analysis. When using non-parametric tests, we always
8
As showed previously, profit functions are such that referrers always make a referral choice.
9
For simplification and without loss of generality, we present proportions of same-gender referrals in
the result section.
8report two-sided p − values throughout.
4.1 Descriptive statistics
Table 2: Descriptive Statistics
Referrers
All Males Females
Female 42.95% - -
Age (in years) 20.31 20.44 20.15
(0.96) (1.09) (20.15)
Study level (in years) 2.30 2.32 2.29
(0.56) (0.60) (0.51)
Preparatory class 55.43% 43.00% 72.00%
(school admission process)
Performance (piece-rate) 58.73 58.73 56.93
(10.62) (10.13) (11.16)
Payoff (in euros) 10.80 10.79 10.82
(2.91) (3.12) (2.63)
# Participants 175 100 75
Referral candidates
All Males Females
Female 50% - -
Age (in years) 20.08 20.22 19.94
(0.60) (0.73) (0.42)
Study level (in years) 2.14 2.17 2.11
(0.35) (0.38) (0.32)
Preparatory class 55.55% 38.89% 72.22%
Performance (piece-rate) 59.64 59.56 59.72
(9.06) (9.26) (9.12)
Payoff (in euros) 12.36 12.26 12.46
(1.61) (1.71) (1.56)
# Participants 36 18 18
Note : Average values (standard deviations) are reported
in this table.
9Table 2 reports information regarding demographics and outcomes within our sample.
The two subpopulations of referrers and referral candidates do not differ in age (WMW,
p=0.2611), study level (WMW, p=0.3014) or proportion of students who attended prepara-
tory classes (prtest, p=0.9889). The performance of referral candidates is not significantly
different in average than the performance of referrers (WMW, p=0.5278). Participants
in the role of referral candidate receive in average a higher payoff than participants in
the role of referrer (WMW, p=0.0094). This is due to the structure of our experimental
design; a participant in the role of referral candidate is paid according to the interaction
which grants her/him the highest payoff.
As an important note, we observe that women and men do not differ in performance in
the decoding task we implemented (WMW,p=0.4377). This is consistent with Charness
et al. (2014) and Kuhn and Villeval (2015) that have shown that the decoding task does not
entail any gender difference in performance. For this reason, a referrer has no monetary
interest to discriminate against females (or males) when making her/him referral choice
in the low information treatments, except in case of wrong beliefs.
4.2 Gender bias in referral decisions
For each session, the panels of referral candidates have been constructed such that exactly
three women and three men could be selected by the referrers. In the absence of gender
bias, one would expect to observe a (close to) perfect gender balance among referrals.
Furthermore, the probability to be selected should not be conditional on the gender of
the decision-maker.
Our data suggest however that women tend to favor women in their referral decision.
Over our four treatments, female referrers choose a female candidate in 59.33% of the
cases. This is significantly higher than the 50% share predicted by our model (prtest,
p=0.0012). In sharp contrast, men do not appear to attach particular importance to the
gender of candidates when making their referral decision. Male referrers select a male
candidate in 50.25% of the cases. This figure is not significantly different than a perfect
gender balance (prtest, p=0.9203).
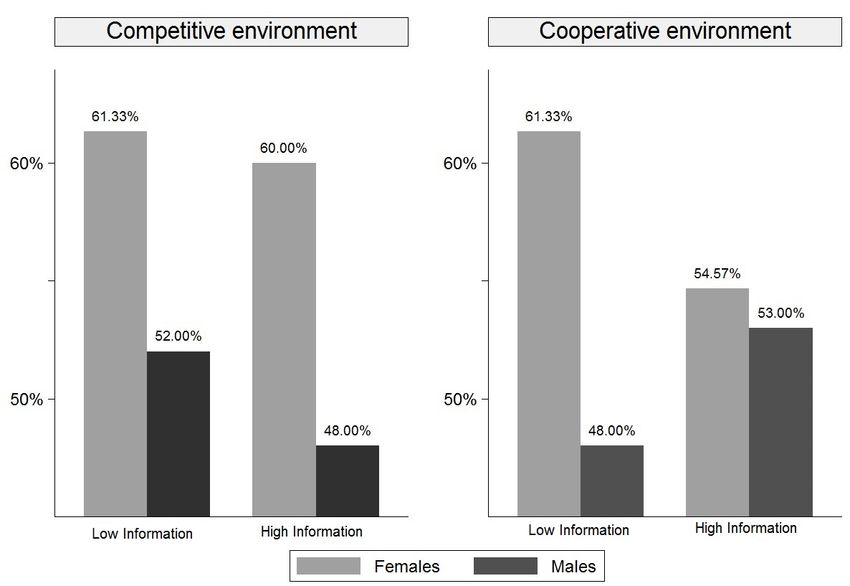
Figure 1 reports the proportion of same-gender referrals across treatments and accord-
ing to the gender of the referrer who makes the referral choice. In all four treatments of
the experiment, male referrers do not exhibit differential treatment between women and
10men in their referral choice (prtest, p>0.10 in each treatment). Thus, the theoretical
predictions 1 and 3 are verified for male referrers in all our treatments, whereas this is
not the case for female referrers. Indeed, female referrers tend to refer more women in
the Competitive/Low information treatment (prtest, p=0.0496), the Competitive/High
information treatment (prtest, p=0.0833), and the Cooperative/Low information treat-
ment (prtest, p=0.0496). However, this tendency to refer more women than men does
not appear in the Cooperative/High information treatment (prtest, p=0.4189).
Figure 1: Proportion of same-gender referrals across treatments
4.3 Robustness check
To ensure that the observed inclination of women to refer female candidates is not driven
by other observable characteristics, we run additional econometric regressions. We choose
to use conditional logit models due to the structure of our data. Developed by McFad-
den (1973), the conditional logit model is an extension of the multinomial logit model
and is particularly appropriate in discrete choice situations. In this model, explanatory
variables include attributes of the choice alternatives (here, the characteristics of referral
candidates) and characteristics of the individuals making the choices (here, the referrers).
11Participants in the role of referrer face a panel of six candidates from which only one
candidate should be selected. The decision to refer or not a candidate therefore depends
on the other choices available in the panel and on their own characteristics. Such effects
on choice can be captured with a conditional logit model.
Results are presented in table 3. As our purpose is to identify a pure same-gender bias
in referral choice, we run econometric regressions from this perspective. Same-gender bias
reveals the existence of in-group favoritism, but others shared characteristics can lead to
such behavior, as the school admission process in our case. Indeed, in business schools,
school admission processes can divide students. Moreover, as showed in Table 2, this
characteristic is not perfectly balanced among gender, women are more frequently from
preparatory classes. Due to implementation issues, our panels of referral candidates were
not perfectly balanced among gender concerning this observable characteristic. Conse-
quently, our econometric analysis allows to distinguish a same-gender bias from a likely
same-admission bias.
As expected, the signal about referral candidates’ quality significantly affects partic-
ipants’ decisions when available. In competitive environment, referrers choose referral
candidates of lower quality and do the opposite in cooperative environment. Moreover,
the theoretical prediction 2 is always verified except with female referrers in competi-
tive environment. Although they are informed that females and males do not differ in
performance within the panel, women are more willing to choose a female candidate in
competitive environment whereas they do not exhibit gender bias in cooperative environ-
ment.
Regressions confirm that men do not exhibit favoritism toward male referral candidates.
Indeed, male referrers do not choose significantly more male referral candidates. However,
they choose significantly more referral candidates from the same admission process in the
cooperative/low information treatment. Although this may be viewed as evidence for
in-group favoritism among males, this finding is not supported through other treatments
and may not be over interpreted.
Finally, our regressions show that women are not willing to refer more candidates from
the same admission process in any of our treatments, whereas they are willing to refer
more candidates of the same gender in all but the cooperative/high information treat-
ment. As a consequence, we confirm that their inclination to refer more female referral
12candidates is not driven by the composition of our pool of participants (i.e. by the fact
that more than 70% of female participants comes from preparatory classes). Furthermore,
as the bias remains the same in cooperative and competitive environments without signal
about candidates’ quality, we conclude that it does not reflect statistical discrimination.
Indeed, if beliefs regarding candidates’ quality were related to gender, we would have
observed opposite behaviors in cooperative and competitive environments. Finally, when
information regarding candidates’ quality is provided, females’ tendency to refer females
is observed in the competitive treatment only. One interpretation would be that the same-
gender bias we observe in the absence of information does not reflect strong preferences
from women for women, and that the persistence of this same-gender bias in the competi-
tive setting with information is due to preference of women for same-gender competition.10
10
Such preferences have been documented in the experimental literature (e.g. Datta Gupta et al.
(2013), ?)
13Table 3: Determinants of referral choice (conditional logit estimates)
Competitive environment
Low information High information
i is a female i is a male i is a female i is a male
i and j are from the same gender 0.476** 0.083 0.432* -0.103
(0.241) (0.202) (0.236) (0.202)
i and j are from the same admission -0.104 0.050 -0.192 -0.008
(0.387) (0.266) (0.372) (0.270)
Signal of j -0.001 0.013 -0.073*** -0.053***
(0.013) (0.012) (0.016) (0.014)
# Obs 450 600 450 600
# Participant i 75 100 75 100
Cooperative environment
Low information High information
i is a female i is a male i is a female i is a male
i and j are from the same gender 0.408* -0.105 0.113 0.170
(0.240) (0.203) (0.233) (0.196)
i and j are from the same admission 0.412 0.610** 0.0415 -0.0219
(0.341) (0.307) (0.265) (0.236)
Signal of j 0.00219 -0.0111 0.114*** 0.105***
(0.0124) (0.0133) (0.0243) (0.0233)
# Observations 450 600 450 600
# Participants i 75 100 75 100
Note: Robust standard errors are displayed in parentheses
*** p < 0.01, ** p < 0.05, * p < 0.1
5 Discussion and conclusion
We conduct a laboratory experiment in an attempt to identify gender bias in job referral
choices. The choice of using a laboratory experiment enables us to exogeneize and control
the network composition from which referrers make their choice. Thereby, we neutralize
the network composition effect which has been highlighted in the existing literature as a
probable cause for gender homophily in job referral. Furthermore, our various treatments
enable us to disentangle statistical discrimination, preferences and ’pure’ same-gender
bias.
14We observe that females exhibit same-gender favoritism in their referral choices in
several instances. First, females tend to favor females for positions that lead to future
cooperation only when no information regarding productivity is available. Second, females
tend to favor females for positions that lead to future competition, even when they are
informed that there is no productivity difference between both gender. If participants’
discriminatory practices would be statistically driven, we would not observe that females
favor females in both competitive and cooperative environments. Furthermore, if females
had strong preferences for interacting with other females, the presence of same-gender
favoritism would hold in the cooperative environment with information. As such, we
believe that the observed same-gender favoritism is mainly driven by (cognitive) bias
in cooperative environment and preferences for competing against an other female in
competitive environment. In contrast, male referrers do not seem to be concerned about
gender in their referral choices. We observe however, in one treatment only, that males’
choices might be biased towards candidates who have similar curriculum, suggesting that
males are not exempt from in-group favoritism.
We acknowledge that the referral game we implement is simple, and several dimensions
of the job referral environment, such as ambient incentives or social benefit, are absent
from our design. This absence is however intended, as our research question is precisely
to investigate the existence of ’pure’ gender bias, independent of all those dimensions. It
may be interesting for future research to extend this experimental framework.
Our study does not aim at minimizing the role of the network composition effect.
Gender bias can be indirectly related to the gender composition of our participants’ actual
networks, as they may form with one’s social environment. However, we demonstrate
through this experiment that (artificially) neutralizing the network composition effect
is not sufficient to ensure gender parity in referral choices. Furthermore, our findings
suggest that the response of referrers to such an environment depends on the referrer’s
own gender. Those results are potentially relevant to managers who are interested in
promoting workforce diversity while using Employee Referral Programs.
15References
L. Beaman and J. Magruder. Who gets the job referral? evidence from a social networks
experiment. American Economic Review, 102(7):3574–93, December 2012.
L. Beaman, N. Keleher, and J. Magruder. Do job networks disadvantage women? evidence
from a recruitment experiment in malawi. Journal of Labor Economics, 36(1), 2018.
M. Brown, E. Setren, and G. Topa. Do informal referrals lead to better matches? evidence
from a firms employee referral system. Journal of Labor Economics, 34(1):161–209,
2016.
S. V. Burks, B. Cowgill, M. Hoffman, and M. Housman. The value of hiring through
employee referrals. The Quarterly Journal of Economics, 130(2):805, 2015.
A. Calvo-Armengol and M. O. Jackson. The effects of social networks on employment
and inequality. American Economic Review, 94(3):426–454, June 2004.
E. J. Castilla. Social networks and employee performance in a call center. American
Journal of Sociology, 110(5):1243–1283, 2005.
G. Charness, D. Masclet, and M. C. Villeval. The dark side of competition for status.
Management Science, 60(1):38–55, 2014.
N. Datta Gupta, A. Poulsen, and M. C. Villeval. Gender matching and competitiveness:
Experimental evidence. Economic Inquiry, 51(1):816–835, 2013.
C. Dustmann, A. Glitz, U. Schnberg, and H. Brcker. Referral-based job search networks.
The Review of Economic Studies, 83(2):514, 2016.
R. M. Fernandez and M. L. Sosa. Gendering the job: Networks and recruitment at a call
center. American Journal of Sociology, 111(3):859–904, 2005.
U. Fischbacher. z-tree: Zurich toolbox for ready-made economic experiments. Experi-
mental Economics, 10(2):171–178, Jun 2007.
E. H. Gorman and P. V. Marsden. Social Networks, Job Changes, and Recruitment.,
pages 467–502. Kluwer Academic/Plenum, New York, 2001.
K. Hederos, L. Kvissberg, E. Polano, and A. Sandber. Gender dynamics in referral-based
hiring: A field experiment. mimeo, 2015.
P. Kuhn and M. C. Villeval. Are women more attracted to co-operation than men? The
Economic Journal, 125(582):115–140, 2015.
D. McFadden. Conditional Logit Analysis of Qualitative Choice Behaviour, pages 105–142.
Academic Press New York, New York, NY, USA, 1973.
16M. McPherson, L. Smith-Lovin, and J. M. Cook. Birds of a feather: Homophily in social
networks. Annual Review of Sociology, 27(1):415–444, 2001.
J. D. Montgomery. Social networks and labor-market outcomes: Toward an economic
analysis. The American Economic Review, 81(5):1408–1418, 1991.
A. Pallais and E. G. Sands. Why the referential treatment? evidence from field experi-
ments on referrals. Journal of Political Economy, 124(6):1793–1828, 2016.
G. Topa. Labor Markets and Referrals. 2011.
Appendix A: Instructions
Experiment instructions (first part)
The experimental session entails three stages. In stage one and three, you will perform
in a task. In stage two, you will take a series of decisions.
During stage 1, you perform for four minutes in the task that is described below. At the
end of this stage, you will be informed of your performance. This performance determines
the first component of your earnings. Only at the end of stage 1 will you receive the
instructions for the following of the experiment.
The task
During this experiment, you will have to perform a particular task. This task consists
of converting letters into numbers. The screen is divided into three parts (see screenshot
below).
17The left part of the screen displays a two-column table. The first column includes all
letters of the alphabet, in no particular order. The second column reports for each letter
a corresponding number. Your task is to find the number corresponding to an instructed
letter.
You can find the instructed letter in the central part of the screen. To provide your
answer, you must type it in the central field and confirm your choice by clicking the ≪ok
≫button. If the answer you provide is correct, your score increases by one unit. A new
letter appears, and you have to find again the new number that matches this letter. If
the answer you provide is incorrect, a warning message appears, and you are invited to
provide a new answer for the same letter.
The number of correct answers you have provided is displayed in the right part of the
screen. This is your score. Anytime you provide a correct answer, your score increases
by one unit.
To familiarize with the task, we offer you to perform for two minutes. Your earnings will
not be affected by the performance in this familiarization stage. Once all participants
have performed for two minutes, you will be asked to answer a short questionnaire. Once
all participants have answered this questionnaire, stage 1 of the experiment will start.
Payoffs
Your earnings for the whole experiment are calculated as the sum of what you earn in stage
1 and what you earn in stage 3. You will be paid in cash at the end of the experimental
session.
18In stage 1, you will take part in the decoding task for four minutes. Every problem that
you solve correctly will grant you e0.10. Your earnings for the stage 1 of the experiment
are computed as follows:
Earnings for stage 1 = e0.10 × Problems correctly solved
Incorrect answers are not considered in the calculation of your payoff. When the four
minutes of stage 1 have elapsed, an information screen will provide you feedback on your
performance and your earnings for this stage. We will then hand you new instructions,
to continue the experiment.
Experiment instructions (second part)
These new instructions explain the proceedings of stage 2 and stage 3 of the experiment.
In the following of the experiment, we place ourselves in the context of an employee
referral system. Employee referral is an internal recruitment system which encourage a
company’s existing employees to select and recruit potential candidates to a position. You
will participate either in the role of referrer, or in the role of candidate.
Participants in the role of referrer choose a candidate for the position.
Participants in the role of referral candidate can be chosen by referrers for the position.
Stage 2
At the beginning of stage 2, six participants in the room will be assigned the role of refer-
ral candidate by the computer. Those six participants will form the group of candidates
who can be selected by referrers. You are informed of your role at the beginning of stage
2. The actions you can undertake in stage 2 depend on your role.
If you are a referral candidate
You do not take any decision in stage 2.
If you are a referrer
The group of six referral candidates will be displayed to you. This group will remain un-
changed for the whole experiment. During stage 2, you will have to select a candidate with
whom you will participate in stage 3 in four different situations. Those four situations
vary in both the information you receive regarding potential referral candidates, and the
environment in which you will participate with the referral candidate you select for stage 3.
Please note that your selection decision will influence your earnings in the stage 3 of the
experiment. Furthermore, the calculation of your earnings in stage 3 will be affected by
the environment you will take part in. One of the four situations will be randomly drawn
and made effective. The four situations are described as below:
• Situation 1 : partial information + competitive environment
19You are provided with information regarding personal characteristics of all potential can-
didates. During stage 3, you will be competing against the candidate that you selected.
• Situation 2 : partial information + cooperative environment
You are provided with information regarding personal characteristics of all potential can-
didates. During stage 3, you will be cooperating with the candidate that you selected.
• Situation 3 : complete information + competitive environment
You are provided with additional information regarding the ability of all potential candi-
dates. During stage 3, you will be competing against the candidate that you selected.
• Situation 4 : complete information + cooperative environment
You are provided with additional information regarding the ability of all potential candi-
dates. During stage 3, you will be cooperating with the candidate that you selected.
In situation 3 and 4, you receive additional information regarding the ability of potential
candidates. This information takes the form of a performance signal S, that is calculated
as follows :
S =P +K
Where P is the exact performance of the individual during stage 1 et K is a number that
takes value in [−2; −1; 0; 1; 2].
Therefore, two participants with identical stage 1 performance can have different signal.
Two participants with the same signal did not necessarily perform the same in stage 1.
Stage 3
The situation made effective in stage 3 is randomly chosen by the computer at the end
of stage 2. Before starting stage 3, you will be reminded your candidate choice for this
situation. During this last stage, all participants will perform again in the decoding task
for four minutes.
Payoffs
The calculation of your payoff for stage 3 depends on your role, your performance, poten-
tially the performance of the other participant, and the environment you enter (competi-
tive or cooperative).
If you are a candidate who did not get selected in stage 2
Regardless of the randomly drawn situation, your payoff depends only on your perfor-
mance.
Earnings for stage 3 = e0.10 × Problems correctly solved
20If you are a candidate who got selected in stage 2
Your payoff depends on your performance and on the performance of the referrer who
selected you. If you have been selected by several referrers, the most favorable situation
will be considered. In other words, we assign you the referrer for whom your payoff would
be maximum. Note that you receive no information on the referrers who have selected
you.
• Competitive environment:
In the competitive environment, your payoff is positive only if your score in stage 3 is
higher or equal to the score of the referrer who has selected you.
Earnings for stage 3 = e6 - e0.10 × (your score - score of referrer) if you win
= 0e otherwise
• Cooperative environment:
Earnings for stage 3 = e0.10 × [(your score + score of referrer)/2]
If you are a referrer
Your payoff depends on your performance and on the performance of the candidate you
have selected in stage 2 for the situation randomly drawn.
• Competitive environment:
In the competitive environment, your payoff is positive only if your score in stage 3 is
higher or equal to the score of the referrer who has selected you, and if the score of the
candidate is positive.
Earnings for stage 3 = e6 - e0.10 × (your score - score of candidate) if you win
= 0e otherwise
• Cooperative environment:
Earnings for stage 3 = e0.10 × [(your score + score of candidate)/2]
21Appendix B: Panel formation algorithm
Two-step matching protocol
Lets consider a population Ω of size n, divided into two subpopulations F and M of
respective sizes |F| and |M|: Ω = {F; M}.
Each individual i ∈ Ω is associated with a performance yi ∈ N and a group membership
si ∈ {f, m}.
{i|si = f } ∈ F and {i|si = m} ∈ M
We want to build a panel of six individuals from the population Ω, satisfying the following
conditions:
• Parity: The panel includes three individuals from group F and three individuals
from group M.
• Inter-group balance: No significant difference in performance appears between
individuals from group F and individuals from group M. More precisely, for each
individual ik from group F with performance y(ik ) , the panel includes an individual
jk from group M with performance y(jk ) such that |y(jk ) − y(ik ) | 6 ǫ, ∀k = {1; 2; 3}.
We thereby minimize intergroup variance of performance.
• Intra-group heterogeneity: We aim at achieving sufficiently high intra-group
variance of performance under the aforementioned constraints of parity and inter-
group balance. In other words, if more than three female-male pairs could be selected
to achieve inter-group balance, we select three pairs to maximize intra-group vari-
ances VF and VM :
1X 1X
3 3
VF = (yik − y f )2 , y f = yi with ik ∈ F
3 k=1 3 k=1 k
1X 1X
3 3
VM = (yjk − y m )2 , y m = yj with jk ∈ M
3 k=1 3 k=1 k
Step one: Eligibility
The first step of the matching procedure aims at identifying all pairs {i; j}, i 6= j,
i ∈ F, j ∈ M that satisfy the condition:
|yi − yj | ≤ ǫ
In other words, we identify each pair including a member of group F and a member of
group M whose performance do not differ more than ǫ units. These pairs are defined as
eligible and are the ones considered in the second step of the procedure. This step ensures
22the satisfaction of the parity and inter-group balance conditions.
For ǫ = 0, inter-group variance would be set to 0. Although this would be an ideal sit-
uation, it may not be always possible to identify three exclusive pairs that satisfy this
condition. Step one proceeds therefore sequentially through a simple algorithm. Starting
from an initial value of ǫ = 0, if the protocol cannot identify three exclusive pairs, it
considers a value of ǫ = 1, and so on until the number of eligible pairs of candidates
reaches the lower limit of three.
Step two: Panel formation
The second step builds on the set of eligible pairs that have been identified in step one.
To ensure the condition on intra-group heterogeneity, three pairs out of the eligible pairs
are selected based on a variance criterion. Each pair is exclusive, i.e. an individual cannot
appear in more than one selected pairs.
The condition of inter-group balance is given priority over intra-group heterogeneity.
Therefore, if there are more than three female-male pairs that could be selected to achieve
inter-group balance, we build our final panel with the three pairs which maximize intra-
group variances VF and VM .
Following this matching protocol ensures the formation of a panel of six participants that
respects the desired properties:
• The panel includes three female-male pairs.
• Each pair is homogeneous in performance, i.e. the female and the male do not
significantly differ in performance.
• Pairs are different and can be ranked by referrers: the panel includes a low-performing,
a middle-performing and a high-performing pair.
23You can also read