Generation of ultrashort keV Ar+ ion pulses via femtosecond laser photoionization - IOPscience
←
→
Page content transcription
If your browser does not render page correctly, please read the page content below
PAPER • OPEN ACCESS

Generation of ultrashort keV Ar+ ion pulses via femtosecond laser
photoionization
To cite this article: Alexander Golombek et al 2021 New J. Phys. 23 033023

View the article online for updates and enhancements.

                              This content was downloaded from IP address 46.4.80.155 on 15/05/2021 at 08:29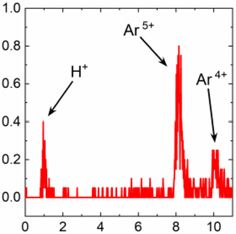
New J. Phys. 23 (2021) 033023                                                                 https://doi.org/10.1088/1367-2630/abe443

                                 PAPER

                                 Generation of ultrashort keV Ar+ ion pulses via femtosecond
O P E N AC C E S S
                                 laser photoionization
R E C E IVE D
30 September 2020
                                 Alexander Golombek ∗ , Lars Breuer, Lisa Danzig, Paul Kucharczyk, Marika Schleberger,
R E VISE D
25 January 2021
                                 Klaus Sokolowski-Tinten and Andreas Wucher
                                 Universität Duisburg-Essen, Fachbereich Physik, Lotharstraße 1, 47057 Duisburg, Germany
AC C E PTE D FOR PUBL IC ATION   ∗
8 February 2021
                                   Author to whom any correspondence should be addressed.

PUBL ISHE D
                                 E-mail: alexander.golombek@uni-due.de and andreas.wucher@uni-due.de
15 March 2021
                                 Keywords: ion solid interaction, ultrashort ion pulses, femtosecond laser ionization, strong field photoionization, tunnel ionization,
                                 ion bunching
Original content from
this work may be used
under the terms of the
Creative Commons                 Abstract
Attribution 4.0 licence.
Any further distribution         Ion beams with energies in the keV regime are widely utilized in solid-state physics, but the
of this work must                ultrafast dynamics triggered by an ion impact onto a solid surface is to date exclusively accessible
maintain attribution to
the author(s) and the            via simulations based on many untested assumptions and model parameters. A possible
title of the work, journal
citation and DOI.
                                 experimental access rests on the availability of a laser-synchronized ion source delivering
                                 sufficiently short ion pulses for time resolved pump–probe experiments. Here, we demonstrate a
                                 new miniaturized ion optical bunching setup for the creation of rare gas ion pulses using
                                 strong-field femtosecond laser photoionization. Neutral Ar gas atoms at room temperature are
                                 intercepted by a 50 fs, 800 nm laser pulse focused to ∼10 μm spot size. We demonstrate the
                                 generation of monoenergetic 2 keV Ar+ ion pulses with 180 ps duration (FWHM) at laser peak
                                 intensities around 1014 W cm−2 and of multiply charged Arq+ ions (q = 1–5) at higher laser
                                 intensities. The results are in good agreement with detailed ion trajectory simulations, which show
                                 that the temporal resolution is essentially limited by the initial (thermal) velocity spread of the
                                 generated photo-ions, indicating the possibility to achieve even better time resolution by cooling
                                 the gas prior to ionization.

                                 1. Introduction

                                 Ion beams are used in many scientific and technological applications and indispensable especially in the
                                 context of nanotechnology, since their potential for manipulating and analyzing matter on the atomic scale
                                 is unprecedented [1–3]. Apart from their routine use in surface analysis, they have been used to achieve
                                 superplastic nanoscale pore shaping [4], to image the nanophotonic modes of microresonators [5], to
                                 perform isotopic nanoscopy [6], to analyze the solid-electrolyte interphase of lithium-ion batteries [7], and
                                 almost regularly to fabricate nitrogen vacancy centers in diamonds to be used as qubits [8–11], to name just
                                 a few recent examples. In addition, ion beams particularly in the kiloelectronvolt impact energy range are
                                 being routinely used for the production, structuring and characterization of nanoscale surface coatings and
                                 devices [12]. However, this widespread and self-evident use lets us overlook that from experiments we know
                                 next to nothing about the initial non-equilibrium state induced by an ion impact as well as the subsequent
                                 dynamics. This serious lack of knowledge is inherently connected to the lack of ultrashort ion pulses, which
                                 could be used in state-of-the-art pump–probe experiments in order to study the ion-induced dynamics in
                                 real time. In contrast to lasers, where pulses well below 100 attoseconds can now be generated [13, 14], the
                                 development of short keV ion pulse sources stopped just below 1 ns [15].
                                     When an energetic ion or atom impinges onto a solid surface, various particles such as secondary ions,
                                 neutrals, electrons or photons can be excited and emitted due to the transfer of kinetic or potential energy
                                 from the projectile to the solid. Moreover, the projectile can be backscattered from the bombarded solid in
                                 various excitation or charge states. Computer simulations suggest that the microscopic energy transfer
                                 processes underlying the backscattering or emission of particles [16–18] as well as the related charge

                                 © 2021 The Author(s). Published by IOP Publishing Ltd on behalf of the Institute of Physics and Deutsche Physikalische Gesellschaft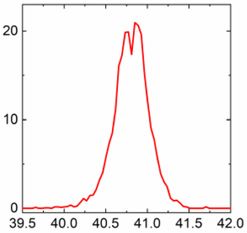
New J. Phys. 23 (2021) 033023 A Golombek et al
transfer and excitation dynamics [19–23] occur on extremely fast time scales on the order of picoseconds or
below. Measured data on, for instance, the neutralization efficiency of projectile ions penetrating thin
targets, the characteristics of backscattered projectiles as well as emitted surface particles, electrons or
photons provide experimental evidence supporting this notion. In practically all experiments, however,
asymptotic stages at the end of the ion-induced energy transfer processes are detected, while the underlying
microscopic non equilibrium dynamics must be inferred from comparison with theoretical model
calculations [24]. In order to overcome this limitation and gain a more direct experimental insight into the
ion-induced dynamics, we therefore currently pursue the strategy to establish a pump–probe technique
using a laser-synchronized ultrashort ion pulse as a stimulus (pump) in connection with a laser-based
analysis technique (probe) to follow, for instance, the ion-induced local order–disorder transition, transient
electronic excitation or particle emission in a time resolved manner.
As a necessary prerequisite for such an endeavor, it is essential to develop concepts for the production of
ultrashort ion pulses at ion energies in the keV regime. In state-of-the-art ion sources used, for instance, in
high resolution TOF instruments, ion packages of several nanoseconds length are generated via chopping of
a continuous ion beam and then compressed in time by bunching in a time dependent electric field located
somewhere downstream the beam line. Using this technique, it is now routinely possible to generate
nanosecond or even sub-nanosecond pulses of ions like Ga+ , Bi(n) + or Au(n) + [25] at ion energies of the
order of several ten keV. Using a similar concept, Linnarsson et al have demonstrated the generation of 100
keV proton pulses with a duration of about 400 ps for use in high resolution medium energy ion scattering
experiments [26]. In order to arrive at the (sub-)picosecond time regime necessary for direct time resolved
studies of the ultrafast ion-induced dynamics, we have recently developed a concept to generate
quasi-monoenergetic rare gas ion pulses at ion energies in the few keV range, which are synchronized with a
femtosecond laser pulse to allow for an optically delayed pump–probe experiment [27]. The basic idea is to
generate the ions via photoionization by intersecting a cloud of rare gas atoms with a tightly focused laser
beam. The ions generated this way are then accelerated in the direction perpendicular to the laser
propagation within an ion-optical bunching setup providing flight time focusing at the target surface. Due
to the small extension of the effective ionization volume within the laser focus, the energy spread
introduced by different starting positions of the ions within the (static) buncher field remains negligible. In
order to allow a manageable optical delay between pump and probe pulses, the total ion flight time must
not exceed a few 10 ns. As a consequence, the entire buncher needs to be strongly miniaturized to ensure an
ion flight path of only a few mm length. In this work, we therefore test the combination of a tightly focused
femtosecond laser beam with such a miniaturized buncher setup via photoionization of neutral Argon gas
atoms backfilled into the ionization chamber at room temperature and detection of the resulting Arq+ ions
by a fast multichannel plate (MCP) detector mimicking the target surface. The aim is to gain a fundamental
understanding of the buncher regarding its exact geometry, its flight time focusing properties, the role of
different boundary conditions as well as photoionization properties like the mean number of ions created
per laser pulse and the charge state distribution of the generated ions. We will show that it is possible to
generate a 2 keV Ar+ ion pulse with a duration of the order of 100 ps at a total ion flight time well below
100 ns. This result will be compared to detailed numerical ion trajectory simulations, which show that the
achieved pulse width is essentially determined by the thermal velocity spread of the generated photo-ions,
thereby opening the possibility to further improve the temporal resolution via cooling of the neutral
precursor gas.
2. Methods
The experimental setup consists of an ultrahigh vacuum (UHV) chamber, which contains the ion buncher
as well as the MCP detector, and a tabletop laser system to produce femtosecond laser pulses passing the
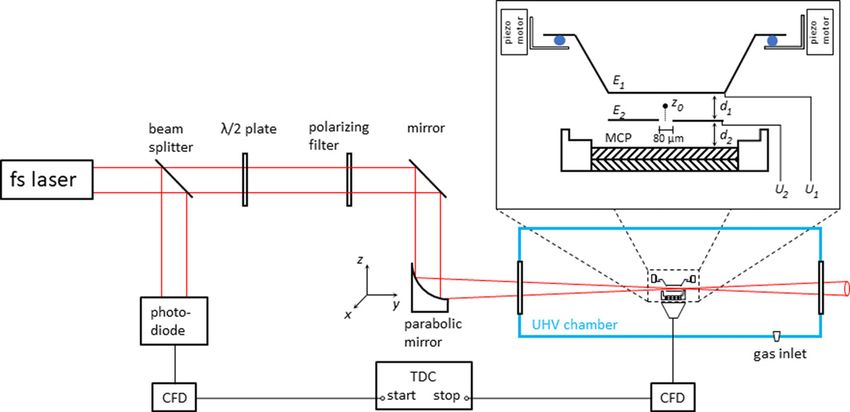
vacuum chamber as described in detail below. A schematic of the experimental setup within and outside the
UHV chamber (blue box) as well as a blow-up of the actual ion buncher is depicted in figure 1.
The tabletop laser system produces laser pulses of ∼50 fs duration at a repetition rate of 1 kHz and a
wavelength of 800 nm. A beam splitter reflects about 1% of the laser radiation onto a fast avalanche
photodiode (BPW-28), which provides a starting trigger signal for the ion flight time measurement (see
below). The combination of a λ/2 plate with a polarizing filter in the beamline allows to adjust the intensity
of the laser beam, with the maximum average output power being measured with a power meter (Coherent
FieldMate) as 1.4 W before the last mirror. The circularly shaped laser beam is subsequently focused by an
off-axis parabolic mirror (f = 101.6 mm) to a 10 μm (FWHM) waist diameter into the gap between the
electrodes E1 and E2 with a lateral diameter of 11 mm each, where the focusing element is translatable on a
micrometer xyz stage to precisely steer the laser focus position above an 80 μm diameter pinhole in the
center of E2 (see inset of figure 1). In the focal plane, the laser yields a maximum achievable peak power
2New J. Phys. 23 (2021) 033023 A Golombek et al
Figure 1. Schematic of the experimental setup. The femtosecond laser beam is focused into the UHV ionization chamber (blue
box) via an off-axis parabolic mirror mounted on a xyz manipulator. A fast photodiode monitors the firing of the laser pulse to a
start input for a TDC, the stop input is given by ions hitting the MCP detector. Piezo motors allow to move the upper electrode
E1 against the stack of E2 and detector to ensure a parallel electric field and a defined distance d1 (see inset). Argon gas can be
backfilled into the UHV chamber via a gas inlet.
density of about 3.5 × 10¹⁶ W cm−2 . The third (target) electrode E3 of the buncher setup is formed by the
front of an ultrafast MCP detector (Photonis Gen2 TOF Detector) below E2 , which is optimized to provide
an ultimate time resolution on the order of 50 ps (manufacturer specification). The distance d2 between E2
and the MCP front is fixed to a few mm by a machined ceramic (MACOR) insulator, while the distance d1
as well as the angular tilt between E1 and E2 can be adjusted with sub-micron precision using three piezo
motors (SmarAct SLC-1720) connected to the upper electrode via isolating sapphire balls. The
three-electrode bunching setup represents a so-called Wiley-McLaren configuration [28], which allows to
adjust the two electric fields in order to ensure first order flight time focusing for ions starting in an
xy-plane located at any position z0 along the ion extraction direction z. For that purpose, each electrode can
independently be set to a selectable electric potential between zero and ±10 kV with respect to ground. In
the setup used for the present work, the collector electrode of the MCP detector was grounded, and the
potential at the MCP front was set to U MCP = −2000 V to provide sufficient gain to efficiently detect single
ion pulses. The potential at E2 was chosen as U 2 = −2000 V as well, resulting in a zero electric field
between E2 and E3 . For symmetry reasons, the potential at the upper electrode E1 was set to U 1 = +2000 V.
Under these conditions, first order flight time focusing occurs for ions starting at a position
z0 = d2 /2 (1.1)
above the upper surface of electrode E2 , and the total ion flight time to electrode E3 is given by
m d1 √ d2
t= × 2 z0 + √ , (1.2)
qe ΔU 2 z0
with m being the mass of a given ion and q its charge state, e denoting the elementary charge and ΔU the
total potential difference between E1 and E2 .
Since the laser focus of 10 μm diameter needs to be positioned and centered above the 80 μm aperture
in electrode E2 , a coarse alignment was performed under atmospheric conditions by removing the top
electrode and positioning the focal spot above the center of the second electrode by eye. In doing so, we
make use of a clearly visible local electrical breakdown in air around the laser focus. In addition, the laser
beam profile was monitored at the exit window of the UHV chamber and adjusted to a rotationally
symmetric shape via self-modulation of the beam, which is a good indicator of a well-aligned beam line
with the parabolic mirror. After repositioning the top electrode, the vacuum chamber was pumped down to
a base pressure of 3 × 10⁻⁸ mbar using a 300 l s−1 turbomolecular pump. During the ionization
experiment, the chamber was homogeneously back-filled with Argon gas with a partial pressure of
7 × 10⁻⁷ mbar (pressure reading of 9 × 10⁻⁷ mbar from a calibrated ion gauge (Leybold IoniVac ITR 90)
corrected by a factor 0.8 for Argon as specified by the manufacturer). After applying the specified voltages,
the laser intensity was set to an average power of about 16 mW measured with a laser power meter
3New J. Phys. 23 (2021) 033023 A Golombek et al
Figure 2. Comparison of first TOF mass spectra obtained with (a) Argon gas back-filled into the ionization chamber and (b) the
residual gas only with a laser peak power density of 4.3 × 10¹⁴ W cm−2 at 800 nm.
(Coherent FieldMate) in the beam before the parabolic mirror, which is subsequently focused to a peak
power density of about 4.3 × 10¹⁴ W cm−2 . For the production of Ar+ ions (IP = 15.76 eV), this leads to a
Keldysh parameter of γ = IP/2Up = 0.55 (with U p being the ponderomotive potential of an electron in
the 800 nm laser field), thereby indicating a tunnel ionization process [29].
Subsequently, ions created at the laser focus located between E1 and E2 were accelerated along the
z-direction (perpendicular to the laser beam) towards the MCP detector, thereby passing through the
aperture in E2 . A single ion hitting the detector produced an output pulse with an average height of about
30 mV at the 50 Ω termination of the collector, which was then processed using a specially selected fast
preamplifier in combination with a constant fraction discriminator (CFD) (both manufactured by Surface
Concept GmbH, Mainz, Germany) delivering a time resolution below 50 ps as specified by the
manufacturer. A properly matched time-to-digital converter (TDC) (Surface Concept-TDC-1000/02 D)
triggered by the photodiode signal then recorded the arrival time of the incoming ions relative to the firing
of the laser with a bin width of 27.4 ps. For that purpose, the output pulses of the photodiode were
processed by another CFD (Ortec Model 935 Quad 200 MHz CFD), thereby ensuring a time jitter of the
starting pulse of typically 25 ps. The laser intensity was adjusted such that less than a single ion of the
desired charge state was produced per laser pulse, and the kHz repetition of this experiment then allows to
sum over all detected ions, thereby generating a flight time spectrum which corresponds to the arrival time
distribution of the ions at the target surface (here: the MCP detector). The total flight time determined by
the peak in the measured TOF distribution then allows to clearly separate between different ion species
and/or charge states.
The first TOF spectrum measured under these conditions is shown in figure 2(a). The two detected
peaks are identified as arising from H2 O+ and Ar+ ions, respectively. The corresponding blank spectrum
measured without Argon gas inlet is shown in figure 2(b). It is seen that the Ar+ peak is completely absent
in the blank spectrum, while the H2 O+ peak remains unchanged and must therefore clearly originate from
residual gas ionization. Comparing the total number of counts detected in both spectra, we find that an
average of 0.15 Ar+ and 0.08 H2 O+ ions are generated per single laser shot. At first glance, this ratio
appears surprising in view of the much larger ratio (>20) between the number density of back-filled Ar
atoms and residual gas H2 O molecules, respectively. We attribute this finding to the fact that the ionization
potential of H2 O molecules (12.6 eV) is significantly lower than that of Ar atoms, thus making the
strong-field photoionization process more efficient for water. As a consequence, the effective ionization
volume for H2 O+ formation is much larger than that for Ar+ formation. As a side remark, we mention that
a TOF spectrum similar to that depicted in figure 2(a) has been reported by Höhr et al [15] using a similar
concept to generate sub-nanosecond Ar+ ion pulses as employed here.
It should be noted, however, that the H2 O+ ion peak was found to decrease in intensity with time after
pumpdown of the chamber. In fact, the observed decrease was more pronounced than that of the measured
residual gas pressure, indicating that outgassing of the buncher electrodes led to a higher water partial
pressure within the buncher electrode gap. After sufficient pumping time, the water peak therefore
practically disappeared from the measured spectra.
4New J. Phys. 23 (2021) 033023 A Golombek et al
3. Results and discussion
3.1. Lateral laser scan
After the successful detection of laser-ionized Argon ions, a first measurement was performed by scanning
the laser focus along the x-axis, i.e. in a direction parallel to the electrode surfaces but perpendicular to the
laser beam propagation. The result is depicted in figure 3, where the integrated total number of detected
Ar+ ions is plotted against the x-position of the focusing parabolic mirror.
In acquiring the data, spectra were summed for a burst of 1000 laser shots and then averaged over a total
number of 20 such bursts. In interpreting the data of figure 3, it is of note that the signal measured at a
specific x-position represents an integral of the photoionization efficiency pi (x, y) convoluted with the
ion-optical transmission function T(x, y). While the former is connected with the spatial laser intensity
distribution I L (x, y) in directions perpendicular and parallel to the laser beam, the latter is determined by
the diameter d of the aperture in electrode E2 and should be roughly given as
⎧
⎨1 for x2 + y2 d2 /4
T x, y = .
⎩0 elsewhere
Due to the strongly non-linear laser intensity dependence of pi , it is not easy to predict the expected
behavior. The indicated curve included in figure 3 corresponds to a least square fit of an arbitrarily selected
Gaussian function which yields a FWHM of 30 μm. Detectable signal is observed in a range of
6σ x ≈ 2.55 × FWHM = 76.5 ± 4 μm, which roughly corresponds to the 80 μm diameter aperture in
electrode E2 . The fit indicates the distribution to be centered at x = 8.115 mm, which is therefore identified
as the position of the ion optical axis through the center of that aperture. For the remainder of this work,
the laser x-position was set to and kept at this value.
Apart from the laser alignment, there is another important conclusion that can be drawn from the data
plotted in figure 3. In our previous work using a VUV laser beam in order to characterize a supersonic
Argon expansion, we found that the laser induced Ar+ ion signal was actually generated by electron impact
ionization via photoelectrons produced somewhere in the ionization chamber. Back then, the characteristic
signature of this ‘photoelectron-impact ionization’ process was the observation that the measured ion signal
was essentially independent of the laser beam focus position. In pronounced contrast, here we detect no ion
signal at all if the laser focus is positioned outside the ion-optical acceptance window of the buncher
electrodes, thereby clearly demonstrating that the detected ions are indeed produced via photoionization.
This finding is important in view of the targeted application, since it shows that the influence of secondary
electrons produced by laser stray light hitting the electrode in our strongly miniaturized buncher setup is
negligible.
Figure 3. Scan of the laser position along the x direction above the 80 μm aperture in electrode E2. The total integrated signal
measured at each laser position is displayed per burst of 1000 laser pulses. Solid line: least square fit of Gaussian function to the
data in order to extract the indicated FWHM of the distribution.
5New J. Phys. 23 (2021) 033023 A Golombek et al
3.2. Flight time focusing
In order to determine the optimum flight time focusing position z0 along the ion extraction axis z
perpendicular to all electrodes, flight time distributions of the generated photoions were measured as a
function of the laser focus position. Figure 4 displays the resulting measurement for Ar+ ions generated at a
moderate laser peak intensity of about 1014 W cm−2 . For comparison, the theoretically expected behavior
according to equation (1.2) was fitted to the data as shown by the solid line.
It is seen that the theoretical expectation describes the measured data quite well, so that the fit allows to
extract the exact values of the geometrical distances d1 = (2.6 ± 0.12) mm and d2 = (2.92 ± 0.035) mm,
respectively, as well as the flight time focus position z0 = 1.45 mm, i.e. at d2 /2 above electrode E2 in
accordance with equation (1.1). Once the exact geometry is known, we can compare the measured ion
arrival time with the total ion flight time of about 54 ns calculated for 2 keV Ar+ ions from equation (1.2)
using ΔU = 4 kV. As a result, it is found that an offset of t 0 = (11.7 ± 1.7) ns needs to be subtracted from
the measured arrival time in order to match the flight time, which likely results from the difference in cable
lengths and processing times of the electronics connected to the photodiode monitoring the laser pulse and
the ion detector, respectively.
As a next step, we evaluate the width of the Ar+ arrival time distribution by arbitrarily fitting a Gaussian
function to the measured TOF peak. This method is chosen rather than directly measuring the FWHM of
the binned flight time distribution, since (i) it is not easy to exactly identify the peak maximum from the
binned data and (ii) the fitting procedure reduces the error introduced by statistical noise. The resulting
FWHM is plotted against the ion starting coordinate in figure 5, where a plateau of 200 to 220 ps is visible
between z = 1.1 and 2.3 mm. The rise at the left and right side likely results from blocking the laser due to
geometric constraints, thus distorting the pulse shape and the FWHM of the arrival time distribution. Since
the ionizing laser pulse is very short (∼50 fs) and space charge broadening is absent for the single ion pulses
recorded here, the observed width is determined by the statistical distribution of ion starting positions and
initial velocities. The flight time dispersion induced by the spread of starting positions can be visualized
from the slope of the curve displayed in figure 4. The resulting ‘geometric’ dispersion obviously depends on
the laser position. Its magnitude can easily be estimated by convoluting the Gaussian laser intensity profile
with the curve plotted in figure 4. In fact, this will overestimate the geometric dispersion, since the
ionization probability depends on the laser intensity in a strongly nonlinear manner, so that the real
ionization profile will be narrower than the laser intensity profile. A more realistic estimate of this effect is
described in references [27, 30] and used in the numerical simulations described below in section 3.4. In
any case, it is evident from figure 5 that geometric broadening is minimized if the laser is positioned at or
close to the flight time focusing position z0 = 1.45 mm determined by the local minimum in figure 4.
Interestingly, the smallest pulse width is not observed at exactly this position, but rather at zopt = 1.85 mm,
i.e. 0.4 mm farther away from electrode E2 . Estimating the remaining geometric dispersion at z0 and zopt ,
one arrives at a geometric flight time broadening of a few picoseconds, which is much smaller than the
actually observed width of about 200 ps (see further below), indicating that the pulse width cannot be
significantly influenced by the buncher’s flight time focusing properties in this regime.
Figure 4. Measured time of flight as a function of the laser position z. Solid line: least square fit of the expected theoretical
behavior according to equation (1.2) using the values of d1 and d2 and a flight time offset t 0 as fit parameters (see text).
6New J. Phys. 23 (2021) 033023 A Golombek et al
Figure 5. Temporal widths (FWHM) of the measured Ar+ TOF distributions vs the ionization laser focus position z. The
distributions were accumulated from around 1.8 × 10⁴ single ion impacts generated in 2 × 10⁴ laser shots.
Figure 6. Arrival time distribution of 2 keV Ar+ ions measured with the photoionization laser focus positioned at
zopt = 1.85 mm (a) and z0 = 1.45 mm (b). The ions were registered at the front electrode of a fast MCP detector mimicking the
target surface E3 of the three-electrode ion buncher. For the definition of zopt and z0 see text.
The second critical effect influencing the measured pulse width is the distribution of the starting
velocities of the ions at the beginning of their acceleration. Since the experiments reported here were
performed with Argon gas introduced at room temperature, the corresponding velocity distribution is
determined by the thermal motion of the neutral Ar atoms, which remains essentially unchanged upon
photoionization and therefore holds for the laser-generated ions as well. In principle, it is relatively easy to
estimate the order of magnitude of the flight time dispersion induced by this thermal velocity spread. For
that purpose, it is convenient to calculate the turn-around time of an ion starting with initial velocity v 0 in
the direction opposite to the ion extraction. This ion will then initially be decelerated in the extraction field,
until it comes to a stop, turns around and reaches its original z-position again after a time t z . From that
point on, it will follow exactly the same trajectory as another ion initially starting with thesame velocity v 0
directed along the ion extraction axis. Calculating t z for an average thermal velocity v z = 2kB T/πm of Ar
atoms at room temperature yields a thermal flight time broadening of the order of 100 ps in reasonable
agreement with the data in figure 5. A more detailed simulation of the ion flight time distribution including
the thermally induced flight time broadening is described in section 3.4 below.
The raw data of the sharpest ion flight time distribution measured with the laser focus positioned at the
optimum position zopt = 1.85 mm is shown in figure 6(a). The distribution was accumulated over 2 × 10⁴
laser shots with the detection of 0.9 single 2 keV Ar+ ions per shot, thereby virtually excluding any space
7New J. Phys. 23 (2021) 033023 A Golombek et al
Figure 7. Flight time spectrum measured at the nominal flight time focus position z0 and with an increased laser peak intensity
of 2.4 × 10¹⁶ W cm−2 under otherwise identical conditions as used before. The bottom axis was converted to apparent m/q values
in order to unambiguously identify the signals arising from multiply charged Arq+ ions. Left insert: zoom of small signals
detected for q = 4 and 5 as well as for H+ . Right insert: zoom of Ar+ ion signal.
charge broadening. It is seen that the ion arrival time distribution at the MCP detector exhibits a fairly
symmetric shape with a width of 180 ps (FWHM). For comparison, figure 6(b) shows similar distribution
measured at the nominal flight time focusing position z0 , which is seen to exhibit a slightly more
asymmetric shape with, however, nearly the same width as the one measured at zopt . To our knowledge, the
data displayed in figure 6 constitute the sharpest time resolution reached to date for the impact of heavy
ions with keV energies. The above estimate shows that the pulse width is largely determined by the thermal
velocity spread of the neutral gas atoms prior to photoionization. In order to shorten the pulse width
further, it is therefore necessary to cool the gas. In fact, it is easy to estimate that a gas temperature of the
order of 0.1 K or below would be needed in order to allow the generation of ion arrival time distributions
with ∼1 ps width.
3.3. Charge states
A further aspect of the investigated short-pulse ion source is the possibility to generate multiply charged
ions as well. In principle, one would expect a sequential appearance of higher charge states with increasing
laser intensity, while at the same time lower charge states become sequentially depleted. In order to
demonstrate this possibility, the laser peak intensity was increased by about two orders of magnitude and
the flight time spectrum was measured at the nominal flight time focus position z0 under otherwise
identical conditions as applied before. The resulting data are displayed in figure 7. In order to
unambiguously identify the peaks of multiply charged ions in the measured spectrum, the bottom axis was
converted from flight time to apparent mass-to-charge ratio.
At the particular laser intensity chosen here, one observes a dominant Ar2+ ion peak, but Ar3+ is already
clearly detectable. As shown in the left insert, Ar4+ and Ar5+ ions are also detected, albeit with relatively low
intensity. Integrating the measured peaks, one obtains an Ar3+ /Ar2+ ratio of about 0.2. It is not easy to
compare this value with published literature data, since most of the corresponding experiments—and
particularly those performed for Arq+ ions—were performed without restriction of the effective ionization
volume (see, for instance reference [31]). Hänsch et al [32] have developed a technique to restrict this
volume by means of a pinhole in the ion extraction electrode, which is similar to our setup with a 80 μm
diameter pinhole in electrode E2 . Under these conditions, the charge state distribution of Xeq+ ions was
measured as a function of the central laser intensity for a similar laser beam as used here. With increasing
intensity, a maximum Xe+ ion count was found at around 1 × 10¹⁴ W cm−2 , which then decreases and
transforms to an increasing Xe2+ signal and a slowly rising count rate of Xe3+ as well. In principle, such a
behavior is in accordance with standard tunnel ionization theory [33], which predicts sequential maxima of
increasing charge states with increasing laser intensity. Although not shown, we note that we observe a
similar behavior for our Arq+ signals as well. It is, however, quite remarkable that the Ar5+ signal in figure 7
is about 3.5 times higher than that for Ar4+ , which is contra-intuitive and provides a clear indication of a
non-sequential multiple ionization process.
8New J. Phys. 23 (2021) 033023 A Golombek et al
As expected and discussed above, the signal of singly charged Argon ions can still be seen in figure 7,
albeit at reduced intensity compared to doubly charged ions. A blow-up of the respective flight time
distribution is shown in the right insert. It is seen that (i) the most probable flight time of the Ar+ ions is
slightly above that expected for m/q = 40 and (ii) the flight time distribution exhibits a double-peak
structure. We attribute this behavior to the fact that these ions are not created in the center of the laser
focus but originate from the wings of the beam profile where the laser intensity is lower. Their starting
position is therefore slightly off the flight time focusing position z0 corresponding to minimum flight time.
As a consequence, these ions need longer times to reach the detector and therefore appear at later times in
the flight time spectrum, therefore appearing at a higher m/q in the converted mass spectrum. The double
peak structure observed for the Ar1+ ions supports this interpretation, since the ion flight times on both
sides of z0 show a slightly asymmetric behavior (see figure 4). In summary, the data shown here prove that
it is possible to generate short pulses of multiply charged ions with charge states up to at least q = 5, thereby
enabling the study of charge-state effects on the ion-induced non-equilibrium dynamics.
3.4. Comparison to numerical simulations
To understand and predict the properties of the generated ion pulses, detailed numerical simulations are
being performed in our research group. In these simulations, a realistic model is used including both the
formation of ions from a thermal ensemble of neutral gas atoms via strong-field laser photoionization and
their trajectories in the buncher field. A detailed description of the used procedure can be found in
references [27, 30]. Briefly, the buncher electrode geometry is implemented in the charged particle optics
code and the electric fields are calculated by numerically solving the Laplace equation. The calculated field
configuration is then transmitted to the generalized particle tracker code in order to follow the ion
trajectories. As starting conditions, the initial ion positions are randomly chosen according to a probability
distribution calculated from the laser profile using standard strong-field photoionization theory [33]. Their
starting velocity is then randomly chosen according to thermal distributions for the three velocity
components (v x , v y , v z ) using, e.g. different temperature values for each direction. Depending on the laser
intensity, clouds of ions with different charge states are generated this way, the trajectories of which are then
traced by explicitly taking into account the space charge interaction between all individual ions at each time
step. In view of the experiments performed here, we calculated the flight time distribution for ions starting
with an isotropic thermal velocity distribution at room temperature. Figure 8(a) shows the resulting
simulated arrival time distribution of single Ar+ ions starting at a temperature of 300 K. For comparison,
figure 8(b) shows the flight time distribution calculated for the same ions starting at a temperature of 0 K.
It is obvious that the shape of the simulated room temperature distribution is entirely dominated by the
thermal ion starting velocity spread, rendering the influence of geometric flight time dispersion as seen in
figure 8(b) negligible. Probably the most important observation is that the predicted distribution in
figure 8(a) closely resembles the experimentally measured distributions displayed in figure 6. In particular,
the simulated pulse width of 150 ps is in astonishingly good agreement with the measured width of 180 ps
in figure 6(a). Furthermore, the pulse shapes are comparable as well, both resembling a Gaussian profile
Figure 8. Simulated flight time histogram of singly charged Ar+ ions calculated for the same buncher geometry as used in the
experiments. The starting positions of the ions were randomly selected according to a calculated photo-ionization efficiency
profile, while the starting velocities were randomly selected according to a thermal distribution at a temperature of 300 K (a) and
0 K (b), respectively.
9New J. Phys. 23 (2021) 033023 A Golombek et al with nearly symmetric sides. The remaining difference between predicted and measured pulse widths likely results from various possible experimental errors, such as not perfectly aligned electrodes, the limited time resolution of the MCP detector as well as potential time jitter of the TDC starting pulse. Nevertheless, the fact that comparable pulse shapes are observed in experiment and simulation provides a good indication for the functionality of the ion buncher setup on one hand and lends credibility to the simulation procedure on the other hand, especially in hindsight of our planned future experiments with ultracold atoms. We are confident that the ion flight time distribution of 8 ps pulse width simulated for T = 0 K, as shown in figure 8(b), can be further compressed to (sub-)picosecond range by properly adjusting the electric field strengths for an optimal flight time focus within the buncher setup. 4. Conclusion and outlook The data presented here demonstrate that it is possible to generate short Argon ion pulses with sub-nanosecond (
New J. Phys. 23 (2021) 033023                                                                                        A Golombek et al

ORCID iDs

Andreas Wucher          https://orcid.org/0000-0002-9244-9491

References

 [1] Li J, Stein D, McMullan C, Branton D, Aziz M J and Golovchenko J A 2001 Ion-beam sculpting at nanometre length scales Nature
     412 166–9
 [2] Krasheninnikov A V and Banhart F 2007 Engineering of nanostructured carbon materials with electron or ion beams Nat. Mater.
     6 723–33
 [3] Hayworth K J, Peale D, Januszewski M, Knott G W, Lu Z, Xu C S and Hess H F 2020 Gas cluster ion beam SEM for imaging of
     large tissue samples with 10 nm isotropic resolution Nat. Methods 17 68–71
 [4] Aramesh M, Mayamei Y, Wolff A and Ostrikov K K 2018 Superplastic nanoscale pore shaping by ion irradiation Nat. Commun. 9
     835
 [5] Twedt K A, Zou J, Davanco M, Srinivasan K, McClelland J J and Aksyuk V A 2016 Imaging nanophotonic modes of
     microresonators using a focused ion beam Nat. Photon. 10 35
 [6] Saka S K, Vogts A, Kröhnert K, Hillion F, Rizzoli S O and Wessels J T 2014 Correlated optical and isotopic nanoscopy Nat.
     Commun. 5 3664
 [7] Zhou Y et al 2020 Real-time mass spectrometric characterization of the solid-electrolyte interphase of a lithium-ion battery Nat.
     Nanotechnol. 15 224–30
 [8] Gaebel T et al 2006 Room-temperature coherent coupling of single spins in diamond Nat. Phys. 2 408–13
 [9] Dolde F et al 2013 Room-temperature entanglement between single defect spins in diamond Nat. Phys. 9 139–43
[10] Schröder T et al 2017 Scalable focused ion beam creation of nearly lifetime-limited single quantum emitters in diamond
     nanostructures Nat. Commun. 8 15376
[11] Lühmann T, John R, Wunderlich R, Meijer J and Pezzagna S 2019 Coulomb-driven single defect engineering for scalable qubits
     and spin sensors in diamond Nat. Commun. 10 4956
[12] Hellborg R, Whitlow H J and Zhang Y 2009 Ion Beams in Nanoscience and Technology (Berlin: Springer)
[13] Chini M, Zhao K and Chang Z 2014 The generation, characterization and applications of broadband isolated attosecond pulses
     Nat. Photon. 8 178
[14] Gaumnitz T, Jain A, Pertot Y, Huppert M, Jordan I, Ardana-Lamas F and Wörner H J 2017 Streaking of 43-attosecond soft-x-ray
     pulses generated by a passively CEP-stable mid-infrared driver Opt. Express 25 27506–18
[15] Höhr C, Fischer D, Moshammer R, Dorn A and Ullrich J 2008 A subnanosecond pulsed ion source for micrometer focused ion
     beams Rev. Sci. Instrum. 79 053102
[16] Harrison D E Jr 1988 Application of molecular dynamics simulations to the study of ion-bombarded metal surfaces Crit. Rev.
     Solid State Mater. Sci. 14 1–78
[17] Urbassek H 2006 Sputter theory. Ion-beam science–solved and unsolved problems Mat.-Fys. Medd. K. Dan. Vidensk. Selsk. 52
     433–63
[18] Garrison B J and Postawa Z 2008 Computational view of surface based organic mass spectrometry Mass Spectrom. Rev. 27
     289–315
[19] Weidtmann B, Duvenbeck A and Wucher A 2008 Predicting secondary ion formation in molecular dynamics simulations of
     sputtering Appl. Surf. Sci. 255 813–5
[20] Lehtinen O, Kotakoski J, Krasheninnikov A, Tolvanen A, Nordlund K and Keinonen J 2010 Effects of ion bombardment on a
     two-dimensional target: atomistic simulations of graphene irradiation Phys. Rev. B 81 153401
[21] Duvenbeck A, Weidtmann B and Wucher A 2010 Predicting kinetic electron emission in molecular dynamics simulations of
     sputtering J. Phys. Chem. C 114 5715–20
[22] Wucher A and Duvenbeck A 2011 Kinetic excitation of metallic solids: progress towards a microscopic model Nucl. Instrum.
     Methods Phys. Res. B 269 1655–60
[23] Darkins R and Duffy D M 2018 Modelling radiation effects in solids with two-temperature molecular dynamics Comput. Mater.
     Sci. 147 145–53
[24] Aumayr F et al 2019 Roadmap on photonic, electronic and atomic collision physics: III. Heavy particles: with zero to relativistic
     speeds J. Phys. B: At. Mol. Opt. Phys. 52 171003
[25] Kollmer F 2004 Cluster primary ion bombardment of organic materials Appl. Surf. Sci. 231–232 153–8
[26] Linnarsson M K, Hallén A, Åström J, Primetzhofer D, Legendre S and Possnert G 2012 New beam line for time-of-flight medium
     energy ion scattering with large area position sensitive detector Rev. Sci. Instrum. 83 095107
[27] Breuers A, Herder M, Kucharczyk P, Schleberger M, Sokolowski-Tinten K and Wucher A 2019 A concept to generate ultrashort
     ion pulses for pump–probe experiments in the keV energy range New J. Phys. 21 053017
[28] Wiley W C and McLaren I H 1955 Time-of-flight mass spectrometer with improved resolution Rev. Sci. Instrum. 26 1150–7
[29] Augst S, Strickland D, Meyerhofer D D, Chin S-L and Eberly J H 1989 Tunneling ionization of noble gases in a high-intensity
     laser field Phys. Rev. Lett. 63 2212–5
[30] Kucharczyk P, Golombek A and Wucher A 2020 Generation of ultrashort ion pulses in the keV range: numerical simulations
     Nucl. Instrum. Methods Phys. Res. B 483 41–9
[31] Augst S, Meyerhofer D D, Strickland D and Chint S L 1991 Laser ionization of noble gases by Coulomb-barrier suppression J.
     Opt. Soc. Am. B 8 858–67
[32] Hansch P, Walker M and Van Woerkom L 1996 Spatially dependent multiphoton multiple ionization Phys. Rev. A 54 2559–62
[33] Ammosov M V, Delone N B and Krainov V B 1986 Tunnel ionization of complex atoms and atomic ions in alternating
     electromagnetic fields Soviet Physics - JETP 64 1191–4
[34] Liu Y et al 2010 Multiphoton double ionization of Ar and Ne close to threshold Phys. Rev. Lett. 104 173002
[35] Zrost K, Rudenko A, Ergler T, Feuerstein B, Jesus V L B d, Schröter C D, Moshammer R and Ullrich J 2006 Multiple ionization of
     Ne and Ar by intense 25 fs laser pulses: few-electron dynamics studied with ion momentum spectroscopy J. Phys. B: At. Mol. Opt.
     Phys. 39 S371

                                                     11
New J. Phys. 23 (2021) 033023 A Golombek et al
[36] Feuerstein B et al 2001 Separation of recollision mechanisms in nonsequential strong field double ionization of Ar: the role of
excitation tunneling Phys. Rev. Lett. 87 043003
[37] Moshammer R et al 2000 Momentum distributions of Nen+ Ions created by an intense ultrashort laser pulse Phys. Rev. Lett. 84
447
[38] Ullrich J, Moshammer R, Dörner R, Jagutzki O, Mergel V, Schmidt-Böcking H and Spielberger L 1997 Recoil-ion momentum
spectroscopy J. Phys. B: At. Mol. Opt. Phys. 30 2917
12You can also read