Genome-Wide Association Studies Based on Equine Joint Angle Measurements Reveal New QTL Affecting the Conformation of Horses - MDPI
←
→
Page content transcription
If your browser does not render page correctly, please read the page content below
G C A T
T A C G
G C A T
           genes
Article
Genome-Wide Association Studies Based on Equine
Joint Angle Measurements Reveal New QTL
Affecting the Conformation of Horses
Annik Imogen Gmel 1,2, * , Thomas Druml 3 , Rudolf von Niederhäusern 1 , Tosso Leeb 2                     and
Markus Neuditschko 1
 1   Agroscope—Swiss National Stud Farm, Les Longs-Prés, 1580 Avenches, Switzerland;
     ruedi.vonniederhaeusern@agroscope.admin.ch (R.v.N.); markus.neuditschko@agroscope.admin.ch (M.N.)
 2   Institute of Genetics, Vetsuisse Faculty, University of Bern, Bremgartenstrasse 109a, 3012 Bern, Switzerland;
     tosso.leeb@vetsuisse.unibe.ch
 3   Institute of Animal Breeding and Genetics, Veterinary University Vienna, Veterinärplatz 1,
     A-1210 Vienna, Austria; thomas.druml@vetmeduni.ac.at
 *   Correspondence: annik.gmel@agroscope.admin.ch; Tel.: +41-58-482-62-10

 Received: 8 April 2019; Accepted: 3 May 2019; Published: 14 May 2019

 Abstract: The evaluation of conformation traits is an important part of selection for breeding stallions
 and mares. Some of these judged conformation traits involve joint angles that are associated with
 performance, health, and longevity. To improve our understanding of the genetic background
 of joint angles in horses, we have objectively measured the angles of the poll, elbow, carpal,
 fetlock (front and hind), hip, stifle, and hock joints based on one photograph of each of the
 300 Franches-Montagnes (FM) and 224 Lipizzan (LIP) horses. After quality control, genome-wide
 association studies (GWASs) for these traits were performed on 495 horses, using 374,070 genome-wide
 single nucleotide polymorphisms (SNPs) in a mixed-effect model. We identified two significant
 quantitative trait loci (QTL) for the poll angle on ECA28 (p = 1.36 × 10⁻⁷ ), 50 kb downstream of the
 ALX1 gene, involved in cranial morphology, and for the elbow joint on ECA29 (p = 1.69 × 10⁻⁷ ), 49 kb
 downstream of the RSU1 gene, and 75 kb upstream of the PTER gene. Both genes are associated
 with bone mineral density in humans. Furthermore, we identified other suggestive QTL associated
 with the stifle joint on ECA8 (p = 3.10 × 10⁻⁷ ); the poll on ECA1 (p = 6.83 × 10⁻⁷ ); the fetlock joint
 of the hind limb on ECA27 (p = 5.42 × 10⁻⁷ ); and the carpal joint angle on ECA3 (p = 6.24 × 10⁻⁷ ),
 ECA4 (p = 6.07 × 10⁻⁷ ), and ECA7 (p = 8.83 × 10⁻⁷ ). The application of angular measurements in
 genetic studies may increase our understanding of the underlying genetic effects of important traits
 in equine breeding.

 Keywords: GWAS; equus caballus; development; growth; carpus; poll; elbow; stifle

1. Introduction
     Conformation, the overall morphology of an animal, is an important selection criterion in horse
breeding [1]. It reflects the general appearance of an animal and is associated with locomotor health
and sports performance [2]. Conformation is comprised of many traits that describe specific parts of the
body (e.g., head and neck, forehand, chest, back, or hindquarters), the distal limb morphology (carpal,
fetlock, stifle, and hock joints), or the overall proportions of the animal (e.g., type and harmony) [3–5].
The latter are often related to aesthetics, but are also breed specific [6]. Traits such as the slope or
inclination of the shoulder and croup, the elbow, carpal, stifle, hock, fetlock joint (pastern) angles, and
the shape and angulation of the hoof, have been associated with performance [7,8], longevity [9–12]
or lameness prevalence [13,14] across different breeds and disciplines. Many conformation traits

Genes 2019, 10, 370; doi:10.3390/genes10050370                                        www.mdpi.com/journal/genes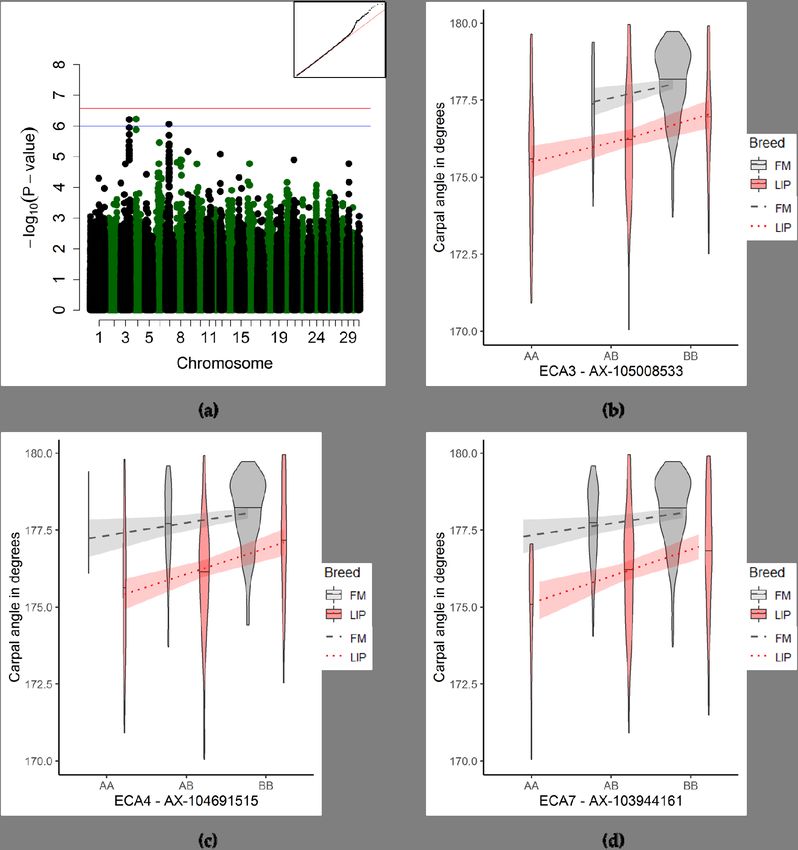
Genes 2019, 10, 370                                                                                          2 of 17

are routinely evaluated during breeding evaluation contests (mare performance tests, field tests,
station tests for breeding stallions, etc.) and have been used in breeding value estimation [15–19]
and/or genomic analyses, such as genome-wide association studies (GWASs) [20,21]. The heritability
(h2 ) for conformation traits mostly ranges between 0.10 and 0.50 [19]. The highest heritability is
usually attributed to the height at the withers, and was reported to range from 0.27 [22] to 0.89 [23,24].
Coincidentally, the height at the withers is one of the few routinely measured objective traits in breeding
evaluations, while most other traits are either judged based on the breeding optimum, or assessed on a
linear scale within each breed [19].
      Despite conformation traits being widely applied to select breeding individuals and being
moderately heritable, the underlying gene variants affecting the morphology of horses are not well
known. Several genome-wide association studies have identified quantitative trait loci (QTL) and gene
candidates associated with the height at the withers in Franches-Montagnes (FM) horses [20], Quarter
Horses [25] and Tennessee Walking Horses [26]. However, within the same studies, other conformation
traits, such as the traits describing the distal limb, have not shown any significant association to other
regions within the equine genome. In the Franches-Montagnes breed, two different GWASs using the
same 1077 individuals and phenotypes, once with the 50K single nucleotide polymorphism (SNP)
panel [20] and once with sequence derived genotypes [21], could only confirm the QTL (especially
for the height at the withers) from the first study. No new loci were significantly associated with
the other conformation traits included in both studies, although several, such as neck muscling,
were suggestively associated (p < 10−6 ) [21]. This strongly suggests that increased SNP densities are
not sufficient to study the genetic variants of the available conformation traits derived from linear
description. The data derived from linear description does not seem to account for the complexity of
the conformational phenotypes [21]. In practice the linear scale is often not fully used and skewed
towards the perceived optimum [15,17]. In some cases, there is little agreement on the optimum
between judges [27]. Several conformation traits measured on photographs of the horse, such as the
shoulder joint angle or hip joint angle, have shown no relation to the linearly described equivalents of
shoulder incline or croup incline [28]. In addition, linear scales are specific to each breeding population,
either in their biological range or in the applied scale (1 to 40, 1 to 10, a to i, etc.) [19], and therefore, it is
difficult to compare the conformation of different breeds, and restricts the opportunity to increase the
sample size for genetic studies.
      Recently, a new phenotyping method has been proposed for assessing equine conformation
based on photographs. The horse shape space model extracts the shape data from standardized
photographs of horses using geometric morphometrics [29]. It consists of a total of 246 landmarks
and semi-landmarks tracing the outline of the horse, as well as the specific landmarks of the distal
limb. These outlines are normalized using a generalized Procrustes analysis, and the main variation in
shape is explained by extracting the relative warp scores (the principal components of the partial warp
matrix). Unfavorably for genetic studies, the relative warp scores are dependent on the sample, and
are therefore not stable measures. It is, however, also possible to analyze the angular measurements
directly from the horse shape space model [28]. Because angles do not depend on size, there is no bias
due to the sampling method, as the data does not need to be normalized before extracting the angle
measurements. In a previous study, the majority of angular measurements were highly reproducible
and consistent within the same animal over different photographs, except for the angles of the shoulder
and elbow [28]. The effect of the posture on the joint angles was reduced by creating a classification
system of photographs, and correcting the joint angles for relevant posture variables in different
statistical models [28].
      The aims of the study were to compare the morphometric angular measurements of two horse
breeds, FM and Lipizzan (LIP), by applying the horse shape space model on photographs, and using
the shape-derived joint angles in a GWAS to identify the QTL associated with conformation traits
in horses.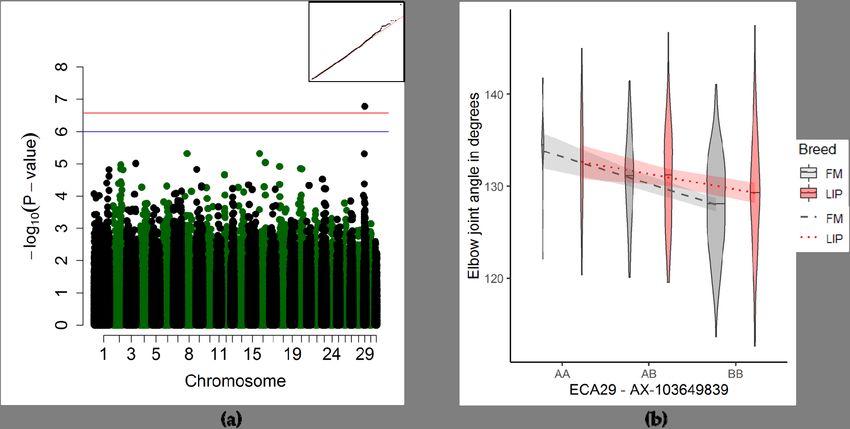
Genes 2019, 10, 370 3 of 17
2. Materials and Methods
2.1. Animals
In total, 524 horses were included in this study—300 FM and 224 LIP horses. The 300
Franches-Montagnes horses were all stallions, which were presented at the station test at the Swiss
National Stud Farm (SNSF). The stallions were born between 1975 and 2015 (median of 2003), and
photographs from the stallion catalogues were preserved in an electronic archive at the SNSF. The
DNA samples were routinely isolated from blood samples or sperm doses under permit VD2227.2,
building a bio archive curated by the University of Bern and the SNSF of the breeding horse population
in Switzerland. The genomic DNA was isolated from the EDTA blood samples using the Maxwell RSC
Whole Blood DNA Kit and the Maxwell RSC Instrument (Promega). The Lipizzan sample regrouped
photographs and DNA from 224 breeding animals (125 stallions and 99 mares, born between 1987 and
2013; median of 2005) were collected in the studs of Piber (Austria), Đakovo (Croatia), Topol’čianky
(Slovakia), and Szilvasvárad (Hungary), during the years 2014 to 2017, following national rules
and regulations.
2.2. Phenotyping
2.2.1. Photograph Selection
Each horse was phenotyped based on one unique photograph. The horses were placed in an
open posture, as described in the literature [28,29]. Because of the expected variations in the posture,
given the difficulties in measuring live animals, the posture of each horse was classified based on the
following criteria: head height, head position in relation to the camera, front limb position, hind limb
position, body alignment to the camera, and tail carriage, as described in the literature [28]. The year
of birth of the horse and the age of the horse in the photograph (if available) was also recorded. The
year of birth was divided into four categories (before 1990, 1990 to 1999, 2000 to 2009, and 2010 and
younger). This was necessary, particularly for the FM sample, as the photographs were derived from
the electronic archive at SNSF, where the individual and its birth year were known, while the date of
the photograph was not always available. The age of the horse was also divided into five categories
(three to four, five to eight, nine to sixteen, over sixteen years old, and unknown).
2.2.2. Horse Shape Data
We extracted the shape data of the horses from the photographs using the horse shape space,
which is composed of the outline of a horse and 31 additional somatometric landmarks [29]. The
semi-landmarks from the curves were placed at equal distances within each curve, and were transformed
to landmarks using the computer programmes tpsDig2 and tpsUtil [30,31]. Out of the full shape
(246 landmarks, i.e., 31 somatometric and 215 semi-landmarks), we calculated the angles for the
available joints, namely: the poll, neck–shoulder blade, shoulder joint, elbow joint, carpal joint, fetlock
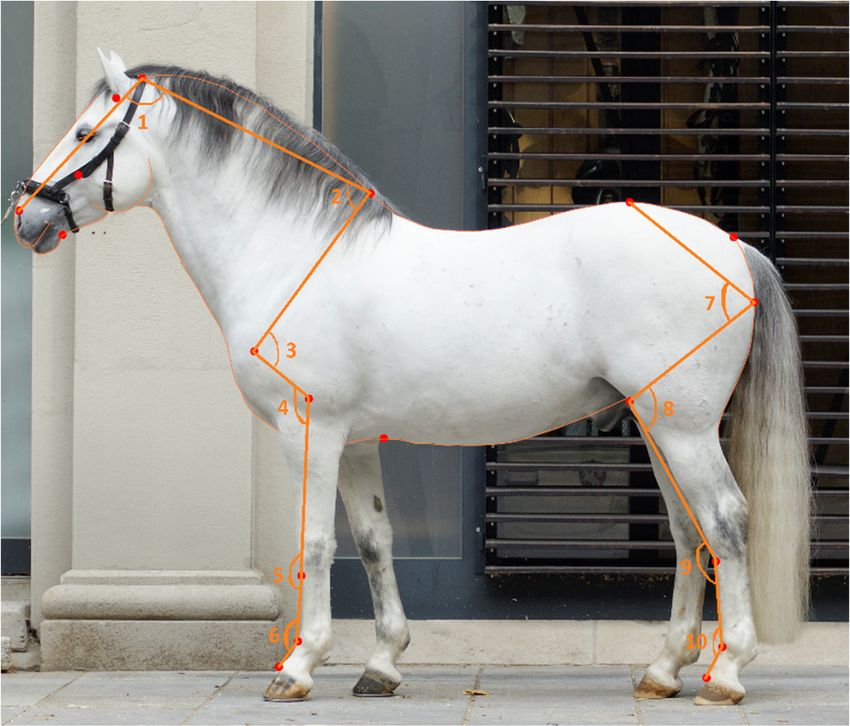
joint of the forelimb, hip joint, stifle joint, hock, and fetlock joint of the hind limb angles (Figure 1) [28].
The joint angles are independent from the size and orientation of the horses, and were extracted from
the raw coordinates using basic trigonometry, as described in the literature [28].
2.2.3. Phenotype Concordance
The Franches-Montagnes horses were digitized thrice by the first digitizer (author A.I.G.), and
the coordinates were averaged to yield one set of shape data per horse. The Lipizzan horses were
digitized once by the second digitizer (author T.D.). To qualify the differences in the shape data that
are due to digitizer reproducibility, 20 LIP horses were randomly selected and digitized by A.I.G. The
reproducibility of the angular measurements of these horses between T.D. and A.I.G. was calculated
with an intraclass correlation coefficient (ICC) in R [32], to decide whether the datasets could be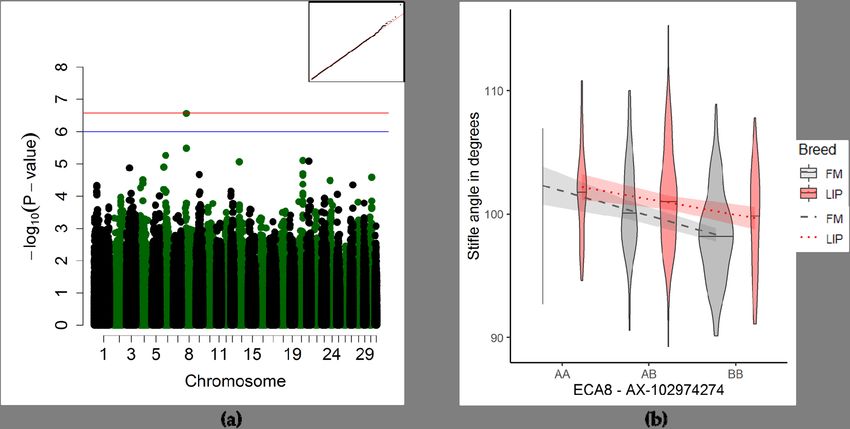
Genes 2019, 10, 370                                                                                                           4 of 17

analysed together. We also used the ICC to select the angles with a fair reproducibility (ICC >0.40) [33],
whereas   the traits with a lower reproducibility were not considered for further analyses.
Genes 2019, 10, 370                                                                               4 of 18

      Figure 1.1. Horse
                  Horse shape space model of a Lipizzan horse photograph, including the following joint
      angles: (1) poll, (2) neck–shoulder blade, (3) shoulder
                                                           shoulder joint,
                                                                      joint, (4)
                                                                             (4) elbow
                                                                                  elbow joint,
                                                                                         joint, (5)
                                                                                                 (5)carpal
                                                                                                      carpaljoint,
                                                                                                              joint,(6)
                                                                                                                     6) fetlock
      joint of the forelimb, (7) hip joint, (8)
                                            (8) stifle
                                                stifle joint,
                                                        joint, (9)
                                                               (9) hock
                                                                   hock joint,
                                                                         joint, and
                                                                                 and (10)
                                                                                      (10) fetlock
                                                                                            fetlock joint
                                                                                                     joint of
                                                                                                           of the
                                                                                                               the hind
                                                                                                                   hind limb.
                                                                                                                         limb.

2.2.4. Quality Control
2.2.3. Phenotype       of the Phenotype
                 concordance
     To
     Theaccount  for any residual
          Franches-Montagnes       errors
                                 horses    anddigitized
                                         were   extreme thrice
                                                        positions  in the
                                                               by the  firstdigitizing process,A.I.G.),
                                                                             digitizer (author  we filtered
                                                                                                        and
the whole  shape  dataset by removing    the individuals for which  the  Procrustes  distance  of
the coordinates were averaged to yield one set of shape data per horse. The Lipizzan horses were  the shape
ranged  above
digitized oncethe
               by upper   quartile
                   the second      of the(author
                              digitizer   mean. T.D.). To qualify the differences in the shape data that
are due to digitizer reproducibility, 20 LIP horses were randomly selected and digitized by A.I.G.
2.3. Genetic Analyses
The reproducibility of the angular measurements of these horses between T.D. and A.I.G. was
calculated
2.3.1.        with an intraclass
        Franches-Montagnes          correlation coefficient (ICC) in R [32], to decide whether the datasets
                                 Horses
could be analysed together. We also used the ICC to select the angles with a fair reproducibility (ICC
>0.40)The  genetic
        [33], whereasdata
                        theoftraits
                               the with
                                    Franches-Montagnes       horseswere
                                          a lower reproducibility    originated   from three
                                                                          not considered   for different  sources,
                                                                                               further analyses.
namely, previously described imputed 50K SNP data (135 stallions) [34], whole genome sequence
data
2.2.4. (12 stallions)
       Quality  control[34,35],   and 670K high density (HD) SNP data (137 stallions), performed by
                         of the phenotype
GeneSeek/Neogen on the Affymetrix equine 670K SNP array containing 670,796 evenly distributed
      To account
genome-wide         for any After
                 markers.     residual
                                     theerrors  and extreme
                                         phenotypic           positions
                                                      filtering, 284 out in
                                                                          of the
                                                                             300 digitizing
                                                                                 genotypedprocess,    we filtered
                                                                                              FM stallions   were
the  whole   shape  dataset
used in the genetic analysis. by  removing    the individuals  for which   the Procrustes  distance  of the shape
ranged above the upper quartile of the mean.
2.3.2. Lipizzan Horses
2.3. Genetic analyses
      The genotyping of all of the Lipizzan horses was performed by GeneSeek/Neogen on the Affymetrix
equine   670K SNP array. After
2.3.1. Franches-Montagnes           the phenotypic filtering, 211 (93 mares and 118 stallions) out of the 224
                                 horses
genotyped LIP horses were used in the genetic analysis.
      The genetic data of the Franches-Montagnes horses originated from three different sources,
namely,
2.3.3.     previously
        Merging         described
                  the Genetic   Dataimputed     50K SNP data (135and
                                       Sets (Franches-Montagnes       stallions)
                                                                         Lipizzan[34], whole genome sequence
                                                                                    Horses)
data (12 stallions) [34,35], and 670K high density (HD) SNP data (137 stallions), performed by
      We used PLINK v1.07 software [36,37] to combine the data from the different genotyping sources
GeneSeek/Neogen on the Affymetrix equine 670K SNP array containing 670,796 evenly distributed
in the FM and LIP horses (sequence, 50K imputed to sequence, Affymetrix 670K) by extracting the SNPs
genome-wide markers. After the phenotypic filtering, 284 out of 300 genotyped FM stallions were
that were common to all of the datasets (n = 514,134 SNPs). We included only the SNPs positioned on
used in the genetic analysis.
the autosomes (n = 492,072 SNPs). Furthermore, we removed SNPs with minor allele frequencies (MAF)
below 5%, a SNP genotyping rate below 90%, and using the Hardy–Weinberg equilibrium (HWE) with
2.3.2. Lipizzan horses
     The genotyping of all of the Lipizzan horses was performed by GeneSeek/Neogen on the
Affymetrix equine 670K SNP array. After the phenotypic filtering, 211 (93 mares and 118 stallions)
out of the 224 genotyped LIP horses were used in the genetic analysis.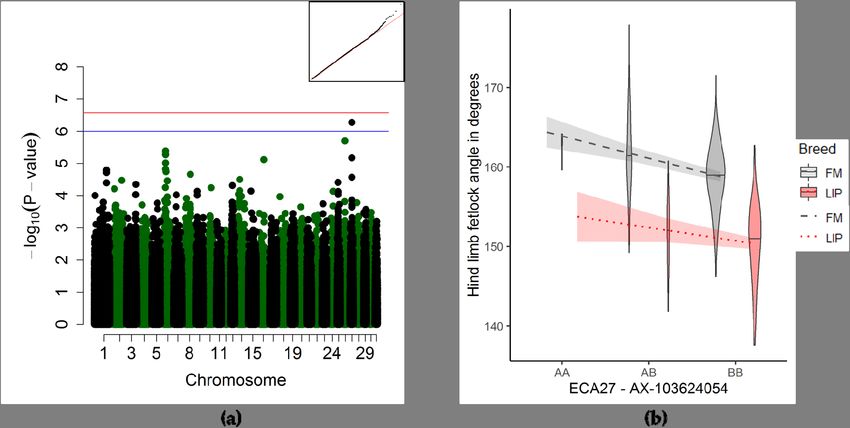
Genes 2019, 10, 370                                                                                 5 of 17

p < 0.0001 [20], resulting in 374,070 SNPs for the final analysis. To investigate the population structure
of the two breeds, we calculated an identical by state (IBS) derived relationship matrix using PLINK
v1.07 software [36,37], followed by a principal component analysis (PCA).

2.4. Genome-Wide Association Studies
     Genome-wide association studies were performed on the angle of the poll, elbow joint, carpal
joint, fetlock joint of the forelimb, hip joint, stifle joint, hock joint, and fetlock joint of the hind
limb using a mixed model approach in the R-package GenABEL [38]. We used a polygenic model
approach (polygenic_hglm) implemented in GenABEL to account for the population stratification in our
sample [39,40]. We first estimated a full model with the birth year (to account for the particularities of
the FM sample), the stud farm (to account for the breed and the provenance of each LIP sample, as all
FM samples originated from one stud farm), the age category, the sex, and all of the posture variables
(head height, head in relation to the camera, position of front limb, hind limb, body alignment to the
camera, and tail position) as fixed effects. Using the summary function, we identified which fixed effects
had a significant effect on the GWAS (i.e., a p-value < 0.05). We then excluded the non-significant fixed
effects for the final polygenic model, calculated using polygenic_hgml, and extracted the significance
of each SNP using mmscore [41]. We visualised the results using Manhattan plots and considered a
p-value of 10-6 as the threshold for suggestive associations (blue line), as used in the literature [21].
We determined the significance threshold for the effective number of independent loci by pruning
the 374,070 SNPs included in the GWAS for linkage disequilibrium (LD) [42], using a 50-kb sliding
window size, a 5-kb window step size, and an r2 exclusion threshold of 0.5. After the LD pruning,
the p-value of 0.05 was divided by 187,925 independent SNPs (pInd < 2.66 × 10⁻⁷ ; red line). We also
examined the quantile–quantile (Q–Q)-plots for the inflation of small p-values, hinting at false positive
association signals. Finally, we estimated the genome-wide h2 of each angle using GCTA [43].

2.5. Functional Annotation
     We investigated which genes are located near each significant/suggestive QTL by using the NCBI
Genome Data Viewer [44], based on the EquCab 2.0 reference genome assembly and Annotation
Release 102. The positions of the QTL and the candidate genes within the text refer to the EquCab
2.0 reference genome assembly. The correspondence to the EquCab 3.0 coordinates is also shown in
the results section. We evaluated the genes situated approximately 200 kb up- and down-stream of
the significant or suggestive QTL(listed in Table S1). We report that the QTL close to the genes have
a biological function in the morphology, development, bone metabolism, and bone related disease
incidence in human or other animal models, including horses.

3. Results

3.1. Phenotypic Analyses
      The mean, standard deviations, and genome-wide heritability of the angular measurements are
presented in Table 1. The heritability ranged between 0.22 and 0.58. We used an intraclass correlation
coefficient calculating the intra-specimen variance against the inter-specimen variance to estimate the
reproducibility between the two digitisers on a subset of 20 LIP horses. Half of the joint angles (poll,
stifle joint, hock joint, and fetlock joint both in the fore and hind limb) showed a good to excellent
reproducibility (>0.60, Table 1) [33]. Out of 10 angles, only two (neck–shoulder blade and shoulder
joint) did not meet the cut-off value for inclusion in GWAS fixed at an ICC >0.40. Consequently, the
neck–shoulder blade and shoulder joint angles were excluded from the subsequent GWAS, while
the remaining eight angles were considered reproducible between the two digitisers, and therefore
comparable between the two breeds.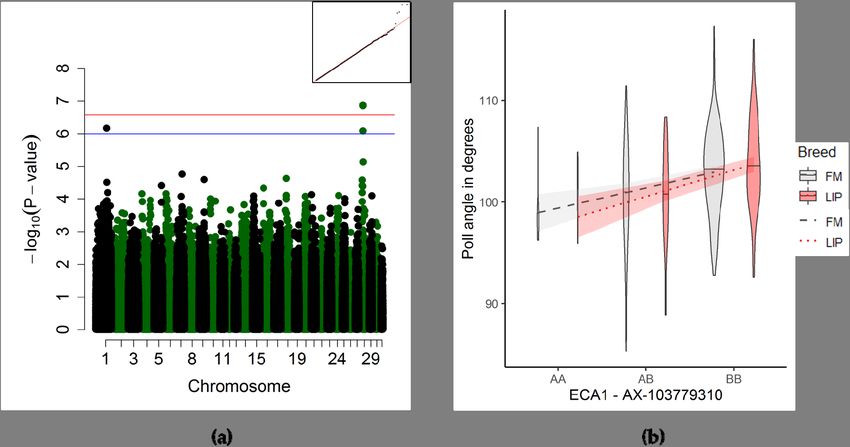
Genes 2019, 10, 370                                                                                         6 of 17

      Table 1. Mean, standard deviation (SD), minimum, maximum, genome-wide heritability, and standard
      error (SE) for 495 horses, and the reproducibility (ICC) of the joint angle measurements of 20 Lipizzan
      horses (LIP).

                Joint Angle               Mean       SD      Min      Max       h2      SE      ICC (20 LIP)
                     Poll                 102.55     4.70   85.35    117.29    0.38    0.098        0.92
           Neck–shoulder blade             81.86     6.56   62.77    99.47     0.42    0.086        0.16
               Shoulder joint              94.00     6.61   77.09    114.94    0.42    0.090        0.13
                 Elbow joint              129.50     5.79   112.60   147.50    0.22    0.076        0.52
                Carpal joint              177.30     1.81   170.00   179.90    0.35    0.088        0.49
        Fetlock joint of the forelimb     149.10     4.08   136.80   162.00    0.32    0.089        0.79
                  Hip joint                78.22     3.01   68.80    91.17     0.24    0.092        0.58
                 Stifle joint              99.76     4.08   89.28    115.26    0.40    0.089        0.90
                    Hock                  152.90     2.30   145.00   159.50    0.25    0.095        0.96
       Fetlock joint of the hind limb     155.80     6.43   137.60   177.90    0.58    0.086        0.81

     The visualization of the mean of the 20 LIP horses phenotyped by A.I.G. and T.D. (Figure S1)
highlights the difference in the placement of the point of shoulder and the fetlock landmarks. This had
an effect on the reproducibility of the joint angle measurements, especially on the neck–shoulder blade
and shoulder joint angles, and a lesser effect on the elbow and carpal joint angles.

3.2. Population Structure
     The population structure of the two horse breeds was ascertained with a PCA scatter plot
(Figure S2). The first principal component (PC1), accounting for 56% of the variance, clearly separates
the horses into two distinct population clusters (FM and LIP), while the second principal component
(PC2), accounting for 4% of the variance, further differentiates the LIP horses according to the
sample origin.

3.3. Genome-Wide Association Studies for Joint Angle Measurements
     The summary function of the full polygenic_hgml model containing all of the covariates (posture,
age, sex, and stud farm) revealed significant (p < 0.05) effects of covariates specific to each angle
(Table 2, model summaries in File S1 for a detailed description). Thereafter, we conducted GWAS on
eight joint angle measurements (poll, elbow joint, carpal joint, hip joint, stifle joint, hock joint, and
fetlock joints of the fore and of the hind limb), and accounted for their respective significant covariates.
Using mmscore, we found significant or highly suggestive associations for the angles of the carpal
joint, the elbow joint, the poll, the stifle joint and the fetlock joint of the hind limb with visible effect
sizes, which are described hereafter (summary statistics in Table 3). All of the other GWAS results are
presented in Table S2.

3.3.1. Poll Angle Associations
     The poll angle was significantly associated with one QTL on ECA28, 113 kb downstream of the
LRRIQ1 gene and 50 kb downstream of the ALX1 gene (Figure 2a and Table 3). Additionally, this angle
was suggestively associated with another QTL on ECA1, 95 kb downstream of the gene CORO2B, and
162 resp. 182 kb upstream of the genes ITGA11 and FEM1B (Table S1). For the QTL on ECA1, the
horses homozygous for the reference allele had a smaller poll angle than the alternate allele (Figure 2b),
while the trend was reversed for the QTL on ECA28 (Figure 2c).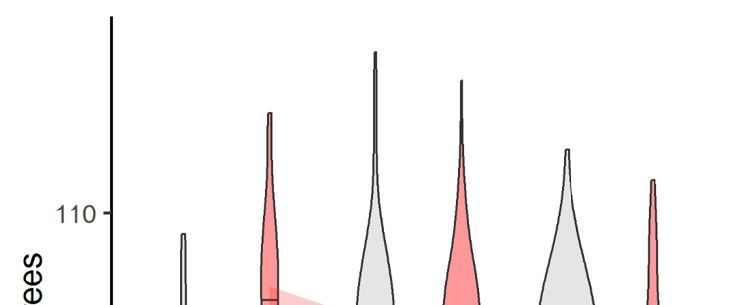
Genes 2019, 10, 370                                                                                                                                                                                  7 of 17

                                                  Table 2. Summary table of the significance of the covariates in the full polygenic model.

                                                                                                     Head in                                                Body
                                               Stud      Birth Year       Age                                          Position of       Position of
                      Joint Angle                                                       Sex         Relation to                                         Alignment to          Tail Position
                                               Farm      Category       Category                                       Front Limb        Hind Limb
                                                                                                     Camera                                              the Camera
                        Poll                                                **            *              **                                                    *                    **
                    Elbow joint                                                                                             ***                                **
                   Carpal joint                                                          ***
           Fetlock joint of the forelimb                                                  **                                                   *
                     Hip joint                               **                           *                                                  ***              ***
                    Stifle joint                                            ***                           *                                  ***              ***
                       Hock                                                                                                                  ***
          Fetlock joint of the hind limb         *                                                                          ***               **
                                                                      *= p-value < 0.05, ** = p-value < 0.01, ***=p-value < 0.001.

      Table 3. Best associations by trait (only markers with p < 10−6 are reported) for the genome-wide association studies of Franches-Montagnes (FM) and Lipizzan (LIP)
      joint angle measurements.

                                        Position on               Position on                      SNP with the                         Number of                   Allele Frequency
         Joint Angle        ECA                                                        #SNP                             p-Value
                                        EquCab2.0                 EquCab 3.0                      Lowest p-Value                     Genotyped Horses   AAFM,LIP       ABFM,LIP        BBFM,LIP
                             28     12,101,898–12,106,363   13,129,017–13,133,483        3         AX-103978374       1.36 × 10−07         495           4911,38        19797,100      249176,73
             Poll
                              1          124,405,158             125,551,151             1         AX-103779310       6.83 × 10−07         495            138,5         13370,63       349206,143
         Elbow joint         29          18,799,958               19,878,299             1         AX-103649839       1.69 × 10−07         490           3712,25        15469,85       299198,101
          Stifle joint        8          19,266,146               21,704,931             1         AX-102974274       2.77 × 10−07         473           454,41         18680,106      242178,64
       Fetlock joint of      27          22,021,462              22,068,848              1         AX-103624054       5.42 × 10−07         495            53,2          10270,32       388211,177
        the hind limb
                              4            37,412,203             37,460,405             1         AX-104691515       6.07 × 10−07         479           463,43         16054,106        273211,62
         Carpal joint         3            106,128,177            107,955,102            1         AX-105008533       6.24 × 10−07         493           390,39         14328,115        311254,57
                              7             42,659,817             43,694,770            1         AX-103944161       8.83 × 10−07         495           222,20         18675,111        287207,80
      #SNP—the number of single nucleotide polymorphisms for a specific trait that passed the suggestive p-value threshold of 10-6 . p-value—p-value of the SNP with the lowest p-value per
      trait and locus corrected for genomic inflation (Pc1df from GenABEL).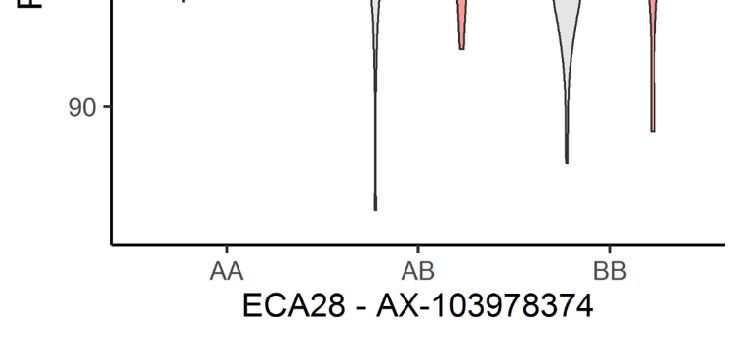
3.3.1. Poll angle associations
                 The poll angle was significantly associated with one QTL on ECA28, 113 kb downstream of the
           LRRIQ1 gene and 50 kb downstream of the ALX1 gene (Figure 2a and Table 3). Additionally, this
           angle was suggestively associated with another QTL on ECA1, 95 kb downstream of the gene
           CORO2B, and 162 resp. 182 kb upstream of the genes ITGA11 and FEM1B (Table S1). For the QTL on
Genes 2019, 10, 370                                                                                                                8 of 17
           ECA1, the horses homozygous for the reference allele had a smaller poll angle than the alternate allele
           (Figure 2b), while the trend was reversed for the QTL on ECA28 (Figure 2c).

      Figure 2. Genome-wide association study (GWAS) for the poll angle (n = 495). (a) Manhattan
                Figure 2. Genome-wide association study (GWAS) for the poll angle (n = 495). (a) Manhattan plot
      plot (blue   line)
                (blue line)representing
                            representing thethe    suggestive
                                              suggestive           significance
                                                           significance            threshold
                                                                        threshold (p             (red
number of animals.
3.3.2. Elbow joint angle association
The significant quantitative trait locus for the elbow joint angle (Table 3 and Figure 3a) was
surrounded by three genes, namely: RSU1 (49 kb upstream of the QTL), PTER (75 kb downstream of
the QTL), and C1QL3 (16 kb downstream of the QTL) (Table S1). Horses homozygous for the alternate
Genes 2019, 10, 370 9 of 17
allele presented with a smaller elbow joint angle than horses homozygous for the reference allele
(Figure 3b).
Figure 3. Genome-wide association
Figure 3. Genome-wide study
association study(GWAS)
(GWAS) forforthethe elbow
elbow joint(nangle
joint angle (a)=
= 495).(n 495). (a) Manhattan
Manhattan
plot and (inset)
plot and Q–Q-plot Q–Q-plotwith
(inset) with
the the line
blue blue representing
line representingthe
the suggestive
suggestive significance threshold
significance (p <
threshold (p < 10−6 )
10−6) and the red line representing the significance threshold (pIndangle.
3.3.4. Fetlock joint angle of the hind limb association
The fetlock joint angle of the hind limb was suggestively associated with a QTL on ECA27
(Figure 5a and Table 3). The quantitative trait locus mapped to no known gene—the nearest genes
were mapped over 500 kb up- or down-stream of the QTL. Horses homozygous for the reference
Genes 2019, 10, 370 10 of 17
allele (only two FM and three LIP horses) had a larger fetlock angle than the horses with at least one
alternate allele (Figure 5b).
Genes 2019, 10, 370 12 of 18
3.3.5. Carpal joint angle associations
The carpal
Figure 5. Genome-wide
Figure angle
5. Genome-wide showed
association three
study
association suggestive
study (GWAS)genome-wide
(GWAS) forthethe
for associations
fetlock
fetlock joint joint of
angle angle(Figure
the 6a hind
of limb
hind the and
(n Table
= 495). (n = 495).
limb 3).
The (a)
(a) Manhattanbest-associated
Manhattan
plot and plotQTL on the(inset)
and Q–Q-plot
Q–Q-plot ECA4 was
(blue281
(inset)(blue kbrepresenting
line)
line) downstream
representing the of thesuggestive
CALCR
suggestive
the genesignificance
significance(Table S1). The
threshold threshold
second-best
(p < 10−6) QTL for line)
and (red the carpal angle was
the significance located(p329–370
threshold IndGenes 2019, 10, 370 11 of 17
4. Discussion
4.1. Phenotypes
The phenotype concordance was sufficiently high to pool the phenotypes digitised by two different
persons together. There were only two angles that had to be excluded because of a low reproducibility.
These angles had already shown problematic reproducibility and consistency in a previous study
because of the placement of the point of the shoulder [28]. We saw slight differences in the placement
of the landmarks not only at the point of the shoulder, but also at the fetlock, which had an impact on
the reproducibility between the two digitisers. This may also have an effect on the overall differences
between the two breeds, as different people digitised the two breeds. Other angles with a lower
reproducibility can be explained by a lower variance within the trait, as the ICC is a measure of intra-
versus inter-individual variance. This is the case for a lower ICC in the carpal angle, ranging between
170.00 and 179.90 degrees. Joint angles with a high variance and high reproducibility are more reliable,
for example, the poll (85.35 to 117.29 degrees; ICC = 0.92) or the fetlock joint angle of the hind limb
(137.60 to 177.90 degrees; ICC = 0.81).
The genome-wide heritability of the different joint angle measurements ranged between 0.22 and
0.58. The heritability was in the same range as most of the conformation traits described on a linear
scale. The sample size of this study, however, was smaller than those that previously reported h2 for
the conformation traits [19]. More horses should be pheno- and geno-typed to reassess the h2 of the
measures we proposed here.
Because the size and the complexity of the sample, consisting of two unrelated breeds, we elected
to do a preselection of photographs and filtered out extreme shapes using the mean Procrustes distance
as a reference. We opted to systematically and neutrally filter out the most disruptive elements, but
keep as many animals as possible in the analysis. For this study, we carefully evaluated each GWAS
model to include the covariants with the most significant outcome on the GWAS. This has allowed us to
correct for external non-genetic effects, while maintaining a higher sample size of horses. The posture
of the horse in the photograph had a strong effect on the angle measures, as previously shown [28].
4.2. Genome-Wide Association Studies
4.2.1. Identification and Interpretation of Relevant Quantitative Trait Loci
We used joint angle measurements for two independent breeds to maximise the sample size
within our GWAS. To avoid breed specific bias, we corrected for relatedness by using a kinship matrix
in our GWAS models, and included the stud farm as a fixed environmental effect wherever the model
summary suggested a significant association of the stud farm on the outcome (only for the fetlock angle
of the hind limb). We carefully analysed the effect of the genotype on the phenotype for each breed, so
as to avoid reporting associations that result only from differences between the breeds. For all of our
reported associations, the trend lines were unidirectional and affected both breeds in a similar manner.
4.2.2. Poll Angle
For the poll angle, the significant QTL on ECA28 was situated within a long stretch of DNA behind
the actual gene void of any other gene (i.e., a “gene desert”). It was however 50 kb downstream of the
ALX1 gene, a homeobox gene critical to the development of the heads and spines in mammals [45].
Mutations in this gene have been reported to cause cleft palate and/or lip (CL/P) in humans [46,47]. A
phenotype closely related to the poll angle we studied here, a specific occipitoatlantoaxial malformation,
was found, in one case study of an Arabian horse, to be likely caused by a deletion near the HOXD3 gene,
another homeobox gene. The diseased horse presented with, among other symptoms, an abnormal head
position, extended neck posture (i.e., large poll angle), and visible abnormalities in the cervical spine.
Two other individuals presented with similar phenotypes, but did not have this particular likely causal
deletion in their genotype. The abnormal head position and extended neck seem to reflect an extremeGenes 2019, 10, 370 12 of 17
case of the phenotypic variation shown in our horse sample. In our study, two loci were associated
with this angle, and there may be more QTL with similar effects having an influence on head–neck
morphology, as was also suggested in the literature [48] for occipitoatlantoaxial malformations.
In the domestic horse, several studies have reported on runs of homozygosity (ROH) in regions
containing homeobox genes. Runs of homozygosity islands containing the genes HOXB1, HOXB2,
HOXB3, HOXB5, HOXB6, HOXB7, HOXB8, and HOXB13 were identified in the Lipizzan horse
breed [49], and were reported in the Posavje horse, a native breed of Eastern Europe [50]. A recent
study reported a private ROH variant in four Hannoverian horses containing the gene ALX4 [51],
which belongs to the same family as ALX1, and shares most of its functions [45,52]. Genomic changes
in the neural crest cells are thought to be one of the primary drivers of behavioral, physiological, and
morphological changes during the domestication of animals [53]. Among the characteristics changed
under domestication were also changes in the craniofacial morphology (e.g., shorter snouts, smaller
teeth, and larger eyes) [53]. This “neural crest” theory was recently supported by a study using ancient
horse DNA in comparison to current horse breeds, showing an enrichment of genes involved in neural
crest development and morphology in domesticated horses [54]. We could not identify any obvious
candidate genes with known functions in the bone morphology or metabolism near the QTL on ECA1.
4.2.3. Elbow Joint Angle
The significant quantitative trait locus on ECA29 associated with the elbow angle was located
between the RSU1 and PTER genes. The gene RSU1, 49 kb upstream of the QTL, is associated with
body height and bone mineral density in humans. The gene PTER, 75 kb downstream of the QTL, is
also associated with an increased risk of bone fractures and osteoporosis in humans [55]. In horses,
lameness due to elbow injury is rare [56]. However, stress fractures in the humerus (the bone between
the shoulder and elbow point we measured) have been reported to be relatively common in racehorses
coming back into racing after a break in exercise regime [57]. Fractures within the elbow joint can occur
in young horses, and are often caused by fragile growth plates (epiphyseal fractures). Other fractures
of the elbow are less frequent, and are caused by trauma (falls or kicks from another horse) [56,58].
Because of the overall low prevalence of elbow-related lameness and strong environmental effects
(trauma and exercise regime), the link between the QTL we reported here and the elbow angle needs
to be further investigated.
4.2.4. Stifle Joint Angle
For the stifle joint angle, the suggestive QTL on ECA8 showed no association with the genes
involved in the bone morphology or metabolism, except the RASAL1 gene, 142 kb downstream of the
QTL, linked to ossifying fibroma and other benign bone growths in humans [59,60]. All 11 genes within
200 kb up- or down-stream of this QTL were linked to body mass index in humans (Table S1). One gene,
LHX5, 124 kb upstream of the QTL, is also a homeobox gene associated with neural crest differentiation
and forebrain development [61,62]. However, several other genes lie between the identified QTL and
this particular homeobox gene, and the potential effects on the phenotype are unclear.
4.2.5. Fetlock Joint Angle of the Hind Limb
The locus on ECA27 suggestively associated with the fetlock angle of the hind limb was mapped
to another gene desert. The closest genes were at least 500 kb up- or down-stream of the suggestive
QTL. Interestingly, the 827 kb upstream flanking gene was FRG1, involved in muscular development
and associated with fascioscapulohumeral muscular dystrophy 1 in humans [63]. The link between a
gene affecting the structures of the forelimb (scapula and humerus) and the fetlock joint angle of the
hind limb is unclear.Genes 2019, 10, 370 13 of 17
4.2.6. Carpal Joint Angle
Three QTL were suggestively associated with the carpal joint angle. The trait back-at-the-knee,
which is the closest approximation to our small carpal angle, was associated with uni- and bi-lateral
carpal joint arthritis in a study of Norwegian trotters [64], and has shown a very high heritability
(h2 = 0.66) in a study including a total of 3916 Thoroughbred racehorses in the United Kingdom [11].
Therefore, the genetic architecture of this conformation trait appears favourable for uncovering
associated genetic regions. From our results, we also see that there are multiple QTLs having an effect
on this phenotype. The best association affecting the carpal joint angle was detected on ECA4, 281 kb
from the CALCR gene that encodes for the calcitonin receptor. The calcitonin receptor mediates calcium
homeostasis, bone mineral density by osteoclast-mediated bone resorption, and its dysfunction is
associated with osteoporosis [55]. Carpal fractures are relatively common in racehorses and are an
important factor in the decision to retire a horse early [57]. In addition, a higher carpal angle decreases
the odds of a carpal fracture in Thoroughbreds [13]. It is therefore possible that the CALCR gene is
linked to the weakening of the carpal bones in horses with a small carpal angle, increasing the risk
of fractures.
The quantitative trait locus on ECA3 at 105 mb associated with the carpal angle was identified in
several equine studies [20,21]. In these studies, the QTL was linked with the LCORL/NCAPG gene,
which has been associated with height [26,65–67]. In our study, the QTL was associated with the carpal
joint angle. This would confirm the findings from the authors of [20], who found similar associations
with the linearly described trait conformation of legs, which is based, in part, on the visual appraisal of
the carpal angle. The window around the third QTL associated with the carpal angle harbours only
one potential gene affecting the phenotype. The gene NCAPD3 (also named CAPN3), 302 kb upstream
of the QTL has been associated with a short stature, limb hypertonia, and poor overall growth [68,69].
Interestingly, the NCAPD3 gene may have a functional relation to the NCAPG gene, as both genes
encode subunits of non-SMC condensin complexes, which have a role in stabilising the chromosomes
during mitosis and meiosis [70], and seem closely associated to growth.
5. Conclusions
Using joint angle measurements extracted from the horse shape space model as phenotypes in
GWAS, this study identified several new QTL potentially involved in the conformation of horses. Two
quantitative trait loci, one for the poll and one for the fetlock joint of the hind limb, were situated
in gene deserts and surrounded by important developmental genes (ALX1 and FGR1) involved in
musculoskeletal development in mammals. Two quantitative trait loci for the carpal and elbow joint
angles were located near the genes associated with osteoporosis in humans (CALCR and RSU1/PTER,
respectively). Two other quantitative trait loci for the carpal joint angle were near the genes associated
with height (LCORL/NCAPG in horses and NCAPD3 in humans). Future studies with independent
samples should be performed in order to confirm these findings.
Supplementary Materials: The following are available online at http://www.mdpi.com/2073-4425/10/5/370/s1:
Table S1: Summary of genes near the identified QTL and their functions in humans based on the GeneCards
database, Figure S1: Differences in the mean shape of 20 Lipizzan horses digitized by A.I.G. (orange) and T.D. (red)
by superimposition; Figure S2: Population stratification; File S1: Model evaluation for GWAS; Table S2: Summary
table of all GWAS.
Author Contributions: Conceptualisation, M.N. and A.I.G.; data curation, M.N., A.I.G., T.D., and T.L.; formal
analysis, A.I.G.; funding acquisition, A.I.G., M.N., T.L., and R.v.N.; investigation, A.I.G. and M.N.; methodology,
A.I.G., M.N., T.D., and T.L.; project administration, A.I.G., M.N., T.D., and T.L.; resources, R.v.N. and T.L.; software,
M.N.; supervision, M.N. and T.L.; validation, M.N.; visualisation, A.I.G.; writing (original draft), A.I.G.; writing
(review and editing), A.I.G., M.N., T.D., and T.L.
Funding: This study was funded by the Swiss Federal Office for Agriculture (FOAG) under contract number
625000469, and by the Austrian Research Promotion Agency (FFG) under contract number 843464.Genes 2019, 10, 370 14 of 17
Acknowledgments: We thank Gerhard Gmel for helpful comments on the initial manuscript; Sabrina Schenk
Nathalie Besuchet Schmutz, and Eva Andrist for expert technical assistance; and Michael Weishaupt for expert
veterinary advice on the anatomical description of the joint angles.
Conflicts of Interest: The authors declare no conflict of interest. The funders had no role in the design of the
study; in the collection, analyses, or interpretation of data; in the writing of the manuscript; or in the decision to
publish the results.
References
1. Saastamoinen, M.T.; Barrey, E. Genetics of conformation, locomotion and physiological traits. In The Genetics
of the Horse; Bowling, A., Ruvinsky, A., Eds.; CABI: Wallingford, UK, 2000; pp. 439–472.
2. Holmström, M.; Back, W. The effects of conformation. In Equine Locomotion, 2nd ed.; Back, W., Clayton, H.,
Eds.; WB Saunders: London, UK, 2013; pp. 229–243.
3. Thomas, H.S. The Horse Conformation Handbook; Storey Publishing: North Adams, MA, USA, 2005.
4. Reginald Harrison, S.; Goody, P.C. Horse Structure and Movement; J.A. Allen: London, UK, 1993; pp. 152–202.
5. Smythe, R.H. What Makes a Good Horse: Its Structure and Performance, 1st ed.; Country Life LTD: London, UK,
1957.
6. Druml, T.; Dobretsberger, M.; Brem, G. Ratings of equine conformation–new insights provided by shape
analysis using the example of Lipizzan stallions. Arch. Anim. Breed. 2016, 59, 309–317. [CrossRef]
7. Holmström, M.; Magnusson, L.E.; Philipsson, J. Variation in conformation of Swedish Warmblood horses
and conformational characteristics of elite sport horses. Equine Vet. J. 1990, 22, 186–193. [CrossRef] [PubMed]
8. Holmström, M.; Fredricson, I.; Drevemo, S. Variation in angular pattern adaptation from trot in hand to
passage and piaffe in the grand prix dressage horse. Equine Vet. J. 1995, 27, 132–137. [CrossRef]
9. Holmström, M.; Philipsson, J. Relationships between conformation, performance and health in 4-year-old
Swedish warmblood riding horses. Livest. Prod. Sci. 1993, 33, 293–312. [CrossRef]
10. Wallin, L.; Strandberg, E.; Philipsson, J. Phenotypic relationship between test results of Swedish Warmblood
horses as 4-year-olds and longevity. Livest. Prod. Sci. 2001, 68, 97–105. [CrossRef]
11. Love, S.; Wyse, C.; Stirk, A.; Stear, M.; Calver, P.; Voute, L.; Mellor, D. Prevalence, heritability and significance
of musculoskeletal conformational traits in Thoroughbred yearlings. Equine Vet. J. 2006, 38, 597–603.
[CrossRef] [PubMed]
12. Jönsson, L.; Egenvall, A.; Roepstorff, L.; Näsholm, A.; Dalin, G.; Philipsson, J. Associations of health status
and conformation with longevity and lifetime competition performance in young Swedish warmblood riding
horses: 8,238 cases (1983–2005). J. Am. Vet. Med. Assoc. 2014, 244, 1449–1461. [CrossRef]
13. Anderson, T.; McIlwraith, C.; Douay, P. The role of conformation in musculoskeletal problems in the racing
Thoroughbred. Equine Vet. J. 2004, 36, 571–575. [CrossRef] [PubMed]
14. Axelsson, M.; Björnsdottir, S.; Eksell, P.; Häggström, J.; Sigurdsson, H.; Carlsten, J. Risk factors associated
with hindlimb lameness and degenerative joint disease in the distal tarsus of Icelandic horses. Equine Vet. J.
2001, 33, 84–90. [CrossRef] [PubMed]
15. Rustin, M.; Janssens, S.; Buys, N.; Gengler, N. Multi-trait animal model estimation of genetic parameters
for linear type and gait traits in the Belgian warmblood horse. J. Anim. Breed. Genet. 2009, 126, 378–386.
[CrossRef]
16. Viklund, A.; Eriksson, S. Genetic analyses of linear profiling data on 3-year-old Swedish Warmblood horses.
J. Anim. Breed. Genet. 2018, 135, 62–72. [CrossRef]
17. Samoré, A.; Pagnacco, G.; Miglior, F. Genetic parameters and breeding values for linear type traits in the
Haflinger horse. Livest. Prod. Sci. 1997, 52, 105–111. [CrossRef]
18. Hellsten, E.T.; Viklund, Å.; Koenen, E.; Ricard, A.; Bruns, E.; Philipsson, J. Review of genetic parameters
estimated at stallion and young horse performance tests and their correlations with later results in dressage
and show-jumping competition. Livest. Sci. 2006, 103, 1–12. [CrossRef]
19. Duensing, J.; Stock, K.F.; Krieter, J. Implementation and prospects of linear profiling in the warmblood horse.
J. Equine Vet. Sci. 2014, 34, 360–368. [CrossRef]
20. Signer-Hasler, H.; Flury, C.; Haase, B.; Burger, D.; Simianer, H.; Leeb, T.; Rieder, S. A genome-wide association
study reveals loci influencing height and other conformation traits in horses. PLoS ONE 2012, 7, e37282.
[CrossRef]Genes 2019, 10, 370 15 of 17
21. Frischknecht, M.; Signer-Hasler, H.; Leeb, T.; Rieder, S.; Neuditschko, M. Genome-wide association studies
based on sequence-derived genotypes reveal new QTL associated with conformation and performance traits
in the Franches–Montagnes horse breed. Anim. Genet. 2016, 47, 227–229. [CrossRef]
22. Stock, K.F.; Distl, O. Genetic correlations between conformation traits and radiographic findings in the limbs
of German warmblood riding horses. Gen. Sel. Evol. 2006, 38, 657.
23. Schroderus, E.; Ojala, M. Estimates of genetic parameters for conformation measures and scores in finnhorse
and standardbred foals. J. Anim. Breed. Gen. 2010, 127, 395–403. [CrossRef] [PubMed]
24. van Bergen, H.M.; van Arendonk, J.A. Genetic parameters for linear type traits in Shetland Ponies. Livest.
Prod. Sci. 1993, 36, 273–284. [CrossRef]
25. Meira, C.T.; Farah, M.M.; Fortes, M.R.; Moore, S.S.; Pereira, G.L.; Silva, J.A.I.V.; da Mota, M.D.S.; Curi, R.A.
A genome-wide association study for morphometric traits in quarter horse. J. Equine Vet. Sci. 2014, 34,
1028–1031. [CrossRef]
26. Staiger, E.A.; Al Abri, M.; Pflug, K.M.; Kalla, S.; Ainsworth, D.; Miller, D.; Raudsepp, T.; Sutter, N.B.;
Brooks, S.A. Skeletal variation in Tennessee Walking Horses maps to the LCORL/NCAPG gene region.
Physiol. Genomics 2016, 48, 325–335. [CrossRef] [PubMed]
27. Pfammatter, M. Le Système de Description Linéaire au Sein de la Race des Franches-Montagnes. Bachelor’s
Thesis, Haute École des Sciences Agronomiques, Forestières et Alimentaires, Zollikofen, Switzerland, 2017.
28. Gmel, A.I.; Druml, T.; Portele, K.; von Niederhäusern, R.; Neuditschko, M. Repeatability, reproducibility
and consistency of horse shape data and its association with linearly described conformation traits in
Franches-Montagnes stallions. PLoS ONE 2018, 13, e0202931. [CrossRef] [PubMed]
29. Druml, T.; Dobretsberger, M.; Brem, G. The use of novel phenotyping methods for validation of equine
conformation scoring results. Animal 2015, 1–10. [CrossRef]
30. Rohlf, F.J. The Tps Utility Program; 1.68 v.; Departement of Ecology & Evolution, State University of New York
SUNY at Stony Brook: New York, NY, USA, 2016.
31. Rohlf, F.J. The Tps Dig2; 2.26 v.; Departement of Ecology & Evolution, State University of New York SUNY at
Stony Brook: New York, NY, USA, 2016.
32. Wolak, M.E.; Fairbairn, D.J.; Paulsen, Y.R. Guidelines for estimating repeatability. Methods Ecol. Evol. 2012, 3,
129–137. [CrossRef]
33. Cicchetti, D.V. Guidelines, criteria, and rules of thumb for evaluating normed and standardized assessment
instruments in psychology. Psychol. Assess. 1994, 6, 284. [CrossRef]
34. Frischknecht, M.; Neuditschko, M.; Jagannathan, V.; Drögemüller, C.; Tetens, J.; Thaller, G.; Leeb, T.; Rieder, S.
Imputation of sequence level genotypes in the Franches-Montagnes horse breed. Gen. Sel. Evol. 2014, 46, 63.
[CrossRef] [PubMed]
35. Jagannathan, V.; Gerber, V.; Rieder, S.; Tetens, J.; Thaller, G.; Drögemüller, C.; Leeb, T. Comprehensive
characterization of horse genome variation by whole-genome sequencing of 88 horses. Anim. Genet. 2018.
[CrossRef]
36. Purcell, S. PLINK; 1.07, v.; Center for Human Genetic Research (CHGR), Massachusetts General Hospital
(MGH), the Broad Institute of Harvard & MIT: Boston, MA, USA, 2017.
37. Purcell, S.; Neale, B.; Todd-Brown, K.; Thomas, L.; Ferreira, M.A.; Bender, D.; Maller, J.; Sklar, P.; De
Bakker, P.I.; Daly, M.J. PLINK: A tool set for whole-genome association and population-based linkage
analyses. Am. J. Hum. Genet. 2007, 81, 559–575. [CrossRef]
38. Aulchenko, Y.S.; Ripke, S.; Isaacs, A.; Van Duijn, C.M. GenABEL: An R library for genome-wide association
analysis. Bioinformatics 2007, 23, 1294–1296. [CrossRef] [PubMed]
39. Rönnegård, L.; Shen, X.; Alam, M. hglm: A package for fitting hierarchical generalized linear models. R J.
2010, 2, 20–28. [CrossRef]
40. Lee, Y.; Nelder, J.A. Hierarchical generalized linear models. J. R. Stat. Soc. Ser. B 1996, 58, 619–678. [CrossRef]
41. Chen, W.-M.; Abecasis, G.R. Family-based association tests for genomewide association scans. Am. J. Hum.
Genet. 2007, 81, 913–926. [CrossRef] [PubMed]
42. Kanai, M.; Tanaka, T.; Okada, Y. Empirical estimation of genome-wide significance thresholds based on the
1000 Genomes Project data set. J. Hum. Genet. 2016, 61, 861. [CrossRef] [PubMed]
43. Yang, J.; Lee, S.H.; Goddard, M.E.; Visscher, P.M. GCTA: A tool for genome-wide complex trait analysis. Am.
J. Hum. Genet. 2011, 88, 76–82. [CrossRef] [PubMed]Genes 2019, 10, 370 16 of 17
44. Genome Data Viewer. Available online: https://www.ncbi.nlm.nih.gov/genome/gdv/ (accessed on
6 May 2019).
45. Holland, P.W.; Booth, H.A.F.; Bruford, E.A. Classification and nomenclature of all human homeobox genes.
BMC Biol. 2007, 5, 47. [CrossRef]
46. Uz, E.; Alanay, Y.; Aktas, D.; Vargel, I.; Gucer, S.; Tuncbilek, G.; von Eggeling, F.; Yilmaz, E.; Deren, O.;
Posorski, N. Disruption of ALX1 causes extreme microphthalmia and severe facial clefting: Expanding the
spectrum of autosomal-recessive ALX-related frontonasal dysplasia. Am. J. Hum. Genet. 2010, 86, 789–796.
[CrossRef]
47. Funato, N.; Nakamura, M. Identification of shared and unique gene families associated with oral clefts. Int.
J. Oral Sci. 2017, 9, 104. [CrossRef]
48. Bordbari, M.; Penedo, M.; Aleman, M.; Valberg, S.; Mickelson, J.; Finno, C.J. Deletion of 2.7 kb near HOXD 3
in an Arabian horse with occipitoatlantoaxial malformation. Anim. Genet. 2017, 48, 287–294. [CrossRef]
49. Grilz-Seger, G.; Druml, T.; Neuditschko, M.; Dobretsberger, M.; Horna, M.; Brem, G. High-resolution
population structure and runs of homozygosity reveal the genetic architecture of complex traits in the
Lipizzan horse. BMC Genomics 2019, 20, 174. [CrossRef]
50. Grilz-Seger, G.; Mesarič, M.; Cotman, M.; Neuditschko, M.; Druml, T.; Brem, G. Runs of homozygosity
and population history of three horse breeds with small population size. J. Equine Vet. Sci. 2018, 71, 27–34.
[CrossRef]
51. Metzger, J.; Karwath, M.; Tonda, R.; Beltran, S.; Águeda, L.; Gut, M.; Gut, I.G.; Distl, O. Runs of homozygosity
reveal signatures of positive selection for reproduction traits in breed and non-breed horses. BMC Genomics
2015, 16, 764. [CrossRef] [PubMed]
52. Meijlink, F.; Beverdam, A.; Brouwer, A.; Oosterveen, T.C.; Berge, D. Vertebrate aristaless-related genes. Int. J.
Dev. Biol. 2004, 43, 651–663.
53. Wilkins, A.S.; Wrangham, R.W.; Fitch, W.T. The “domestication syndrome” in mammals: A unified
explanation based on neural crest cell behavior and genetics. Genetics 2014, 197, 795–808. [CrossRef]
54. Librado, P.; Gamba, C.; Gaunitz, C.; Der Sarkissian, C.; Pruvost, M.; Albrechtsen, A.; Fages, A.; Khan, N.;
Schubert, M.; Jagannathan, V. Ancient genomic changes associated with domestication of the horse. Science
2017, 356, 442–445. [CrossRef]
55. Niu, T.; Xu, X. Candidate genes for osteoporosis. Am. J. Pharm. 2001, 1, 11–19. [CrossRef]
56. Garvican, E.; Clegg, P. Clinical aspects of the equine shoulder and elbow joints. UK Vet. Companion Anim.
2008, 13, 5–12. [CrossRef]
57. Stover, S.M. Stress fracture diagnosis in racehorses. In Robinson’s Current Therapy in Equine Medicine, 7th ed.;
Sprayberry, K.A., Ed.; Elsevier Inc.: Amsterdam, The Netherlands, 2014.
58. Baccarin, R.Y. Accessing the equine elbow joint: New insights on an old approach. Vet. Rec. 2016, 179,
170–172. [CrossRef]
59. Guérin, M.; Thariat, J.; Ouali, M.; Bouvier, C.; Decouvelaere, A.-V.; Cassagnau, E.; Aubert, S.; Lepreux, S.;
Coindre, J.-M.; Valmary-Degano, S. A new subtype of high-grade mandibular osteosarcoma with
RASAL1/MDM2 amplification. Hum. Pathol. 2016, 50, 70–78. [CrossRef]
60. Tabareau-Delalande, F.; Collin, C.; Gomez-Brouchet, A.; Bouvier, C.; Decouvelaere, A.-V.; De Muret, A.;
Pagès, J.-C.; De Pinieux, G. Chromosome 12 long arm rearrangement covering MDM2 and RASAL1
is associated with aggressive craniofacial juvenile ossifying fibroma and extracranial psammomatoid
fibro-osseous lesions. Mod. Pathol. 2015, 28, 48. [CrossRef]
61. Peng, G.; Westerfield, M. Lhx5 promotes forebrain development and activates transcription of secreted Wnt
antagonists. Development 2006, 133, 3191–3200. [CrossRef]
62. Hunter, C.S.; Rhodes, S.J. LIM-homeodomain genes in mammalian development and human disease. Mol.
Biol. Rep. 2005, 32, 67–77. [CrossRef]
63. Hanel, M.L.; Wuebbles, R.D.; Jones, P.L. Muscular dystrophy candidate gene FRG1 is critical for muscle
development. Dev. Dyn. 2009, 238, 1502–1512. [CrossRef]
64. Dolvik, N.I.; Klemetsdal, G. Arthritis in the carpal joints of Norwegian trotter—heritability, effects of
inbreeding and conformation. Livest. Prod. Sci. 1994, 39, 283–290. [CrossRef]
65. Makvandi-Nejad, S.; Hoffman, G.E.; Allen, J.J.; Chu, E.; Gu, E.; Chandler, A.M.; Loredo, A.I.; Bellone, R.R.;
Mezey, J.G.; Brooks, S.A. Four loci explain 83% of size variation in the horse. PLoS ONE 2012, 7, e39929.
[CrossRef]Genes 2019, 10, 370 17 of 17
66. Boyko, A.R.; Brooks, S.A.; Behan-Braman, A.; Castelhano, M.; Corey, E.; Oliveira, K.C.; Swinburne, J.E.;
Todhunter, R.J.; Zhang, Z.; Ainsworth, D.M. Genomic analysis establishes correlation between growth and
laryngeal neuropathy in Thoroughbreds. BMC Genomics 2014, 15, 259. [CrossRef] [PubMed]
67. Tetens, J.; Widmann, P.; Kühn, C.; Thaller, G. A genome-wide association study indicates LCORL/NCAPG
as a candidate locus for withers height in German Warmblood horses. Anim. Genet. 2013, 44, 467–471.
[CrossRef] [PubMed]
68. Martin, C.-A.; Murray, J.E.; Carroll, P.; Leitch, A.; Mackenzie, K.J.; Halachev, M.; Fetit, A.E.; Keith, C.;
Bicknell, L.S.; Fluteau, A. Mutations in genes encoding condensin complex proteins cause microcephaly
through decatenation failure at mitosis. Genes Dev. 2016, 30, 2158–2172. [CrossRef]
69. Pollitt, C.; Anderson, L.V.; Pogue, R.; Davison, K.; Pyle, A.; Bushby, K. The phenotype of calpainopathy:
Diagnosis based on a multidisciplinary approach. Neuromuscul. Disord. 2001, 11, 287–296. [CrossRef]
70. Wilson, L.O.; Fahrer, A.M. Condensins, chromatin remodeling and gene transcription. In Chromatin
Remodelling; Radzioch, D., Ed.; IntechOpen: London, UK, 2013.
© 2019 by the authors. Licensee MDPI, Basel, Switzerland. This article is an open access
article distributed under the terms and conditions of the Creative Commons Attribution
(CC BY) license (http://creativecommons.org/licenses/by/4.0/).You can also read