Genome Wide Transcriptome Analysis Reveals Complex Regulatory Mechanisms Underlying Phosphate Homeostasis in Soybean Nodules - MDPI
←
→
Page content transcription
If your browser does not render page correctly, please read the page content below
International Journal of
           Molecular Sciences

Article
Genome Wide Transcriptome Analysis Reveals
Complex Regulatory Mechanisms Underlying
Phosphate Homeostasis in Soybean Nodules
Yingbin Xue 1 , Qingli Zhuang 1 , Shengnan Zhu 1 , Bixian Xiao 1 , Cuiyue Liang 1 , Hong Liao 2 and
Jiang Tian 1, *
 1    Root Biology Center, State Key Laboratory for Conservation and Utilization of Subtropical Agro-Bioresources,
      College of Natural Resources and Environment, South China Agricultural University, Guangzhou 510642,
      China; yingbinxue@yeah.net (Y.X.); 15889964001@163.com (Q.Z.); shnzhu@163.com (S.Z.);
      13570450400@163.com (B.X.); liangcy@scau.edu.cn (C.L.)
 2    Root Biology Center, Haixia Institute of Science and Technology, Fujian Agriculture and Forestry University,
      Fuzhou 350000, China; hliao@fafu.edu.cn
 *    Correspondence: jtian@scau.edu.cn; Tel.: +86-208-528-3380

 Received: 14 September 2018; Accepted: 21 September 2018; Published: 26 September 2018

 Abstract: Phosphorus (P) deficiency is a major limitation for legume crop production. Although
 overall adaptations of plant roots to P deficiency have been extensively studied, only fragmentary
 information is available in regard to root nodule responses to P deficiency. In this study, genome wide
 transcriptome analysis was conducted using RNA-seq analysis in soybean nodules grown under
 P-sufficient (500 µM KH2 PO4 ) and P-deficient (25 µM KH2 PO4 ) conditions to investigate molecular
 mechanisms underlying soybean (Glycine max) nodule adaptation to phosphate (Pi) starvation.
 Phosphorus deficiency significantly decreased soybean nodule growth and nitrogenase activity.
 Nodule Pi concentrations declined by 49% in response to P deficiency, but this was well below
 the 87% and 88% decreases observed in shoots and roots, respectively. Nodule transcript profiling
 revealed that a total of 2055 genes exhibited differential expression patterns between Pi sufficient
 and deficient conditions. A set of (differentially expressed genes) DEGs appeared to be involved in
 maintaining Pi homeostasis in soybean nodules, including eight Pi transporters (PTs), eight genes
 coding proteins containing the SYG1/PHO81/XPR1 domain (SPXs), and 16 purple acid phosphatases
 (PAPs). The results suggest that a complex transcriptional regulatory network participates in soybean
 nodule adaption to Pi starvation, most notable a Pi signaling pathway, are involved in maintaining Pi
 homeostasis in nodules.

 Keywords: RNA-seq; nodule; P deficiency; symbiotic nitrogen fixation; soybean

1. Introduction
      Phosphorus (P) is an essential plant macronutrient. As a key component of biomolecules,
such as nucleic acids, proteins, and phospholipids, P is involved in multiple biosynthetic and
metabolic processes throughout plant growth and development [1,2]. Phosphate (Pi), the major form
of phosphorus acquired by plants, is not only unevenly distributed in soils, but is also readily fixed
onto soil particles into unavailable forms (e.g., aluminum-P, iron-P, and calcium-P) [3–5]. Low P
availability significantly decreases crop yields, and, thus, becomes a major constraint on crop growth
and production [6]. At the other end of the spectrum, excessive application of P fertilizer is inadvisable,
due to depletion of limited P rock resources and eutrophication of marine systems by Pi in runoff
that is not utilized by plants [6,7]. Intelligent use of moderate amounts of P fertilizer can be beneficial
if crops are developed for such conditions. To meet these goals of developing smart crop cultivars

Int. J. Mol. Sci. 2018, 19, 2924; doi:10.3390/ijms19102924                            www.mdpi.com/journal/ijms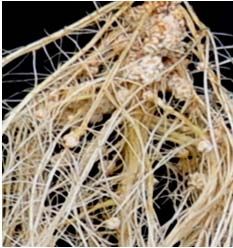
Int. J. Mol. Sci. 2018, 19, 2924                                                                      2 of 23

with high P utilization efficiency requires further understanding of genetic and molecular mechanisms
underlying plant adaptions to P deficiency [8–12].
      To date, a range of morphological, physiological and molecular processes have been associated
with plant in adaptation to P deficiency. These processes include the remodeling of root morphology
and architecture, increased exudation of organic acids and acid phosphatases, enhanced expression of
Pi transporters, and formation of symbiotic interactions with mycorrhizal fungi or rhizobia [13–19].
In recent years, many Pi starvation responsive genes and proteins have been identified and functionally
characterized, which has filled in large gaps in our sketch of plant Pi signaling and regulatory
networks [5,9,11]. In the center of the Pi signaling network lie several important regulators, such as
phosphate starvation response 1 (PHR1) and WRKY transcription factors, proteins containing the
SYG1/PHO81/XPR1 domain (SPX), and the ubiquitin-like modifier E3 ligase [20–25]. Downstream
responses include a set of genes directly involved in morphological and physiological responses
to Pi starvation, such as purple acid phosphatase (PAP) genes functioning in extracellular organic P
remobilization, phosphate transporter (Pht) genes involved in Pi acquisition, and expansin (EXP) genes
that participate in alteration of root morphology and architecture [26–30].
      Among all of the genes, Pht genes are widely characterized in plants, especially in rice (Oryza sativa)
and Arabidopsis thaliana. It has been documented that transcripts of a set of Pht genes were increased by
Pi starvation, such as 4 of 9 Pht genes in Arabidopsis and 4 of 13 in rice [31,32]. Furthermore, AtPht1;1
and AtPht1;4 are suggested to be responsible for about 50% of Pi uptake under Pi starvation conditions
in Arabidopsis [33,34]. Similarly, OsPht1;1, OsPHT1;9 and OsPHT1;10 were found to modulates
phosphate uptake and translocation [35–37]. Recently, several Pht genes have been suggested to
regulate root growth, such as AtPht1;5 for root hair formation and primary root growth in Arabidopsis,
OsPht1;8 for adventitious root elongation and lateral roots number [38,39]. Another critical gene family
in regulating Pi homeostasis, SPX family, has also been well characterized in plants. In Arabidopsis,
transcripts of 3 AtSPX members were enhanced by P deficiency except to AtSPX4 [22]. Similar to
Arabidopsis, 5 OsSPX members were up-regulated by P deficiency except to OsSPX4 [40]. Recently,
a highly conserved mechanism has been suggested that SPX proteins might act as an intracellular Pi
sensor mainly through interactions with PHR1/PHR2 in both rice and Arabidopsis [41–45].
      Additionally, plant phytohormones are suggested to regulate plant responses to Pi starvation,
such as auxin, abscisic acid, ethylene, cytokinin [9,46,47]. Furthermore, cross-regulation also occurs
between Pi and nitrogen (N) starvation in both legume and non-legume plants [48,49]. For example,
a critical regulator for Arabidopsis adaptation to nitrogen availability, N limitation adaptation (NLA)
was suggested to regulate Pi homeostasis by recruiting PHOSPHAT2 (PHO2) to degrade Pht1;4
in Arabidopsis [48]. Furthermore, transcription levels of NLA were found to be regulated by a Pi
starvation responsive miR827 [49], strongly suggesting there is a crosstalk between N and P deficiency.
For legume plants, a crosstalk between N and P deficiency could be directly reflected by significant
decreases of both N2 fixation capability and growth in legume nodules by Pi starvation [28,50,51].
However, one outstanding issue is that a large fraction of our knowledge of Pi signaling networks
has been attained in model plants, such as Arabidopsis thaliana and rice (Oryza sativa). Verification and
application of this knowledge remain fragmentary for most crops, particularly legume crops.
      Soybean (Glycine max L.) is an important legume crop that is a source of high-quality protein and
oil [52]. Similar to other legumes, soybean participates in symbiosis with rhizobia in the formation of
nodules [53]. It has been well documented that rhizobium establishment is a complex process, which is
mainly regulated by phytohormones, such as auxin, cytokinin, ethylene, gibberellic acid, strigolactones,
jasmonic acid, abscisic acid, and salicylic acid [54,55]. For example, it has been suggested that ethylene
negatively regulates rhizobia infection and nodule organogenesis because suppression of both LjEIN2a
and LjEIN2b led to a hypernodulation phenotype in Lotus japonicus [56]. Recently, gibberellic acids
have been suggested to negatively regulate root nodule symbiosis in Lotus japonicus and Medicago
truncatula [57–59]. Furthermore, it has been documented that P availability adversely affects soybean
nodule development and growth [60–62]. In addition, it has been suggested that responses to P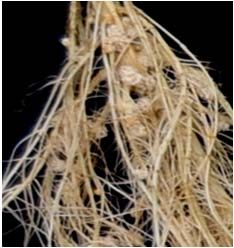
Int. J. Mol. Sci. 2018, 19, 2924                                                                   3 of 23

deficiency are similar between roots and nodules, because of significant increases of proton exudation,
and, thus, decreases of rhizosphere pH were observed in soybean grown in low P conditions [18,63].
However, few studies were conducted to investigate gene expression patterns between nodules and
roots in legume crops. For example, it has been documented that 11 of 14 GmPT members exhibited
Pi-starvation responsive expression patterns in soybean roots [28,29], but information about transcripts
of all GmPT members responsive to Pi-starvation remains largely unknown in soybean nodules.
Recently, increased transcription of GmPT5 has been shown to play a critical role in maintaining Pi
homeostasis in soybean nodules [62]. Plus, a Pi starvation responsive gene, GmEXPB2, plays vital
roles in adaptive responses of both soybean roots and nodules to P deficiency, possibly through cell
wall modifications [26,51]. The results strongly suggest that identification and functional analysis of
Pi starvation responsive gene is critical for elucidating adaptive strategies to low P stress in soybean
nodules. Yet, genome-wide transcriptome analysis has not been conducted to identify Pi starvation
responsive genes in soybean nodules.
      Although genome-wide transcriptome analysis has been successfully used to elucidate molecular
mechanisms underlying complex adaptations of plants to P deficiency using RNA-seq technique,
most of these studies focus on roots or leaves of plants grown under non-symbiotic conditions.
Little transcriptome information is available for legume nodules. As far as the authors are aware,
only three studies have been conducted to investigate global gene expression responses to Pi starvation
in legume nodules, including with bean (Phaseolus vulgaris), Medicago truncatula and chickpea (Cicer
arietinum) [64–66]. However, there is little information about genome-wide analysis of gene transcripts
responsive to Pi starvation in soybean nodule. Furthermore, it is well known that the formation of
symbiotic nodules and their responses to Pi starvation varies considerably among legume species and
rhizobium strains [66,67]. Thus, it is important to investigate molecular mechanisms underlying nodule
development and physiology for each commercially important legume crop under Pi starvation.
      In this study, genome-wide transcriptomic analysis of soybean nodules in response to P deficiency
was conducted via RNA-seq. Thousands of differentially expressed genes were identified in soybean
nodules under P deficiency, with many involved in nutrient/ion transport, transcriptional regulation,
key metabolic pathways, Pi remobilization, and signaling. These results will enable future researchers
to further elucidate molecular processes within nodules adapted to P deficiency, which will ultimately
lead to the development of P-efficient soybean varieties that can maintain symbiotic nitrogen fixation
(SNF) in low or moderate P availability systems.

2. Results

2.1. Growth of Soybean Nodules Is Inhibited by Pi Starvation
     Phosphate starvation significantly affects soybean nodule growth. The results in this study showed
that nodule size, fresh weight, and nitrogenase activity in nodules declined in response to Pi starvation
by 27%, 36%, and 45%, respectively (Figure 1a,b,d,e). However, there was no significant difference
between phosphorus treatments in nodule number (Figure 1c). Consistently, Pi starvation significantly
reduced both P content and total P concentration of seedlings and nodules (Figure 2a,b). Compared to
values in HP plants, the P content and total P concentration of shoots and roots decreased by more
than 70%, whereas, the P content and total P concentration in nodules decreased only by 55% and
49%, respectively, under LP conditions (Figure 2a,b). Accompanying decreases in P content, soluble
Pi concentrations also decreased significantly in response to Pi starvation, with observed soluble Pi
concentrations declining by 88% in leaves, 98% in roots, and 77% in nodules (Figure 2c). In contrasting,
acid phosphatase (APase) activity increased significantly with P deprivation, as reflected by 0.4, 6.9,
and 1.2-fold increases in leaves, roots, and nodules, respectively (Figure 2d). Furthermore, the highest
APase activities were observed in nodules, especially with low P availability, where this activity was
2.3 and 3.7 fold higher than in leaves and roots, respectively (Figure 2d).
146 88% in leaves, 98% in roots and 77% in nodules (Figure 2c). In contrasting, acid phosphatase
147 (APase) activity increased significantly with P deprivation, as reflected by 0.4, 6.9 and 1.2 folds
148 increases in leaves, roots and nodules, respectively (Figure 2d). Furthermore, the highest APase
149 activities were observed in nodules, especially with low P availability, where this activity was
150
Int. J. Mol.2.3
Sci.and 3.719,
2018, fold higher than in leaves and roots, respectively (Figure 2d).
2924 4 of 23
151
152
(a) HP LP
153
154
155
156
157
158
159
160 (b) 1.5 (c) 240
Nodule number
161
Fresh weight
(#/plant)
(g/plant)
162 1 160
*
163
0.5 80
164
165 0 0
HP LP HP LP
166
Nitrogenase activity
167 (d) 12 (e) 120
(mg/nodule FW)
168
Nodule size
(μmol/g/h)
8 80
169
* *
170 4 40
171
0 0
172 HP LP HP LP
173
Figure 1. Effects of phosphorus (P) deficiency on soybean nodule growth. (a) Phenotype of soybean
174 nodulesFigure
at two1. PEffects
levels.of P(b)
deficiency
Soybean on fresh
soybean nodule (c)
weight. growth. (a) Phenotype
Nodule number. of(d) soybean
Nodule nodules
size. (e) Nodule
175 nitrogenase
at two P levels. (b) Soybean fresh weight. (c) Nodule number. (d)
activity. Data in the figure are mean of four replicates with standard errorNodule size. (e) Nodule
bars. Asterisks
176 indicateInt.
nitrogenase activity. Data in the figure is mean of four replicates with standard error bars.
significant difference
J. Mol. Sci. 2018, between
19, x FOR PEER REVIEW HP (500 µM KH2 PO4 ) and LP (25 µM KH2 PO4 ) treatments 5 ofin27
177 Asterisks indicate significant difference between HP and LP treatments in the Student’s t‐test (*:
178 the Student’s t-test (*:
PInt. J. Mol. Sci. 2018, 19, 2924 5 of 23
2.2. Amino-N Compounds in Nodules Produced in Low P and High P Conditions
The amino acid/amide composition in HP or LP treated nodules was analyzed to check for
effects of P availability on N metabolism. A total of 25 amino-N compounds were detected, and P
deficiency significantly affected the concentrations of many, as well as, their relative proportions
in soybean nodules (Table 1). Under P deficient conditions, the concentration of total amino-N
compounds increased by 35% compared to that under P sufficient conditions. Closer inspection
of individual compounds revealed that the P deficiency led to increased concentrations of six amino-N
compounds, namely asparagine, glutamine, arginine, histidine, phosphoethanolamine and isoleucine,
with the largest increase of 8.2-fold observed for phosphoethanolamine (Table 1). On the other side,
the concentration of four amino-N compounds decreased significantly with Pi starvation, including
glutamic acid, aspartic acid, β-Alanine, and cysteine (Table 1). Despite these differences, asparagine
remained the most prevalent amino-N compound in soybean nodules, as reflected by this compound
comprising 69% and 79% of the total amino-N compounds in HP and LP treated nodules, respectively
(Table 1).
Table 1. Amino acid composition in soybean nodules under phosphate (Pi) sufficient (HP, 500 µM
KH2 PO4 ) and deficient (LP, 25 µM KH2 PO4 ) conditions.
HP LP
Log2 (LP/HP)
µg/g FW % µg/g FW %
Asparagine 3225.00 ± 570.99 69.47 5039.99 ± 720.71 79.83 0.64 *
Glutamic acid 619.90 ± 45.82 13.35 285.56 ± 32.07 4.52 −1.12 *
γ-Aminobutyric acid 148.83 ± 9.96 3.21 134.97 ± 23.90 2.14 −0.14
Serine 118.56 ± 9.95 2.55 117.30 ± 0.88 1.86 −0.02
Aspartic acid 107.75 ± 8.35 2.32 68.12 ± 8.58 1.08 −0.66 *
Alanine 62.91 ± 4.19 1.36 53.39 ± 22.40 0.85 −0.24
Tryptophane 51.22 ± 3.52 1.10 42.19 ± 5.36 0.67 −0.28
Glutamine 43.98 ± 53.87 0.95 84.27 ± 33.24 1.33 0.94
Arginine 43.30 ± 4.81 0.93 155.11 ± 12.52 2.46 1.84 *
β-Alanine 39.17 ± 4.00 0.84 30.68 ± 2.15 0.49 −0.35 *
Phosphoserine 34.65 ± 1.88 0.75 33.11 ± 2.49 0.52 −0.07
Histidine 30.23 ± 3.20 0.65 135.99 ± 7.34 2.15 2.17 *
Threonine 23.54 ± 3.23 0.51 22.33 ± 2.22 0.35 −0.08
Phenylalanine 18.79 ± 2.42 0.40 17.25 ± 1.68 0.27 −0.12
Tyrosine 12.91 ± 4.17 0.28 11.63 ± 1.44 0.18 −0.15
Lysine 12.10 ± 1.71 0.26 13.32 ± 1.72 0.21 0.14
Citrulline 10.17 ± 4.09 0.22 7.28 ± 1.69 0.12 −0.48
Glycine 8.31 ± 1.29 0.18 8.86 ± 0.66 0.14 0.09
Isoleucine 5.92 ± 0.55 0.13 10.24 ± 0.38 0.16 0.79 *
Cystine 5.89 ± 0.75 0.13 3.90 ± 1.28 0.06 −0.59 *
Leucine 4.89 ± 1.48 0.11 5.49 ± 0.94 0.09 0.17
Valine 4.71 ± 0.83 0.10 3.48 ± 0.33 0.06 −0.44
Ornithine 3.54 ± 1.20 0.08 2.52 ± 0.78 0.04 −0.49
Methionine 3.18 ± 0.09 0.07 2.25 ± 1.18 0.04 −0.5
Phosphorylethanolamine 2.64 ± 1.13 0.06 24.30 ± 0.56 0.38 3.20 *
Total 4642.09 100 6313.53 100
The fold change of the amino acid concentration between HP and LP conditions was calculated as the logarithm of
LP/HP to the base 2 (i.e., log2 (LP/HP)). Data in the table are means of three replicates with standard error. Asterisks
indicate significant difference between HP and LP treatment (*: p < 0.05).Int. J. Mol. Sci. 2018, 19, 2924 6 of 23
2.3. Changes of Transcriptomes in Soybean Nodules Resulting from Pi Starvation
Transcriptome analysis of soybean nodules in response to Pi starvation was determined by
RNA-seq analysis. A total of six libraries were constructed. RNA-seq analysis produced about 47.6
and 48.1 million raw reads for nodules at HP and LP levels, respectively (Table S1). After excluding
the low-quality readings, about 45.6 and 46.2 million clean reads were obtained for libraries of HP and
LP nodules, respectively (Table S1). Among them, a total of 42.8 and 43.3 million clean reads perfectly
mapped to soybean reference genes for each P treatments (Table S1). Finally, a total of 38,831 and
38,874 gene transcripts were found to be expressed in P-sufficient and P-deficient nodules, respectively
(Table 2). Differentially expressed genes (DEGs) were those with transcripts observed to have at least
2-fold changes in expression, as well as, q value ≤ 0.05. Using these criteria, a total of 2055 genes were
considered to be differently expressed in soybean nodules between the two P treatments (Table 2).
Among them, 1431 genes were up-regulated by P deficiency, while 624 genes were down-regulated
(Table 2 and Table S2). Gene ontology (GO) category analysis showed that the 2055 Pi-responsive
genes could be divided among 22 biological processes, 14 cellular component, and 11 molecular
function terms (Figure S1). Among these categories, cellular process, cell part, and binding function
were the most prevalent among biological process, cellular component and molecular function terms,
respectively (Figure S1).
Table 2. Gene number identified through RNA-seq analysis.
Total Expressed Genes Up-Regulated Down-Regulated
HP 38,813
LP 38,874
DEGs * 2055 1431 624
* DEGs: Differentially expressed genes between Pi sufficient (HP) and deficient (LP) soybean nodules.
2.4. Analysis of Pi-Responsive Genes Involved in Metabolome
MapMan analysis was further used to examine DEGs in soybean nodules. The expression ratios
of LP/HP were utilized and graphical representations were obtained for visual analysis from MapMan
(Figure 3). In total, the differentially expressed genes were predicted to participate in 22 metabolic
processes (Figure 3). However, Pi-starvation responsive genes were mainly associated with lipid
metabolism (55 genes), hormone metabolism (46 genes), cell wall (44 genes), and secondary metabolism
(31 genes). Of the remaining categories, 18, 17, 15, 13, 11, and 10 genes were respectively associated
with minor CHO (carbohydrate) metabolism, nucleotide metabolism, major CHO metabolism, redox,
photosynthesis process, and glycolysis (Figure S2). At the low end of representation, less than five
genes were predicated to be involved in C1 (one carbon)-metabolism, TCA (Tricarboxylic Acid)
transformation, gluconeogenesis/glyoxylate cycle, polyamine metabolism, mitochondrial electron
transport/ATP synthesis, fermentation, tetrapyrrole synthesis, S-assimilation, N-metabolism, co-factor,
and vitamin metabolism, and biodegradation of xenobiotics (Figure S2). Furthermore, 16 genes were
identified to be involved in amino acid metabolism (Table S3). Among them, a total of nine genes
were up-regulated by Pi starvation, including three asparagine synthetases, two ornithine decarboxylases,
two lysine decarboxylases, one glutamine synthetase, and glutamyl-tRNA (Gln) amidotransferase subunit
C (Table S3). However, a total of seven genes were down-regulated by Pi starvation, including
two histidine decarboxylases, two S-adenosylmethionine decarboxylases, one cysteine synthase, tyrosine
aminotransferase, and lysine decarboxylase (Table S3).Int. J. Mol. Sci. 2018, 19, 2924 7 of 23
Int. J. Mol. Sci. 2018, 19, x 7 of 22
Figure3.3.MapMan
Figure MapMan analysis
analysis of
ofdifferentially
differentially expressed
expressed genes
genes in
insoybean
soybean nodules.
nodules. In
In the
the color
color scale,
scale,
blue and red represent up-regulated and down-regulated expression, respectively, in
blue and red represent up-regulated and down-regulated expression, respectively, in response toresponse toPi
Pi
starvation within soybean nodules. Black dots represent no gene enrichment to the category
starvation within soybean nodules. Black dots represent no gene enrichment to the category entries. entries.
Numbersrepresent
Numbers representfold
foldchanges
changesininexpression
expressionlevels
levelsexpressed
expressedasasLog
Log2 (LP/HP).
2(LP/HP).
2.5.
2.5. Identification
IdentificationofofPi-Starvation
Pi-StarvationResponsive
ResponsiveGenes
GenesControlling
ControllingNodule
NodulePi
PiHomeostasis
Homeostasis
Since
Sincesoybean
soybeannodules
nodulesare areaaPPsink,
sink,three
threegene
genefamilies
familiesinvolved
involvedin inPiPihomeostasis
homeostasiswere werefurther
further
analyzed
analyzed among
among DEGs,DEGs, including
includingPT PT(Phosphate
(Phosphate Transporter),
Transporter), PAP PAP (Purple
(Purple AcidAcid Phosphatase)
Phosphatase) and and
SPX
SPX (proteins containing the SYG1/PHO81/XPR1 domain). Out
(proteins containing the SYG1/PHO81/XPR1 domain). Out of 14 GmPT members, eight were of 14 GmPT members, eight were
significantly
significantly enhanced
enhanced in in nodules
nodules in in response
responsetotoPPdeficiency
deficiency(Table
(Table3).3).Among
Among them,
them, moremore than
than 16-
16-fold increases
fold increases were
were observedfor
observed fortranscripts GmPT5and
transcriptsofofGmPT5 GmPT6in
andGmPT6 inP-deficient
P-deficient nodules
nodules (Table
(Table 3).
3).
Phylogenetic analysis showed that GmPT proteins encoded by eight Pi-starvation
Phylogenetic analysis showed that GmPT proteins encoded by eight Pi-starvation responsive GmPT responsive GmPT
members
members werewere classified into two
classified into two sub-groups
sub-groups(Figure
(FigureS4).
S4).GmPT1/4/7/13
GmPT1/4/7/13 werewere classified
classified into into
sub-
sub-group I, with MtPT1/2/3/5 and AtPht1;1/2/3. However, GmPT2/5/6/14
group I, with MtPT1/2/3/5 and AtPht1;1/2/3. However, GmPT2/5/6/14 belonged to sub-group II with belonged to sub-group
IIAtPht1;4/7
with AtPht1;4/7
(Figure(Figure
S4). For S4).SPX SPX family,
Forfamily, eighteight
GmSPX GmSPX members
members were were significantly
significantly up-regulated
up-regulated in
in nodules
nodules bybyPiPistarvation,
starvation,especially GmSPX9with
especiallyGmSPX9 withaa168-fold
168-foldincrease
increase (Table
(Table 3).
3). Phylogenetic
Phylogenetic analysis
analysis
showed
showedall allproteins
proteins encoded
encoded by byPi-starvation
Pi-starvationresponsive GmSPXs
responsive GmSPXswere classified into three
were classified intosub-groups,
three sub-
including
groups, including sub-group I, II, and V (Figure S5). GmSPX3/7/8 were classified into I,sub-group
sub-group I, II, and V (Figure S5). GmSPX3/7/8 were classified into sub-group containingI,
PvSPX1/2,
containingand AtSPX1/2
PvSPX1/2, and(Figure
AtSPX1/2S4). (Figure
Sub-group S4).IISub-group
contained GmSPX2/4/5/9 and PvSPX3and
II contained GmSPX2/4/5/9 (Figure S5).
PvSPX3
GmSPX1/10 belonged to sub-group V with AtSPX3 and OsSPX3/5/6 (Figure
(Figure S5). GmSPX1/10 belonged to sub-group V with AtSPX3 and OsSPX3/5/6 (Figure S5). For the S5). For the PAP family,
16 members
PAP family,were significantly
16 members up-regulated,
were significantlymost of all, GmPAP11
up-regulated, mostwithof aall,
41-fold increasewith
GmPAP11 in expression
a 41-fold
(Table 3). Phylogenetic
increase in expressionanalysis(Table showed that all identified
3). Phylogenetic analysisGmPAPs
showedwere thatclassified into four
all identified sub-groups
GmPAPs were
(Figure S6). GmPAP11/20/23 were classified into sub-group I, with PvPAP2,
classified into four sub-groups (Figure S6). GmPAP11/20/23 were classified into sub-group I, with SgPAP10, AtPAP10,
AtPAP12,
PvPAP2, OsPAP10a, and OsPAP10c
SgPAP10, AtPAP10, (FigureOsPAP10a,
AtPAP12, S6). GmPAP21/31/32
and OsPAP10c belonged to sub-group
(Figure III together
S6). GmPAP21/31/32
with OsPAP21b/23, AtPAP15/23 (Figure S6). GmPAP1/17/30/35, together
belonged to sub-group III together with OsPAP21b/23, AtPAP15/23 (Figure S6). GmPAP1/17/30/35, with OsPAP9b, AtPAP2/9
together with OsPAP9b, AtPAP2/9 belonged to sub-group IV (Figure S6). GmPAP8/9/10/13/15/16
belonged to sub-group V with PvPAP3, SgPAP7 and AtPAP17 (Figure S6).Int. J. Mol. Sci. 2018, 19, 2924 8 of 23
belonged to sub-group IV (Figure S6). GmPAP8/9/10/13/15/16 belonged to sub-group V with
PvPAP3, SgPAP7 and AtPAP17 (Figure S6).
Table 3. Differentially expressed genes involved in Pi homeostasis.
Accession No. Name/Description Log2 (LP/HP) Q Value
Glyma.02G005800 GmPT1 1.15 3.0 × 10⁻²
Glyma.03G162800 GmPT2 1.41 1.34 × 10⁻¹⁵
Glyma.10G006700 GmPT4 3.99 1.12 × 10−45
Glyma.10G036800 GmPT5 4.04 2.84 × 10−166
Glyma.10G186400 GmPT6 4.01 2.56 × 10⁻³⁰
Glyma.10G186500 GmPT7 2.28 5.85 × 10−50
Glyma.20G204000 GmPT13 1.82 1.3 × 10⁻¹³
Glyma.20G204100 GmPT14 3.67 1.02 × 10⁻²¹
Glyma.02G117000 GmPAP1 2.15 3.94 × 10⁻¹⁵
Glyma.05G138400 GmPAP8 3.03 3.05 × 10−43
Glyma.05G247900 GmPAP9 2.45 5.49 × 10−93
Glyma.05G247800 GmPAP10 2.28 4.15 × 10⁻²⁹
Glyma.06G028200 GmPAP11 5.41 1.90 × 10−239
Glyma.08G056400 GmPAP13 2.43 1.11 × 10−84
Glyma.08G093500 GmPAP15 2.19 2.92 × 10−46
Glyma.08G093600 GmPAP16 2.29 8.75 × 10−47
Glyma.08G291600 GmPAP17 1.70 2.33 × 10⁻¹⁹
Glyma.09G229200 GmPAP20 3.70 3.36 × 10−162
Glyma.10G071000 GmPAP21 4.61 9.92 × 10−78
Glyma.12G007500 GmPAP23 3.14 3.07 × 10−110
Glyma.18G132500 GmPAP30 1.29 3.01 × 10⁻¹³
Glyma.19G026600 GmPAP31 4.86 1.32 × 10−73
Glyma.19G193900 GmPAP32 1.81 2.24 × 10⁻⁴
Glyma.20G026800 GmPAP35 1.66 1.02 × 10⁻³⁵
Glyma.01G135500 GmSPX1 6.35 0
Glyma.04G067400 GmSPX2 2.09 1.39 × 10⁻⁵
Glyma.04G147600 GmSPX3 4.55 9.01 × 10−105
Glyma.06G069000 GmSPX4 5.89 5.27 × 10−124
Glyma.10G261900 GmSPX5 1.99 2.31 × 10⁻¹⁴
Glyma.13G166800 GmSPX7 3.41 4.79 × 10−103
Glyma.17G114700 GmSPX8 3.52 1.03 × 10−73
Glyma.20G129000 GmSPX9 7.40 2.6 × 10−118
2.6. Identification of Genes Functioning as Transporters
In addition to Pi high affinity transporters, a total of 16 other types of transporters were also
identified as responsive to P deficiency in soybean nodules (Figure 4 and Table S4). Among them,
genes encoding ABC transporters were the most abundant, and then the amino acid transporters,
with 14 and eight of each type, respectively, identified as P responsive in soybean nodules (Figure 4).
Of these, all of 14 ABC transporters were up-regulated, while seven amino acid transporters were
up-regulated and one was down-regulated (Figure 4).
In regard to transport of other molecules containing nitrogen, two nitrate transporters,
Glyma.13G323800 (i.e., GmNRT2) [68] and Glyma.17G124900, were significantly down- and
up-regulated in response to P deficiency, respectively, while one ammonium transporter was
up-regulated in nodules (Figure 4), which suggests that P deficiency significantly influences N
acquisition and translocation in nodules (Figure 4). Moreover, P deficiency led to significant increases
in the transcription of three sugar transporters, two glycerol-3-phosphate transporters, two ascorbate
transporters, one nucleoside transporter, one nucleobase-ascorbate transporter, and one organic
cation/carnitine transporter, while decreases in the transcription of two aluminum-activated malate
transporters in soybean nodules (Figure 4).321 increases in the transcription of 3 sugar transporters, 2 glycerol‐3‐phosphate transporters, 2
322 ascorbate transporters, 1 nucleoside transporter, 1 nucleobase‐ascorbate transporter, and 1
323 organic cation/carnitine transporter, while decreases in the transcription of 2
324 aluminum‐activated malate transporters in soybean nodules (Figure 4).
325 Int. J. Mol.In
Sci.regards
2018, 19, to
2924
transport of other mineral nutrients, down‐regulation was observed for 2 9 of 23
326 sulfate transporters, and 1 boron transporter (Figure 4). On the other hand, up‐regulation was
327 In regardfor
observed to4transport of other mineral
sulfate transporters, 2 ironnutrients, down-regulation
transporters, a single boronwas observedpotassium
transporter, for two sulfate
328 transporters
transporter, and NRAMP metal ion transporter (Figure 4).These results suggestwas
and one boron transporter (Figure 4). On the other hand, up-regulation thatobserved
P
329 for four sulfate transporters, two iron transporters, a single boron transporter, potassium
deficiency significantly influences the acquisition or translocation of many nutrients and transporter,
and NRAMP metal ion transporter (Figure 4). These results suggest that P deficiency significantly
330 metabolites in nodules.
influences the acquisition or translocation of many nutrients and metabolites in nodules.
331
332 Gene number
1 2 3 4 5 6 7 8 9 10 11 12 13 14
ABC transporter
Amino acid transporter
Sulfate transporter
Sugar transporter
Glycerol‐3‐phosphate transporter
Aluminum‐activated malate transporter
Nitrate transporter
Ascorbate transporter
Boron transporter
Iron transporter
Nucleotide transporter
Nucleobase‐ascorbate transporter
Ammonium transporter
NRAMP metal transporter
Organic cation/carnitine transporter
Potassium transporter
333
334 ‐2 ‐1 0 1 2
335 Figure
Figure 4. Heatmap
4. Heatmap analysis
analysis of Pofresponsive
P responsive DEGs
DEGs associated
associated with
with transport
transport inin nodules.Blue
nodules. Blueand red
336 and red represent up‐regulated and down‐regulated expression, respectively, in response to
represent up-regulated and down-regulated expression, respectively, in response to Pi starvation Pi within
337 starvation within soybean nodules. Numbers represent fold changes in expression levels
soybean nodules. Numbers represent fold changes in expression levels expressed as Log2 (LP/HP).
338 expressed as Log2 (LP/HP).
2.7. Genes Involved in Hormonal Signaling Pathways
339 2.7. Genes involved in hormonal signaling pathways
A total of 38 genes involved in hormonal signaling were differentially expressed in response to
340 Pi starvation, which affected four types of hormone signaling pathways. These DEGs included 11
genes involved in auxin signaling, two in cytokinin (CK) signaling, 22 in ethylene signaling, and three
in gibberellin (GA) signaling (Table 4). Furthermore, nine out of 11 auxin signaling DEGs, one out
of two CK signaling DEGs, 19 out of 22 ethylene signaling DEGs, and all of the GA signaling DEGs
were up-regulated by Pi starvation in nodules (Table 4). These results suggest that P deficiency affects
growth and development in nodules partially through hormone signaling networks.Int. J. Mol. Sci. 2018, 19, 2924 10 of 23
Table 4. Differentially expressed genes involved in hormonal signaling.
Hormone Accession No. Name/Description Log2 (LP/HP) Q Value
Glyma.02G142400 AUX/IAA family auxin-responsive protein 2.25 3.56 × 10⁻⁸
Glyma.02G142500 AUX/IAA family auxin-responsive protein 2.28 5.80 × 10⁻¹⁶
Glyma.04G025300 AUX/IAA family auxin-responsive protein 1.91 3.46 × 10⁻²⁴
Glyma.05G196300 AUX/IAA family auxin-responsive protein 1.58 4.80 × 10⁻⁷
Glyma.09G193000 AUX/IAA family auxin-responsive protein 1.06 3.69 × 10⁻²
Auxin Glyma.10G031900 SAUR family auxin-responsive protein 1.86 7.77 × 10⁻⁶
Glyma.10G056200 SAUR family auxin-responsive protein −1.07 9.92 × 10⁻⁴
Glyma.12G035700 SAUR family auxin-responsive protein 1.84 5.57 × 10⁻⁵
Glyma.13G361200 SAUR family auxin-responsive protein 1.06 2.09 × 10⁻⁶
Glyma.16G020800 SAUR family auxin-responsive protein −1.27 1.70 × 10⁻²
Glyma.19G206100 Auxin response factor 2.16 7.42 × 10⁻⁶
Glyma.04G055600 Cytokinin dehydrogenase −1.25 2.96 × 10⁻³
Cytokinin
Glyma.20G159600 Cytokinin hydroxylase 1.56 1.95 × 10⁻³
Glyma.01G206600 AP2-like ethylene response factor 1.18 3 × 10⁻²
Glyma.02G132500 AP2-like ethylene response factor 1.90 2.06 × 10⁻⁵
Glyma.05G063500 AP2-like ethylene response factor 1.12 3.03 × 10⁻⁴
Glyma.06G236400 AP2-like ethylene response factor 1.09 6.61 × 10⁻⁶
Glyma.07G113800 AP2-like ethylene response factor 1.28 4.46 × 10⁻³
Glyma.07G212400 AP2-like ethylene response factor 2.60 1.05 × 10⁻¹⁸
Glyma.09G072000 AP2-like ethylene response factor 2.30 2.54 × 10⁻¹⁰
Glyma.10G118900 AP2-like ethylene response factor 1.01 7.27 × 10⁻⁶
Glyma.10G194200 AP2-like ethylene response factor 1.23 6.20 × 10⁻³
Glyma.12G110400 AP2-like ethylene response factor 1.04 4 × 10⁻²
Ethylene Glyma.12G203100 AP2-like ethylene response factor 1.32 3.03 × 10⁻⁴
Glyma.13G040400 AP2-like ethylene response factor −1.13 2 × 10⁻²
Glyma.13G112400 AP2-like ethylene response factor 2.16 1.95 × 10⁻⁶
Glyma.15G180000 AP2-like ethylene response factor 2.87 3.81 × 10⁻¹⁶
Glyma.17G047300 AP2-like ethylene response factor 1.20 3 × 10⁻²
Glyma.17G070800 AP2-like ethylene response factor 1.25 6.47 × 10⁻³
Glyma.17G145300 AP2-like ethylene response factor 1.26 1.54 × 10⁻⁵
Glyma.18G281400 AP2-like ethylene response factor −1.35 3.86 × 10⁻⁴
Glyma.19G256800 AP2-like ethylene response factor 1.27 2 × 10⁻²
Glyma.20G070100 AP2-like ethylene response factor 1.93 2.56 × 10⁻⁹
Glyma.20G172800 AP2-like ethylene response factor −1.18 2 × 10⁻²
Glyma.14G041500 EIN3-like ethylene response factor 1.32 8.33 × 10⁻¹⁹
Glyma.12G137700 Gibberellin-responsive protein 1.44 7.13 × 10⁻⁴
Gibberellin Glyma.13G285400 Gibberellin-responsive protein 1.49 2.82 × 10⁻⁸
Glyma.19G013000 Gibberellin-regulated protein 1.06 3 × 10⁻²
2.8. Ca2+ Signaling Related Genes in Soybean Nodules Regulated by P Deficiency
A total of 24 Ca2+ signaling related DEGs were identified in P-deficient soybean nodules, including
two coding calmodulin-like proteins, three genes for annexins, two for calcium ATPases, four for
calcium-dependent protein kinase, 12 for calcium-binding proteins, and one calmodulin-binding
transcription activator (Table 5). Among these 24 Ca2+ signaling related DEGs, 19 were up-regulated
and five were down-regulated, including one annexin gene, three genes coding for calcium-binding
proteins, and one gene encoding a calcium-dependent protein kinase (Table 5).Int. J. Mol. Sci. 2018, 19, 2924 11 of 23
Table 5. Differentially expressed genes involved in Ca2+ signaling.
Accession No. Name/Description Log2 (LP/HP) Q Value
Glyma.05G085200 Annexin 1.86 8.71 × 10⁻⁹
Glyma.05G178200 Annexin 1.18 7.92 × 10⁻¹⁶
Glyma.10G002200 Annexin-like −1.29 4.65 × 10⁻¹⁴
Glyma.01G166100 Calmodulin-binding transcription activator 1.76 2.47 × 10⁻¹⁷
Glyma.02G059200 Calcium-transporting ATPase 1.66 4.21 × 10⁻¹³
Glyma.02G245700 Calcium-transporting ATPase 1.44 4.46 × 10⁻¹³
Glyma.03G138000 Calmodulin-like protein −1.03 3.38 × 10⁻⁴
Glyma.04G064800 Calmodulin-like protein 1.43 3.68 × 10⁻⁵
Glyma.04G136200 Calcium-binding protein 1.32 1.40 × 10⁻⁴
Glyma.05G047100 Calcium uptake protein 1.15 2 × 10⁻²
Glyma.05G199400 Calcium-binding protein 1.47 5.09 × 10⁻⁴
Glyma.06G171100 Calcium-binding protein 1.06 4 × 10⁻²
Glyma.07G229500 Calcium-binding
Int. J. Mol. Sci. 2018, 19, x FOR PEER REVIEW protein 1.56 8.46 × 10⁻⁶ 13 of 27
Glyma.08G006900 Calcium-binding protein −1.19 5.63 × 10⁻³
Glyma.11G048300 Calcium-binding protein 1.50 2.93 × 10⁻⁴
354 ATPases, four for calcium‐dependent protein kinase, 12 for calcium‐binding proteins, -3 and 1
Glyma.11G077300 Calcium-binding protein 1.16 3.34 × 10
355 calmodulin‐binding
Glyma.11G157100 transcription activator (Table
Calcium-binding 5). Among these1.11
protein 2 × 10−related
24 Ca2+ signaling 2
Glyma.12G217700 Calcium-binding protein 2.23 1.37 × 10 −9
356 DEGs, 19 were up‐regulated and 5 were down‐regulated, including one annexin gene,−3three
Glyma.14G156300 Calcium-binding protein −1.48 2.72 × 10
357 genes coding for calcium‐binding
Glyma.14G222000 proteins, protein
Calcium-binding and one gene encoding1.58 a calcium‐dependent
2.06 × 10⁻²⁰
358 Glyma.16G142100
protein kinase (Table 5). Calcium-binding protein 1.12 1.60 × 10⁻⁹
Glyma.17G128900 Calcium-dependent protein kinase 1.40 1.65 × 10⁻⁶
Glyma.20G034200 Calcium-dependent protein kinase 1.06 1.73 × 10⁻⁴
359 2.9.Glyma.20G066800
Transcription factors in soybean nodules regulated
Calcium-dependent proteinby P deficiency
kinase 1.55 9.09 × 10⁻¹⁶
360 Glyma.05G248000
A total of 71 putative Calcium-dependent protein
transcription factor geneskinase −1.08
responded significantly 2.08
to P × 10−4 in
deficiency
361 soybean nodules (Figure 5). Among them, genes related to WRKY transcription factors were
362 2.9. Transcription
the Factors inwith
most abundant, Soybean
15 Nodules Regulated by P and
being up‐regulated Deficiency
2 down‐regulated (Figure 5). The
363 A total of 71 putative transcription factor genes responded significantly
remaining transcription factor DEGS were observed as follows. Thirteen to P C2H2
deficiency in soybean
family DEGs
364 nodules (Figure 5). Among them, genes related to WRKY transcription factors were
were up‐regulated, but one was down‐regulated, 11 MYB family DEGs were up‐regulated andthe most abundant,
with 15 being up-regulated and two down-regulated (Figure 5). The remaining transcription factor
365 1 down‐regulated, 5 bHLH family DEGs were up‐regulated and 4 down‐regulated, 4 bZIP
DEGS were observed as follows. Thirteen C2H2 family DEGs were up-regulated, but one was
366 down-regulated,
family DEGs11were MYBup‐regulated and 1up-regulated
family DEGs were down‐regulated,
and one and 3 GRAS family
down-regulated, fiveDEGs
bHLH were
family
367 DEGs up‐regulated and 2 and
were up-regulated down‐regulated (Figure four
four down-regulated, 5). Interestingly,
bZIP family DEGs 5 NAC
weremembers, 4 C3HC4
up-regulated and one
368 down-regulated,
members, 3 PLATZ and three GRAS family
members, and 2 DEGs
MADSwere up-regulated
members andintwo
identified down-regulated
nodules (Figure 5).
were up regulated
369 Interestingly, five NAC members,
by P deficiency (Figure 5). four C3HC4 members, three PLATZ members, and two MADS
members identified in nodules were up regulated by P deficiency (Figure 5).
370
371 20
Up
372 Down
15
Number of genes
373
374
10
375
376
5
377
378
0
379 WRKY C2H2 MYB bHLH bZIP GRAS NAC C3HC4 PLATZ MADS
380
Figure 5. Differentially expressed genes associated with transcription factor activity in soybean nodules.
381 Figure 5. Differentially expressed genes associated with transcription factor activity in soybean
382 nodules.
383 2.10. Analysis of gene transcripts using qRT‐PCR
384 In order to confirm results from the RNA‐seq analysis, qRT‐PCR analysis was further
385 conducted with 10 up‐regulated DEGs in nodules at two P levels. All of these genes wereInt. J. Mol. Sci. 2018, 19, 2924 12 of 23
2.10. Analysis of Gene Transcripts Using qRT-PCR
To confirm results from the RNA-seq analysis, qRT-PCR analysis was further conducted with 10
up-regulated DEGs in nodules at two P levels. All of these genes were significantly up-regulated by
Pi starvation in soybean nodules as determined by qRT-PCR procedures, which strongly supports
the reliability of the RNA-seq results (Figure 6 and Figure S3). Among the transcripts subjected to
qRT-PCR analysis, respective increases of over 7-fold and 3-fold were observed for two Pi transporters
genes, GmPT5 and GmPT7 (Figure 6). One SPX gene (GmSPX5), two purple acid phosphatase genes
(GmPAP8 and GmPAP21) exhibited 4-, 11-, and 17-fold increases, respectively, in LP plants relative
to those in the HP treatment (Figure 6). In qRT-PCR analysis of the tested transcription factor
DEGs, bZIP (Glyma.04G022100) was up-regulated more than 2-fold, bHLH (Glyma.11G043700) was
up-regulated more than 2.8-fold, and the tested WRKY (Glyma.16G026400) was up-regulated about
Int. J. Mol. Sci. 2018, 19, x FOR PEER REVIEW 14 of 27
3.3-fold in nodules subjected to P deficiency (Figure 6). Finally, the hormonal signaling ethylene
response factors, ERF1 (Glyma.01G206600) and ERF2 (Glyma.04G022100) were up regulated by 2.5-
396 (Glyma.01G206600) and ERF2 (Glyma.04G022100) were up regulated by 2.5‐ and 2.3‐fold,
and 2.3-fold, respectively (Figure 6).
397 respectively (Figure 6).
398 8 2.4 36 2 4
GmPT5 GmPT7 GmPAP8 GmPAP21 GmSPX5
399 6 1.8 * 27 * 1.5 * 3 *
*
400 4 1.2 18 1 2
Relative expression
401 2 0.6 9 0.5 1
402 0 0 0 0 0
HP LP HP LP HP LP HP LP HP LP
403
2.8 2.4 1.2 0.6 2.4
404 bZIP bHLH WRKY ERF1 ERF2
* * *
2.1 1.8 0.9 0.45 1.8
405 * *
1.4 1.2 0.6 0.3 1.2
406
0.7 0.6 0.3 0.15 0.6
407
0 0 0 0 0
408 HP LP HP LP HP LP HP LP HP LP
409 Figure 6. qRT-PCR analysis of ten Pi responsive genes in soybean nodules under Pi sufficient (HP) and
410 Figure 6. qRT‐PCR analysis of ten Pi responsive genes in soybean nodules under Pi sufficient
deficient (LP) conditions. Data in the figure are mean of four replicates with standard error. Asterisks
411 (HP) and deficient (LP) conditions. Data in the figure are mean of four replicates with standard
indicate significant difference between HP and LP treatments in the Student’s t-test (*: p < 0.05).
412 error. Asterisks indicate significant difference between HP and LP treatments in the Student’s
413 t‐test (*: PInt. J. Mol. Sci. 2018, 19, 2924 13 of 23
chickpea [64–66]. Common responses of legume nodules to Pi starvation could be demonstrated by
identifying a set of DEGs with high homology among three legume species, such as WRKY, MYB and
NAC [64–66]. However, it seems that more complex responses of soybean nodules to Pi starvation
were elucidated as reflected by identification of 2055 Pi-starvation responsive genes, which was more
than 495 in bean, 1140 in Medicago truncatula and 540 in chickpea [64–66]. For example, 8 GmPT
members and GmSPX members were found to be responsive to Pi starvation in soybean nodules,
but only 1 SPX member in Medicago truncatula, 1 PT member and SPX member in chickpea have
been identified [64–66]. Furthermore, it seems that a set of genes preferring to increase transcripts
in soybean nodules at low P levels were identified in the current study, such as GmPT5, GmSPX1,
and GmPAP11/30. For example, among eight Pi-starvation up-regulated GmSPX members in soybean
nodules, GmSPX1 has been documented to exhibit no response to Pi starvation in soybean roots [74].
Meanwhile, transcription of GmPAP11/30 was found to have no response to Pi starvation in soybean
roots [27], suggesting complex responses of soybean nodules to Pi starvation.
Enhanced Pi mobilization and acquisition through increased exudation of organic acids and
purple acid phosphatase, along with up-regulation of Pi transporters are well-documented strategies
employed by plant roots in response to P deficiency [75–81]. Nodules exhibit similar responses to roots
in response to P deprivation, with up-regulation of genes related to Pi mobilization and acquisition,
such as Pi transporters, and purple acid phosphatases, which allows for the maintenance of Pi
homeostasis in nodules (Table 3 and Figure 4). In this study, eight out of 14 GmPT members were
significantly enhanced in nodules as a result of P deficiency (Table 3). Among them, Pi starvation
up-regulated GmPT5 might mediate Pi homeostasis in soybean nodules through control of Pi
translocation from roots to nodules [35]. In the present study, other three GmPT members (i.e.,
GmPT2/6/14) were found to be up-regulated by Pi starvation, strongly suggesting other GmPT
members could mediate Pi acquisition and translocation in soybean nodules at low P level except to
GmPT5 [62], which merits further analysis.
Accompanying increases in the abundance of nine GmPT transcripts, 16 PAP transcripts were also
observed as differentially expressed in nodules subjected to Pi starvation, which is consistent with
observations of significantly increased APase activity in P deprived nodules (Table 3 and Figure 2).
Increased PAP transcription and APase activity are well known to play vital roles in the regulation of
internal P metabolism and extracellular organic P mobilization in plants [82,83]. Although functions of
several GmPAP have been documented, including the involvement of GmPhy and GmPAP4 in phytate-P
mobilization, and the participation of GmPAP3 in ROS metabolism in plants under salt stress, functions
of most Pi starvation up-regulated GmPAPs, except GmPAP21, remain largely unknown [84–87].
GmPAP21 overexpression leads to nodule growth inhibition in soybean, suggesting that it participates
in internal P metabolism within soybean nodules [87]. Furthermore, it was observed that organic-P
utilization was enhanced in rhizobia inoculated in soybean, it is reasonable to hypothesize that
Pi starvation responsive GmPAPs might also be involved in extracellular organic-P utilization in
soybean [18]. Among Pi starvation up-regulated GmPAPs, GmPAP11/20/23 exhibited high homology
with SgPAP10 in stylo functions as mediating extracellular organic-P utilization [81], suggesting that
GmPAP11/20/23 might contribute to extracellular organic-P utilization in soybean nodules.
In addition to GmPT and GmPAP, two GmSPX genes, GmSPX1 and GmSPX3, are also potentially
vital regulators of Pi signaling pathways in soybean [74,88]. Interestingly, GmSPX1 and GmSPX3,
together with six other GmSPX members were found to be significantly up-regulated in soybean
nodules upon Pi starvation (Table 3). This indicates that GmSPX members are good candidates for
genes involved in maintaining Pi homeostasis in soybean nodules.
In addition to differential expression associated with Pi acquisition and mobilization,
many Pi-starvation responsive DEGs in soybean nodules were associated with nitrate/nitrite
absorption and assimilation (Figure S2). Similarly, Pi starvation can lead to significant increases in the
concentrations of total amino acids and asparagine in common bean and chickpea [64,89]. Furthermore,
consistent with increased asparagine accumulation, three asparagine synthetase genes were found toInt. J. Mol. Sci. 2018, 19, 2924 14 of 23
be up-regulated by Pi starvation in soybean nodules (Table 1 and Table S3), strongly suggesting that
Pi starvation significantly influences amino acid accumulations in nodules. Increased asparagine
accumulation is known to inhibit the capacity for SNF in nodules, suggesting that asparagine plays
a role in N feedback regulation of SNF [90–92]. Plus, nitrogenase activity has been severely curtailed
through phloem-feeding of asparagine, which further implicates asparagine as a phloem-mobile
shoot-born factor that functions in systemic feedback regulation of SNF [91]. However, these previous
investigations did not include experiments of P effects. Therefore, further investigation of regulatory
mechanisms underlying amino acid synthesis and transport involving nodules in responses to Pi
starvation remains as a relevant subject for future researchers.
In this study, 38 plant hormone-related genes were identified as DEGs in response to P
deprivation (Table 4). This indicates that a variety of signaling pathways within nodules participate in
responses to Pi starvation. For example, two genes (Glyma.10G056200 and Glyma.16G020800) coding
auxin-responsive proteins were down-regulated, while one auxin responsive factor (Glyma.19G206100)
and 5 AUX/IAA family members were up-regulated by Pi starvation in soybean nodules (Table 4).
This suggests that auxin is involved in nodule adaptation to Pi starvation. However, specific roles
for auxin signaling in adaptive strategies of nodules to Pi starvation remain unknown. Although
miR160 can negatively regulate AUXIN RESPONSE FACTOR10 (ARF10), and, thus, increase auxin
sensitivity and inhibit soybean nodule development [93], none of these genes were found to be
significantly regulated by Pi starvation in the present study (Table 4). Therefore, other auxin pathways
might also regulate nodule responses to Pi starvation, which requires further investigation for more
conclusive evidence.
Calcium signaling was also found to be important in the current work, as 24 Ca2+ signaling
related genes were found to be regulated by Pi starvation in soybean nodules, including two
calmodulin-like and four calcium-dependent protein kinase. This suggests that low P availability affects
Ca2+ signaling, and thereby regulates nodule development (Table 5). Consistent with this result,
sustained oscillation of calcium concentrations is known to activate the expression of symbiosis-related
genes after perception of rhizobia-derived nodulation factors [94,95]. Meanwhile, CCaMK, a nuclear
calcium- and calmodulin-dependent kinase has been suggested as the central regulator in symbiotic
development in plants [96]. All these results strongly suggest that Ca2+ signaling is also involved in
regulating soybean nodule adaptations to Pi starvation.
Finally, significant alterations of transcriptional regulation are implied by the presence of 76
transcription factors among the DEGs responsive to P deficiency in soybean nodules. These numbers
include 12 MYB and five GRAS transcription factors (Figure 5). Although functions of MYB and
GRAS transcription factors remains largely unknown in soybean nodule development and responses
to Pi starvation, one MYB transcription factor, LjIPN2, has been documented as capable of binding
directly to the NIN gene promoter and, thus, play an important role in the Nod signaling pathway
in Lotus japonicas [97]. Meanwhile, it has been reported that the GRAS family transcription factors,
MtNSP1 and MtNSP2 form a protein complex that is essential for root nodule symbiosis in Medicago
truncatula [98]. The results herein are consistent with these previous reports and further suggest that
complex transcriptional regulatory networks participate in soybean nodule adaption to Pi starvation.
4. Materials and Methods
4.1. Plant, Rhizobium and Growth Conditions
The soybean (Glycine max L.) genotype YC03-3 and rhizobium strain USDA110 were selected for
hydroponic experiments. Seeds were sterilized and germinated in paper rolls for 4 days. Before
transplanting, roots of uniform seedlings were inoculated with rhizobia. The nutrient solution
contained KNO3 311.3 µM, NH4 NO3 94.3 µM, MgCl2 25 µM, MgSO4 ·7H2 O 500 µM, K2 SO4 300 µM,
MnSO4 ·H2 O 1.5 µM, ZnSO4 ·7H2 O 1.5 µM, CuSO4 ·5H2 O 0.5 µM, (NH4 )5 MoO24 ·4H2 O 0.16 µM,
Fe-EDTA (Na) 40 µM, NaB4 O7 ·10H2 O 2.5 µM, and 25 µM KH2 PO4 (LP) or 500 µM KH2 PO4 (HP).Int. J. Mol. Sci. 2018, 19, 2924 15 of 23
The pH value was adjusted to approximately 5.8, and the nutrient solution was changed weekly.
Leaves, roots, and nodules were harvested 25 days after transplanting.
4.2. Determination of Total P and Soluble Pi Concentrations
Total Pi and soluble Pi concentrations were analyzed as described previously [62]. For the total
P concentration measurements, about 0.2 g dry weight of shoots, roots, and nodules from each P
treatment was separately digested for each tissue in H2 SO4 , and further boiled and digested at 300 ◦ C
until the solution became clear. For soluble Pi concentrations, about 0.1 g of fresh samples of soybean
leaves, roots, and nodules were sampled separately and ground in deionized water for extraction.
The supernatant was collected after centrifugation at 12,000× g for 30 min. Total and soluble Pi
concentrations were determined as described by Murphy and Riley [99].
4.3. Acid Phosphatase Activity Measurements
Acid phosphatase activities of leaves, roots, and nodules were assessed as described
previously [77]. Briefly, about 0.1 g of fresh samples were ground and extracted for soluble protein using
100 mM Tris-HCl (pH 8.0). Reaction mixtures containing 1 mM $-nitrophenyl phosphate ($-NPP, Sigma,
Saint Louis, MO, USA), 2 mL of 45 mM Na-acetate buffer (pH 5.0) and protein extract were incubated
at 37 ◦ C for 15 min before halting reactions via the addition of 1 mL of 1 M NaOH. Absorbance was
measured at 405 nm. The concentration of soluble protein was analyzed using Coomassie Brilliant
Blue staining [100]. Acid phosphatase activity was presented as micromoles of $-NPP hydrolyzed per
milligram of protein per minute.
4.4. Nodule Nitrogenase Activity Analysis
Nodules attached roots were cut off to measure nitrogenase activity by the acetylene reduction
assay [101]. Fresh nodules were incubated in a closed container with 10% (v/v) acetylene gas for 2 h at
28 ◦ C prior to extracting 1 mL of reacted gas samples from the headspace using a syringe. Ethylene
content was calculated from peak areas of standards analyzed by gas chromatography. Nitrogenase
activity was calculated as µmole ethylene h−1 ·g−1 nodules.
4.5. Amino Acid Analysis
The amino acid compositions of nodules were analyzed in an automatic amino acid analyzer
(type L-8800, Hitachi Ltd., Tokyo, Japan), as described previously [102]. Briefly, about 0.1 g of
fresh samples were cut off and ground in 5% 5-sulfosalicylic acid dehydrated for the extraction.
The supernatant was collected after centrifugation at 12,000× g at 4 ◦ C for 30 min. Separation
column (4.6 mm × 60 mm) parameters: eluent flow rate = 0.4 mL/min, column temperature = 70 ◦ C,
and column pressure = 11.627 MPa. Reaction column parameters: ninhydrin buffer run at a flow rate
of 0.35 mL/min, column temperature = 135 ◦ C, column pressure = 1.078 MPa. The detection threshold
for amino-N compounds was 1 µg·g−1 fresh weight in nodules.
4.6. cDNA Library Preparation, RNA-Seq and Phylogenetic Analysis
After 25 days, nodules with the size more than 3 mm were collected for mRNA library construction
and sequencing. Nodules from two plants were pooled together as one replicate, and three replicates
from each P treatment were used for RNA-seq analysis. Total RNA of nodules was isolated using
Trizol reagent (Invitrogen, Carlsbad, CA, USA) according to the manufacturer’s protocol. The quantity
and purity of total RNA was checked using an Agilent 2100 RNA Nano 6000 Assay Kit (Agilent
Technologies, Palo Alto, CA, USA). About 3 µg of total RNA was subjected to mRNA enrichment
using oligo (dT) attached magnetic beads (Invitrogen). The mRNA was then fragmented into small
pieces using fragmentation buffer, which was then used as template strands. The first strand of cDNA
was synthesized by random hexamers, then added buffer, dNTPs, RNase H, and DNA polymeraseYou can also read