GEOLOGICAL ENDOWMENT SOUTH AFRICA'S WHAT OPPORTUNITIES DOES - BANZI GEOTECHNICS CC - Institute of Race Relations
←
→
Page content transcription
If your browser does not render page correctly, please read the page content below
WHAT OPPORTUNITIES DOES
SOUTH AFRICA’S
GEOLOGICAL
ENDOWMENT
OFFER FOR THE
COUNTRY’S FUTURE?

 BANZI GEOTECHNICS CC
July 2018

                  Published by the South African Institute of Race Relations (IRR)
                                   2 Clamart Road, Richmond
                                Johannesburg, 2092 South Africa
                   P O Box 291722, Melville, Johannesburg, 2109 South Africa
                                   Telephone: (011) 482–7221
                         © South African Institute of Race Relations 2018

                                         ISSN: 2311-7591

Members of the Media are free to reprint or report information, either in whole or in part, contained
in this publication on the strict understanding that the South African Institute of Race Relations is
  acknowledged. Otherwise no part of this publication may be reproduced, stored in a retrieval
    system, or transmitted in any form or by any means, electronical, mechanical, photocopy,
               recording, or otherwise, without the prior permission of the publisher.

    While the IRR makes all reasonable efforts to publish accurate information and bona fide
   expression of opinion, it does not give any warranties as to the accuracy and completeness
     of the information provided. The use of such information by any party shall be entirely at
           such party’s own risk and the IRR accepts no liability arising out of such use.

                                    Editor-in-chief: Frans Cronje

                                    Author: Banzi Geotechnics

                                  Typesetter: Martin Matsokotere

                                    Cover design by InkDesign
TABLE OF CONTENTS
1.0 INTRODUCTION . . . . . . . . . . . . . . . . . . . . . . . . . . . . . . . . . . . . . . . . . . . . . . . . . . . . . . . . . . . 4
2.0 SUBCONTINENTAL ROCK MASS . . . . . . . . . . . . . . . . . . . . . . . . . . . . . . . . . . . . . 4
    Fig. 1 : A Summary of the Geological History of South Africa (after McCarthy and
        Rubidge, 2005) . . . . . . . . . . . . . . . . . . . . . . . . . . . . . . . . . . . . . . . . . . . . . . . . . . . . . . . . . . . . . . . . . . . . 5
    Table 1: Summary of the Timeline for the Universe and the Geological Architecture
        of South Africa (after McCarthy & Rubidge, 2001)                                             . . . . . . . . . . . . . . . . . . . . . . . . . . . . . . . . 5-6

    Fig. 2: The landscapes of Southern Africa. The black dotted line demarcates
        the Great Escarpment. . . . . . . . . . . . . . . . . . . . . . . . . . . . . . . . . . . . . . . . . . . . . . . . . . . . . . . . . . . . . . 6
    Fig. 3: Geology in Education and Tourism and the Foundation for our Development . . 7
    Table 2: Minerals and metals produced in South Africa (modified after
        Banzi Geotechnics, 2018) . . . . . . . . . . . . . . . . . . . . . . . . . . . . . . . . . . . . . . . . . . . . . . . . . . . . . . . . . 7-8
3.0 THE PHYSIOGRAPHY OF SOUTHERN AFRICA . . . . . . . . . . . . . . . . 9
    3.1 Landscape. . . . . . . . . . . . . . . . . . . . . . . . . . . . . . . . . . . . . . . . . . . . . . . . . . . . . . . . . . . . . . . . . . . . . . . . 9
    3.2 Physiographic Regions . . . . . . . . . . . . . . . . . . . . . . . . . . . . . . . . . . . . . . . . . . . . . . . . . . . . . . . . . . . 9
    Fig. 4: Physiographic Regions of South Africa                                       . . . . . . . . . . . . . . . . . . . . . . . . . . . . . . . . . . . . . . . 10

    Table 3: Physiographic Regions of South Africa (after Reader's Digest Illustrated
        Atlas of Southern Africa, 1994) . . . . . . . . . . . . . . . . . . . . . . . . . . . . . . . . . . . . . . . . . . . . . . . . . . . 11
    Fig 5: The Great Karoo Basin and the Inland Plateau of South Africa
        (Petroleum Agency of South Africa, 2014)                                      . . . . . . . . . . . . . . . . . . . . . . . . . . . . . . . . . . . . . . . . 12

    3.3 Climate . . . . . . . . . . . . . . . . . . . . . . . . . . . . . . . . . . . . . . . . . . . . . . . . . . . . . . . . . . . . . . . . . . . . . . . . . 12
    Fig. 6 View over the Great Escarpment into Lesotho. ‘Littleberg’ in foreground
        with deeply weathered mantle of residual soils on Basalt underlain by
        Sandstone (Barker, 2012) . . . . . . . . . . . . . . . . . . . . . . . . . . . . . . . . . . . . . . . . . . . . . . . . . . . . . . . . . 12
    Fig. 7 Physical weathering of granitic rocks near Springbok Northern Cape with
        thick talus at base of slope supporting dense hardy vegetation (Barker, 2017) . . . . . . 13
    Fig. 8: Climatic Macro Division of South Africa, N> 5 meaning landforms
        mostly physically disintegrated, N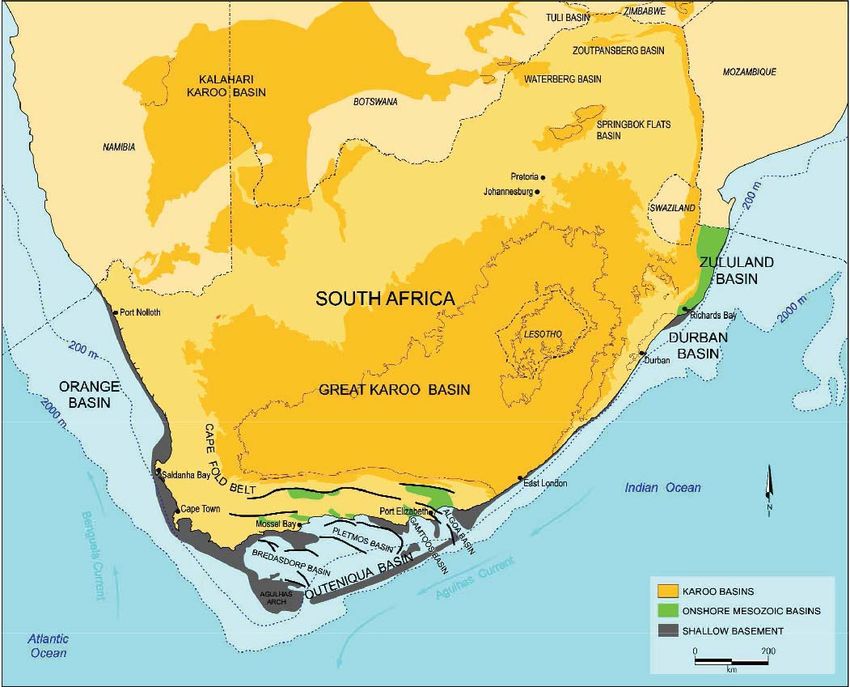
Fig. 10 Lake Fundudzi in Vendaland was formed by a landslide from the
N ridge of the Mutale River.. . . . . . . . . . . . . . . . . . . . . . . . . . . . . . . . . . . . . . . . . . . . . . . . . . . . . . . 16
3.7 Dams . . . . . . . . . . . . . . . . . . . . . . . . . . . . . . . . . . . . . . . . . . . . . . . . . . . . . . . . . . . . . . . . . . . . . . . . . . . 16
3.8 Pans . . . . . . . . . . . . . . . . . . . . . . . . . . . . . . . . . . . . . . . . . . . . . . . . . . . . . . . . . . . . . . . . . . . . . . . . . . . . 16
Fig. 11 Pans typically occur as round or round-edged closed water bodies . . . . . . . . . . . . 16
3.9 Derivative Opportunities . . . . . . . . . . . . . . . . . . . . . . . . . . . . . . . . . . . . . . . . . . . . . . . . . . . . . . . . 17
3.9.1 Tourism . . . . . . . . . . . . . . . . . . . . . . . . . . . . . . . . . . . . . . . . . . . . . . . . . . . . . . . . . . . . . . . . . . . . 17
3.9.2 Astronomy . . . . . . . . . . . . . . . . . . . . . . . . . . . . . . . . . . . . . . . . . . . . . . . . . . . . . . . . . . . . . . . . . . 17
4.0 ROCK-LINKED RESOURCES . . . . . . . . . . . . . . . . . . . . . . . . . . . . . . . . . . . . . . . . . . 18
4.1 Water . . . . . . . . . . . . . . . . . . . . . . . . . . . . . . . . . . . . . . . . . . . . . . . . . . . . . . . . . . . . . . . . . . . . . . . . . . . 18
4.1.1 Groundwater . . . . . . . . . . . . . . . . . . . . . . . . . . . . . . . . . . . . . . . . . . . . . . . . . . . . . . . . . . . . . . . 18
Fig. 12: Aquifer classification map (after Matoti, et al 1999) . . . . . . . . . . . . . . . . . . . . . . . . . . 18
Surface Water . . . . . . . . . . . . . . . . . . . . . . . . . . . . . . . . . . . . . . . . . . . . . . . . . . . . . . . . . . . . . . . . . . . . . . . 18
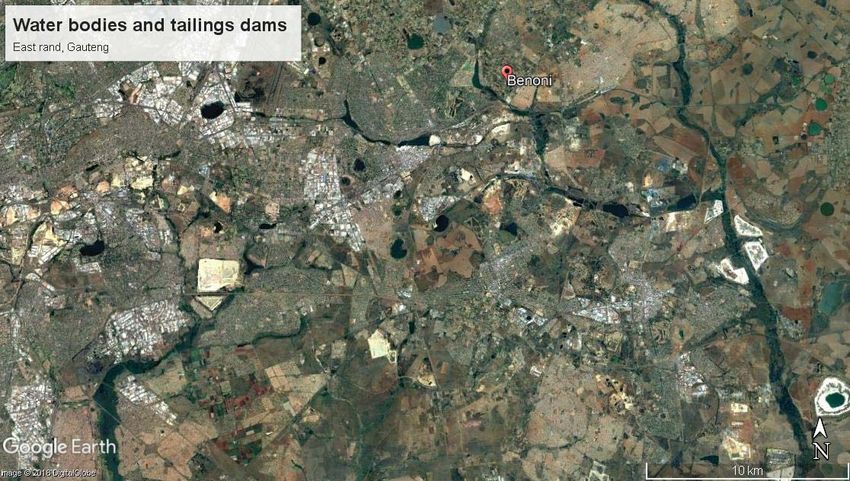
Fig. 13: In the East Rand of Gauteng, tailings dams related to old gold mining
(light shapes) are in close proximity to pans (round, dark shapes) and river
courses, as well as residential areas . . . . . . . . . . . . . . . . . . . . . . . . . . . . . . . . . . . . . . . . . . . . . . . . 19
4.1.2 Opportunity derived from Acid Mine Drainage . . . . . . . . . . . . . . . . . . . . . . . . . . . . . . . 19
4.2 Minerals . . . . . . . . . . . . . . . . . . . . . . . . . . . . . . . . . . . . . . . . . . . . . . . . . . . . . . . . . . . . . . . . . . . . . . . . 20
4.3 Metallic . . . . . . . . . . . . . . . . . . . . . . . . . . . . . . . . . . . . . . . . . . . . . . . . . . . . . . . . . . . . . . . . . . . . . . . . . 20
4.3.1 Precious Metals . . . . . . . . . . . . . . . . . . . . . . . . . . . . . . . . . . . . . . . . . . . . . . . . . . . . . . . . . . . . . 20
4.3.1.1 Gold . . . . . . . . . . . . . . . . . . . . . . . . . . . . . . . . . . . . . . . . . . . . . . . . . . . . . . . . . . . . . . . . . . . . 20
Fig. 14: Top left: The Witwatersrand Basin (red), Bushveld Igneous Complex (light
green), and Barberton, Murchison and Giyani greenstone belts (bright green).
Bottom left: A Conceptual Model of how ‘Wits’ gold-bearing reefs formed.
Right: The eight gold basins of the Witwatersrand Basin (Source: Barker
and Associates, 2003) . . . . . . . . . . . . . . . . . . . . . . . . . . . . . . . . . . . . . . . . . . . . . . . . . . . . . . . . . . . . . 21
4.3.2 Platinum . . . . . . . . . . . . . . . . . . . . . . . . . . . . . . . . . . . . . . . . . . . . . . . . . . . . . . . . . . . . . . . . . . . 21
Fig. 15: The Bushveld Complex of South Africa (Books on the Wall
Publishing, 2011). The contact between the dark green and light
green layers marks PGE-bearing horizons . . . . . . . . . . . . . . . . . . . . . . . . . . . . . . . . . . . . . . . . . 22
4.3.3 Opportunities in Gold and Platinum . . . . . . . . . . . . . . . . . . . . . . . . . . . . . . . . . . . . . . . . . 22
4.4 Base Metals . . . . . . . . . . . . . . . . . . . . . . . . . . . . . . . . . . . . . . . . . . . . . . . . . . . . . . . . . . . . . . . . . . . . . 24
4.4.1 Copper, Nickel, Zinc, Lead, Tin . . . . . . . . . . . . . . . . . . . . . . . . . . . . . . . . . . . . . . . . . . . . . . 24
4.5 Heavy Metals . . . . . . . . . . . . . . . . . . . . . . . . . . . . . . . . . . . . . . . . . . . . . . . . . . . . . . . . . . . . . . . . . . . . 24
4.5.1 Iron, Manganese, Cobalt, Zinc, Cadmium, Mercury, Lead . . . . . . . . . . . . . . . . . . . . 24
4.5.2 Rare Earth Minerals . . . . . . . . . . . . . . . . . . . . . . . . . . . . . . . . . . . . . . . . . . . . . . . . . . . . . . . . 25
2 IRR POLICY PAPER, JUNE 2018
4.6 Other Mineral Commodities                             . . . . . . . . . . . . . . . . . . . . . . . . . . . . . . . . . . . . . . . . . . . . . . . . . . . . 25

         4.6.1 Energy Minerals - Coal . . . . . . . . . . . . . . . . . . . . . . . . . . . . . . . . . . . . . . . . . . . . . . . . . . . . . . 25
    Fig. 16: The coalfields of Southern Africa occupy the north eastern quadrant
        of the country (Banzi Geotechnics cc, 2014) . . . . . . . . . . . . . . . . . . . . . . . . . . . . . . . . . . . . . . . 26
         4.6.2 Energy Minerals – petroleum . . . . . . . . . . . . . . . . . . . . . . . . . . . . . . . . . . . . . . . . . . . . . . . . 27
    Fig. 17 PASA Map of Petroleum permits and rights in South Africa waters
        (Continental Shelf) and on land (unconventional oil and gas)                                                      . . . . . . . . . . . . . . . . . . . . . 27

         4.6.3 Diamonds            . . . . . . . . . . . . . . . . . . . . . . . . . . . . . . . . . . . . . . . . . . . . . . . . . . . . . . . . . . . . . . . . . . 28

         4.6.4 Industrial Minerals                  . . . . . . . . . . . . . . . . . . . . . . . . . . . . . . . . . . . . . . . . . . . . . . . . . . . . . . . . . 28

5.0 OUR GEOLOGICAL ENDOWMENT: TOWARDS
  AN ENABLING ENVIRONMENT . . . . . . . . . . . . . . . . . . . . . . . . . . . . . . . . . . . . . . 29
6.0 CONCLUSION . . . . . . . . . . . . . . . . . . . . . . . . . . . . . . . . . . . . . . . . . . . . . . . . . . . . . . . . . . . . . . . 30
7.0 REFERENCES . . . . . . . . . . . . . . . . . . . . . . . . . . . . . . . . . . . . . . . . . . . . . . . . . . . . . . . . . . . . . . . . 31

WHAT OPPORTUNITIES DOES SOUTH AFRICA’S GEOLOGICAL                                                                                                                     3
ENDOWMENT OFFER FOR THE COUNTRY’S FUTURE?
WHAT OPPORTUNITIES DOES
    SOUTH AFRICA’S GEOLOGICAL
      ENDOWMENT OFFER FOR
      THE COUNTRY’S FUTURE?
1.0     INTRODUCTION
South Africa’s geological endowment transcends the mineral resources industry. From the country’s
favourable global location, its geological architecture, stratigraphy, and geomorphic landscape, multiple
industries have been born over the millennia of human settlement in the region. While it is recognised
that there is a multiplicity of geological resources in southern Africa, in this paper we focus on the
linkages between mineral resources and the geology of the subcontinent. We also aim to show that the
opportunities that have been and can still be derived from the country’s geological resources are an en-
dowment from which all South Africans can and should benefit.

       South Africa’s geological endowment transcends the mineral resources
       industry.

   This report aims to provide a synoptic view of this critically important aspect of the country’s econo-
my and how it links into all aspects of our living environment both as a country and a nation. To address
the opportunities derived from the geology holistically, we begin at the bottom, with the physical foun-
dations of the country: the rock mass. We then build on this, showing how the land surface has revealed
the rock mass and how the climate and environment have interplayed with the physical foundations of
the country, long-standing processes which gave rise to the natural order and eventually human life.
Finally, we discuss how this earth-life paradigm provides opportunities for resource development and
environmental sustainability for South Africa and its people.

2.0     SUBCONTINENTAL ROCK MASS
The crustal evolution of the southern African continent provides the architecture for the country’s geo-
logical endowment. This geological evolution of South Africa hosts approximately 3.6 billion years of
Earth history preserved in the rock record, some parts of it continuous and representing an unbroken
geological record of over 600 million years of deposition and rock formation (Transvaal Supergroup)
(Fig. 1).
    Periods of tectonic quiescence coupled with large-scale tectonism (folding and faulting), igneous
intrusions (Cape Granite, Sea Point and Bushveld Igneous Complex) and volcanic activity (Stormberg
– Drakensburg – Basalts) and deposition of sediments into huge basins (‘Wits’, Transvaal, Waterberg,
Cape and Karoo) took place. These, combined with periods of burial and then uplift to surface, have pro-

4            IRR POLICY PAPER, JUNE 2018
vided a uniquely concentrated bit of geological real estate which influences property development, min-
ing, groundwater, tourism and practices in engineering of the built environment, and natural sciences.
Fig. 1 : A Summary of the Geological History of South Africa (after McCarthy and Rubidge, 2005)


    Like other terranes around the world, the long geological record preserved in South Africa (over 3
billion years) is a significant but still small part of the history of the universe (Table 1). This expands on
the events shown in Fig. 1, elaborating on key events, which is critical background for their derivative
economic opportunities.

            Table 1: Summary of the of Timeline for the Universe and the Geological
                    Architecture of South Africa (after McCarthy & Rubidge, 2001)
Period                        Event

15 billion years ago          The Universe forms
13.7 billion years ago        The Big Bang
10 billion years ago          Light elements form
4,67 billion years ago        Earth begins formation
3.5 billion years ago         Free water on earth
3.2 – 3.1 billion years ago   Formation of the centre piece of the subcontinent’s tectonic plate. This comprises the granite family of
                              rocks.
2.9 billion years ago         The Witwatersrand Supergroup was deposited as sand and small pebbles in braided river systems,
                              accompanied by gold and uranium particles, to form the gold reefs which were discovered in 1886 at
                              Langlaagte, 5km west of the Johannesburg city centre. When deposition ended, over 5km of strata were
                              laid down, including volcanic-units which sealed the gold.
2.6 billion years ago         Formation of over 1km thick package of dolomite rock, plus iron and manganese (Northern Cape).
                              Dolomite extends over large areas of the Highveld, and blankets large areas of the Witwatersrand
                              Supergroup.
2.2 billion years ago         Formation of Pretoria Supergroup of Rocks, including Magaliesberg quartzites

WHAT OPPORTUNITIES DOES SOUTH AFRICA’S GEOLOGICAL                                                                                   5
ENDOWMENT OFFER FOR THE COUNTRY’S FUTURE?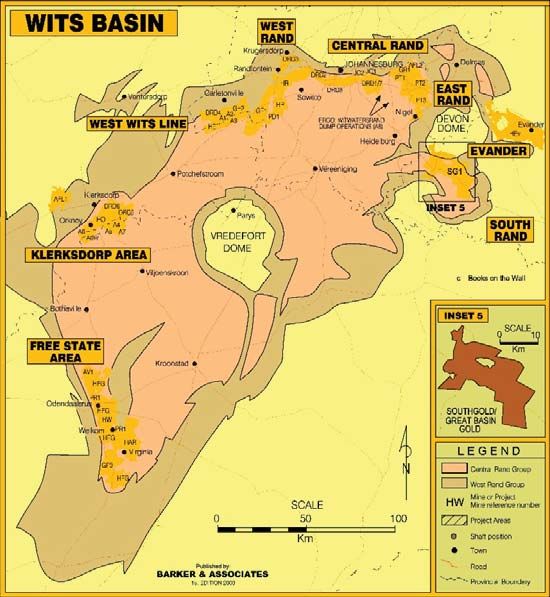
Table 1: Summary of the of Timeline for the Universe and the Geological
                   Architecture of South Africa (after McCarthy & Rubidge, 2001)
Period                     Event

2.061 million years ago    Intrusion of the Bushveld Igneous Complex and associated platinum group metals, chrome,
                           vanadium and refractory minerals
2.04 billion years ago     Intrusion of Phalaborwa complex, world’s second largest reserve of vermiculite. By this time, the
                           atmosphere was fully oxygenated allowing the formation of the first ‘red beds’ in the sediments
                           being deposited (Soutpansberg and Waterberg Supergroups).
500 to 300 million years   Formation of Gondwana, the southern part of supercontinent Pangea. Antarctica and Southern
ago                        Africa were compressed, and the Cape Fold Mountain Belt was created.
310 to 251 million years   Sediments were deposited in a basin behind the Cape Fold Belt. The environment changed from deep
ago                        sea to riverine to swamp-like as the basin filled with sediments which would solidify into the Karoo
                           Supergroup of rocks. The country’s coal reserves begin to form. This sequence represents about 70% of
                           South Africa’s geology which is exposed at surface.
182 to 90 million years    Lava poured out over the land heralding the break-up of Gondwana. Sediments and organic material
ago                        filled into the newly formed ocean basins where the continent pulled apart. The matured ocean basins
                           now form the present day Cape coast in Western and Eastern Cape.
3.3 to 20 million years    Sterkfontein caves comprising strata including dolomite begin to form. Dolomite dissolves very slowly
ago                        in rainwater forming cavities and eventually caves.

   The break-up of the Gondwana supercontinent with South Africa being ‘left behind’ resulted in sig-
nificant folding and mountain building along the southern coastline of SA (Fig. 2), and enormous out-
pouring of lava, preserved along the eastern and south-eastern margin of the country as the Drakensburg
mountains. The geological remnants of this period provide both a scenically spectacular geological play-
ground for sport (mountaineering, camping, cycling and even skiing), photography, and near-perfect
and conditions for viticulture and other important crops (apples, cherries). Elsewhere along the 2500km
‘escarpment’ between the Orange River mouth and the highlands of Mpumalanga innumerable similar
opportunities exist.
Fig. 2: The landscape of Southern Africa. The black dotted line demarcates the Great Escarpment.


6              IRR POLICY PAPER, JUNE 2018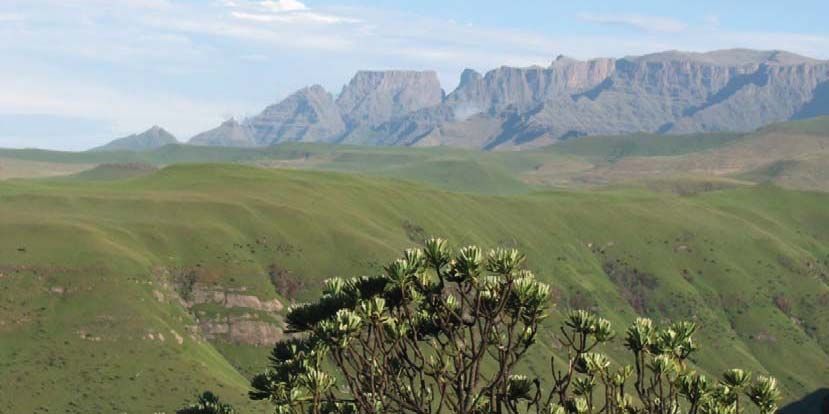
Our geology, shaped through the forces of time, tectonics and climate into the present-day landscape,
continues to provide not only a near infinite source of opportunities for earth science such as archaeology,
palaeontology, and palaeobotany, but also for engineering, agriculture, sport and recreation. In terms of
the latter, our well-exposed geological landscape provides a vast array of opportunities for hands-on
exposure to geology and all life forms that rely on it (Fig. 3).
Fig. 3: Geology in Education and Tourism and the Foundation for our Development

   Realising these particular opportunities, of course, hinges on funding, political will and intellectual
curiosity and interest in the past, present and future of the land we inhabit.
   These opportunities may only be superseded by those derived from the superlative metal and mineral
deposits, some of which are of the largest or highest grade of their kind in the world.
    The fortuitous geologic and tectonic history of the country has resulted in the creation and relatively
good preservation both at and under the surface of numerous mineral deposits (more than 80) most nota-
bly, gold, platinum, chromium, vanadium, iron and manganese, coal and diamonds and a host of others
listed in Table 2, which will continue to meet the appetite for mining and beneficiation of minerals in
South Africa.

                        Table 2: Minerals and metals produced in South Africa
                                (modified after Banzi Geotechnics, 2018)
          Commodity                Production in SA            Commodity                Production in SA
          Aggregate                      S                         Nickel                      S
          Aluminium                      S              Coal-Based Products (SASOL)           VL
          Andalusite                     S                          Peat                      VS
          Sillimanite                    VS                  Pegmatite deposits               VS
            Kyanite                      M                         Perlite                    VS
          Antimony                       M                 Petroleum Oil and Gas               S
            Arsenic                      M                        Platinum                    VL

WHAT OPPORTUNITIES DOES SOUTH AFRICA’S GEOLOGICAL                                                          7
ENDOWMENT OFFER FOR THE COUNTRY’S FUTURE?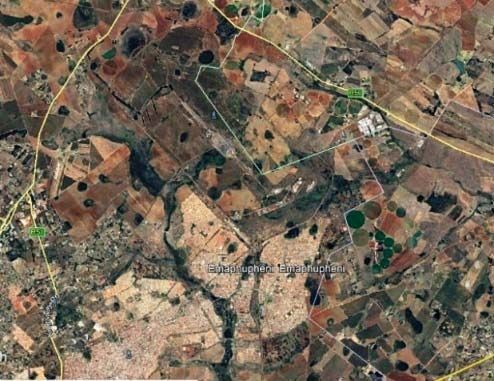
Table 2: Minerals and metals produced in South Africa
                             (modified after Banzi Geotechnics, 2018)
      Commodity                  Production in SA                       Commodity                Production in SA

       Asbestos                          NA                               Palladium                    VL
           Barite                        M                                 Rhodium                     VL
        Beryllium                        M                               Osmiridium                    VL
         Bismuth                         M                               Ruthenium                     VL
       Chromium                          VL                                 Iridium                    VL
            Clay                          S                              Phlogopite                    M
    Coal Bed Methane                     VS                               Phosphate                    M
          Cobalt                          S                                  Pyrite                    VL
          Copper                          S                          Rare Earth Elements               VS
       Corundum                           S                          River sand & gravel                S
        Diamonds                         VL                                    Salt                     S
     Dimension stone                      S                             Sand (Quarry)                   S
         Dolomite                        VL                                  Silicon                    S
         Feldspar                         S                                   Silica                   M
        Fluorspar                        M                                   Silver                     S
          Garnet                         M                                    Soda                      S
       Gemstones                         M                                  Sulphur                     S
           Gold                          VL                                    Talc                    VS
         Graphite                        M                               Pyrophyllite                  M
         Gypsum                          M                                 Tantalum                    VS
          Helium                         VS                                Niobium                     VS
            Iron                         VL                                Thorium                     VS
        Kieselguhr                       VS                                    Tin                      S
           Lead                          VL                                Titanium                     S
        Limestone                         S                                Tungsten                    VS
         Lithium                          S                                Uranium                     VL
        Magnesite                         S                               Vanadium                     VL
       Manganese                          S                              Vermiculite                    S
         Mercury                         VS                              Wollastonite                  VS
           Mica                          VL                            Zeolite minerals                VS
      Mineral sands                      VL                                   Zinc                     M
      Molybdenum                         M                                Zirconium                    VS
                                                                            Hafnium                    VS

                                           KEY TO SYMBOLS
                                 V Large Significant                         VL

                                     Significant                              S

                                        Minor                                 M

                               V Small to Negligible                         VS

                        Note: This Table indicates the importance of minerals in SA. The
                        production importance is estimated (effectively notional). The list of
                        minerals is as provided by the Department of Mineral Resources in
                        prospecting applications.

8        IRR POLICY PAPER, JUNE 2018
3.0 THE PHYSIOGRAPHY OF SOUTHERN AFRICA
3.1 Landscape
Geological diversity in a landscape, which is both visually and physically accessible for exploitation, is
very dependent on the geomorphological evolution of the land surface. In southern Africa this change
of landscape has been a driver of the exploitation of this resource; the rock climber, exploration geolo-
gist, township developer and tourist favour well-exposed outcrop versus the miner who develops the
minerals preserved below surface, or the gems (diamonds) carried a long way from their source and now
buried in sediment far downstream.
Over the last 65My of its existence, the southern African land mass has been subjected to several
phases of uplift, tilting, erosion and deposition. These actions have created the distinctive landforms we
see today.
3.2 Physiographic Regions
South Africa’s continental land surface is asymmetrical with a sharp rise to over 3000m in places along
the eastern part of the Great Escarpment from where it gradually wanes to the Atlantic coast in the west.
This is due to over 1000m of uplift which commenced some 24 000 years ago along the east and south
east coast. The Great Escarpment separates the coastal margin from the rest of the country.
Over the last 65My of its existence, the southern African land mass has been
subjected to several phases of uplift, tilting, erosion and deposition. These
actions have created the distinctive landforms we see today.
There is an interplay between geology and climate in how the landscape weathers to expose or hide
rock strata from view. This process allows for the definition of distinctive physiographic regions based
largely on elevation but also with climatic implications. As such, twenty two such regions are recognised
in South Africa, and are so defined on elevation above sea level and surface form (landscape) (Fig. 4
& Table 3).
These can be broadly consolidated into two regions using the crest of the Great Escarpment as the
dividing line (Fig. 3).
The Great Escarpment is not regarded as a physiographic region. The individual physiographic re-
gions (Table 3) reflect the changing topography and the diversity of the country’s vegetation types.
The Upper Karoo and the Highveld together cover most of the interior of the country, while the
southern Kalahari spans a large section of the Northern Cape.
The Lowveld (Region. 14) and the Coastal Belt (Region 22) fringe the country, both with unique and
distinctive climates, vegetation, scenic splendour and geology.
WHAT OPPORTUNITIES DOES SOUTH AFRICA’S GEOLOGICAL 9
ENDOWMENT OFFER FOR THE COUNTRY’S FUTURE?Fig. 4: Physiographic Regions of South Africa
(Source: Reader's Digest Illustrated Atlas of Southern Africa, 1994)
The inland plateau of South Africa at subcontinental scale is divided into a northern region (2, 7, 8,
9, 10 & 11) and a southern region (1).
The Northern Plateau Region is punctuated in the north by ridges of ancient mountain ranges of the
Witwatersrand, Magaliesberg, Olifantshoek, Transvaal, Waterberg, Soutpansberg and Basement Gra-
nitic rock sequences. The landscapes defined by these features have had a great, if not vital influence on
human settlement and migration as well as urban and mining-related development.
The inland plateau of South Africa at subcontinental scale is divided into a
northern region and a southern region.
Whereas ancient Iron Age settlements are recorded along our ridges dating from about 500 years BC
to 1850, it was only from the mid-19th Century that large mining projects began and evolved into the
20th Century at Kimberley (Diamonds, 1871), Johannesburg (Gold, 1886), Witbank/eMalahleni (Coal,
1890) and Rustenburg (Chrome, 1921 and Platinum, 1940). Though platinum was first discovered in
1880 at Sheba’s Ridge it was first mined near Mookgophong/Naaboomspruit only in 1923. The high
grade platinum group metal-rich Merensky Reef, discovered near Steelpoort in 1924 (Barker’s Platinum
Map of Southern Africa Ed2, 2004) is now mined along a strike length of 550km from Zebediela near
Mokopane to Steelpoort and Lydenburg and then westwards past Pretoria, Rustenburg, Pilanesberg and
north to Thabazimbi.
In all these cases the serendipitous combination of geology and topography with thin or no recent
quaternary cover (60My and younger) contributed to the discovery of the minerals associated with each
city.
The Southern Plateau Region is dominated by the Karoo rocks (Fig. 5). This massive basin com-
mences in the north along a line south of Johannesburg, largely defined by the southward erosional
10 IRR POLICY PAPER, JUNE 2018progression of the Vaal River off the Highveld. The line extends east, west and south to the Great Escarp-
ment (Fig. 2 & 3). Famously flat, disturbed only by flat-topped mesas and buttes, the region provides
a large range of economic activities and a variety of resources. Uniquely, the flat but high-lying Karoo
landscape has proved advantageous.
The Southern Kalahari (Fig. 4 and 5, Table 3), extending into Namibia and Botswana and as far as
the Democratic Republic of the Congo (DRC), covers an area of 2.5 million km2, and also represents an
even more level surface than the Karoo, mostly north of the South African border.
Table 3: Physiographic Regions of South Africa (after Reader's Digest
Illustrated Atlas of Southern Africa, 1994)
Region 1 Upper Karoo: Typically flat scrubland.
Region 2 Highveld: Karoo sediments and dolerite sills which extend from Gauteng east into Mpumalanga.
Region 3 Ghaap Plateau.
Region 4 Southern Kalahari: Camelthorn trees thrive in the sun-baked ochre sands of this region.
Region 5 Bushmanland: Typical of the rocky terrain in the Augrabies National Park in the North Western Cape.
Region 6 Namaqualand Highlands: Granite gneisses form the rock below windblown sands and colluvium, home
to the Namaqua daisy, a major annual tourist attraction.
Region 7 Bushveld Basin: Thorn trees, savannah and bush characterise this Limpopo Province Region.
Region 8 Bankeveld: Typically broad plateaus, fringed with foliage.
Region 9 Polokwane Plateau: Typically granitic rocks lie below quartzite-capped mountains towering over
grassland.
Region 10 Waterberg Plateau: Rugged, mountainous landscapes characterise this region.
Region 11 Soutpansberg: Red, quartzitic sandstone-capped ridges form a rugged mountainland rising from the
Polokwane Plateau.
Region 12 Lesotho Highlands: Tranquil streams and rivers of this region typically traverse basalt ridges and high
peaks.
Region 13 Lebombo Uplands: This narrow region embraces the imposing Lebombo Mountains.
Region 14 Lowveld: Vegetation here consists mainly of dry woodlands, thornbush and grassland.
Region 15 Middleveld: Dense forests cover the undulating Middlevel.
Region 16 Eastern Midlands: Erosion has cut deep swathes through this Transkei landscape.
Region 17 Winterberg Uplands: Mountains of the Eastern Cape of the kind traversed by the the Katberg Pass.
Region 18 Great Karoo: A sparse environment.
Region 19 Doring Karoo: Scrubland in the south western Cape.
Region 20 Cape Folded Mountains: Barren peaks typified by the Swartberg range.
Region 21 Little Karoo: The rugged Little Karoo is surrounded by the Cape Folded Mountains.
Region 22 Coastal Belt: The country's marine boundary with the Atlantic and Indian Oceans.
The coastal shelf, extending into the ocean from the coastal margin, is relatively shallow and con-
tains four major offshore sedimentary basins (Orange, Outeniqua, Durban and Zululand basins) which
formed during the break-up of Gondwana, when South America, Antarctica, and Australia pulled away
from southern Africa. The undersea basins filled up with organic matter eroded from the land surface.
WHAT OPPORTUNITIES DOES SOUTH AFRICA’S GEOLOGICAL 11
ENDOWMENT OFFER FOR THE COUNTRY’S FUTURE?Fig. 5: The Great Karoo Basin and the Inland Plateau of South Africa
(Petroleum Agency of South Africa, 2014)
Some basins may contain oil and gas reserves due to the maturation over tens of millions of years of
the organic matter (Selley and van der Spuy, 2016). PetroSA has a refinery plant in Mossel Bay (Out-
eniqua Basin) which condenses gas transported to that plant from various producing zones around the
basin.
3.3 Climate
Climate plays a critical role in the process of erosion and the consequent exposure of rocks. As dis-
cussed above, the interplay of uplift and climate (temperature, humidity and rainfall) produces the vari-
ety of geologically-linked landforms we see as we travel the country.
Fig. 6 View over the Great Escarpment into Lesotho. ‘Littleberg’ in foreground with deeply
weathered mantle of residual soils on Basalt underlain by Sandstone (Barker, 2012)
12 IRR POLICY PAPER, JUNE 2018In humid areas with high relief (the Drakensberg in KwaZulu-Natal and in Cape Town (Kloof Nek Road), both physical and chemical processes hold sway, while in the dry and desert areas of the western parts of the country, physical processes dominate to erode and redeposit the weathered products. Decomposition is caused by chemical action on the rock and leads to the formation of residual soil which is able to carry vegetation (Fig. 5), while disintegration is the mere physical breakdown of a rock and results in gravel (Fig. 6). A clear distinction is drawn between disintegration and decomposition as the two forms of weather- ing in rocks due to the influence of the atmosphere, and to a lesser degree, the hydrosphere (Fig. 8). Here, an algorithm designed by H. H Weinert at the CSIR provides a guideline for the separation of these two weathering processes, where his ‘N’ value is less than 5. This has a profound influence on the products of weathering and thus the environment, land use and engineering applications in terms of mining and construction. Fig. 7 Physical weathering of granitic rocks near Springbok Northern Cape with thick talus at base of slope supporting dense hardy vegetation (Barker, 2017) WHAT OPPORTUNITIES DOES SOUTH AFRICA’S GEOLOGICAL 13 ENDOWMENT OFFER FOR THE COUNTRY’S FUTURE?
Fig. 8: Climatic Macro Division of South Africa, N> 5 meaning landforms mostly physically
   disintegrated, N
Fig. 9 (Left) The Tugela-Vaal Transfer Scheme. (Right) The water management areas of
   South Africa. The Vaal is supplied by the Tugela-Vaal Transfer Scheme.

   The Tugela-Vaal Transfer Scheme and Lesotho Highlands Water Project (Fig. 9 left) supply water to
the Vaal catchment (Fig. 9 right). The Drakensburg Pumped Storage Scheme, completed in 1981, also
contributes electricity to the national grid through hydroelectric generation as water passes through tur-
bines at four dams down the escarpment. Most significantly, water is imported from Lesotho after being
collected in the Katse Dam, and piped through to Johannesburg and the entire Vaal catchment.
    This schematic map of the water scheme in the Lesotho Highlands demonstrates the Highveld’s
reliance on Lesotho’s water supply. The Lesotho Highlands Water Project is directly influenced by the
geology of the country; the watershed separating the Tugela catchment from the Vaal and Orange catch-
ments is defined by the Drakensburg mountain range.
    With climate change set to bring about more extreme events in sporadic cloud bursts of precipitation,
it remains to be seen if the infrastructure in the Highlands Water Project and local water pipelines can
withstand higher water flux. ‘Possible impacts on water supply and demand in cities under climate
change has been assessed in a few studies, ranging from semi-quantitative to quantitative. In most cases,
the spread of precipitation projections, coupled with high natural variability of precipitation, lead to
considerable uncertainties in the potential climate impacts on water in cities’ (Ziervogel, et al., 2014 and
references therein).
   By 2014, national government had developed a National Climate Change Response White Paper, but
had not yet translated it into policy that mainstreams adaptation in everyday practice and longer-term
planning in government (Ziervogel, et al., 2014, and references therein).

3.5     Surface Water
Surface water is derived from rainfall which does not seep into the ground but moves across the land
surface under the influence of gravity and its own momentum.
    South Africa’s mountainous terrains, seasonally met with rainfall from cold fronts (south Cape coast),
or subtropical low pressure regimes (Highveld and Lowveld), provide the setting for the channelling and
distribution of rainwater towards lakes, dams and pans.

WHAT OPPORTUNITIES DOES SOUTH AFRICA’S GEOLOGICAL                                                       15
ENDOWMENT OFFER FOR THE COUNTRY’S FUTURE?
3.6 Natural Lakes
Lake Fundudzi in Vendaland was formed from a landslide.
It may be one of the only natural dams in South Africa formed in this manner. The date of its forma-
tion due to the landslide is not known. The lake is sacred to the Venda People.
Fig. 10 Lake Fundudzi in Vendaland was formed by a landslide from the N ridge of the Mutale River.
/DQGVOLGH
Lake Fundudzi, Vendaland, Limpopo
/DNH)XQG]L9HQGDODQG/LPSRSR
Province, South Africa
3URYLQFH6RXWK$IULFD
3.7 Dams
There are 180 man-made dams in South Africa with a total holding capacity of about 33 billion m3. The
geological settings are variable as are the designs and methods of construction.
3.8 Pans
Pans are widespread in the Mpumalanga Highveld near Lake Chrissie and Carolina and in the panveld
of the Northern Cape. There are also numerous pans around the gold mines on the East Rand (Fig. 12)
as well as many other places, including Mpumalanga and the Northern Cape.
Fig. 11 Pans typically occur as round or round-edged closed water bodies
16 IRR POLICY PAPER, JUNE 20183.9 Derivative Opportunities
The landscape of South Africa, shaped by climate and the non-uniform weathering of the underlying
geology provides a wide range of opportunities to the country. These include opportunities for geo- and
bio-tourism and, uniquely, a perfect setting for the development of astronomy to bolster the country's
international publication rankings.
3.9.1 Tourism
In his 2018 State of the Nation Address, President Cyril Ramaphosa was emphatic about the potential of
tourism in South Africa, a large proportion of which is geo-tourism. The diversity in landscapes across
the country offers opportunities for many tastes, from desert safaris to forest and vineyard trails, from
tropical beaching to mountain skiing.
In 2017, South Africa welcomed 10.3 million foreign tourists (visitors who stayed overnight), which
is only 2,4% greater than 2016’s number. This is not competitive with the global average increase of 7%
for international visitors (StatsSA, 2017).
If tourism is to be a driver of economic growth, there needs to be at least a twofold growth in visi-
tors numbers, changes to tourism visa regulations, especially with respect to children visitors, and better
marketing of the geo-heritage of South Africa.
The landscape of South Africa, provides a wide range of opportunities to the
country. These include opportunities for geo-and bio-tourism and, uniquely,
a perfect setting for the development of astronomy to bolster the country's
international publication rankings.
3.9.2 Astronomy
The flat landscape of the Northern Cape Karoo, the general seismic quiescence there, as well as its dry
climate and clear sky, provide pristine conditions for the construction and use of various astronomical
instruments. The SALT telescope – a collaboration among a consortium of international partners from
South Africa, the United States, Germany, Poland, India, the United Kingdom and New Zealand – is
the largest optical telescope in the Southern Hemisphere and seeks to image phenomena deep into the
visible universe.
It provides year-round opportunities for astronomers and specialised technicians to collect data from
and service the instrument. Publications derived from analyses there are frequently updated online. Sci-
entists stationed at SALT made a significant contribution to the field of astronomy in late 2015. SALT
was the third observatory in the world to provide spectrum changes in that area of the universe following
the collision of two neutron stars. This collision produced the first ever detection of a gravity wave by
the LIGO observatory in the United States. Moreover, SALT provided the first dataset of visible light
changes in the universe that testified to this cataclysmic event (Potter and Vaisanen, 2017).
The Square Kilometre Array is another opportunity in science and innovation which was jointly
won by South Africa and Australia. Both South Africa and Australia are favourable geologically and
climatically to host the radio telescopes which will produce the highest resolution images in the field
of astronomy. This project will see the construction of a matrix of very sensitive radio telescopes in the
Karoo and deep outback of Australia, to make the world’s most sensitive radio telescope at 100 times the
capacity of current radio telescopes. This project requires, among other phases, a foundation investiga-
WHAT OPPORTUNITIES DOES SOUTH AFRICA’S GEOLOGICAL 17
ENDOWMENT OFFER FOR THE COUNTRY’S FUTURE?tion phase which involves the study of the subsurface soil and rock to determine suitable civil engineer-
ing solutions to steady the telescopes.
MeerKAT is the South African-funded contingent of the radio telescope array, and will eventually
consist of 64 receptors. When all 64 radio telescopes are operational, the questions answered by data
collected from SALT and the SKA may put South Africa in equal standing with other international
institutes which study the origins of the universe (DST, 2016).
4.0 ROCK-LINKED RESOURCES
This section discusses the rock-related raw materials present and relatively accessible in the southern
African crust. The derivative opportunities from these materials are posed for each category of rock-
linked resources.
4.1 Water
4.1.1 Groundwater
Groundwater is defined as water that collects or flows beneath the Earth's surface, filling the porous
spaces in soil, sediment, and rocks. Groundwater originates from rain and from melting snow and ice
and is the source of water for aquifers, springs, and wells. The upper surface of groundwater is the water
table.
Fig. 12: Aquifer classification map (after Matoti et al, 1999)
An aquifer hosts the groundwater in fractures (secondary aquifers) or in permeable and porous gran-
ular rocks (sandstone or weathered igneous or hypabyssal rock e.g. granite/norite/gabbro/diabase/dol-
erite) or unconsolidated sand, silt, clay and gravel, respectively (primary aquifers). About one quarter
of South Africa is host to major aquifers, with the majority of the country underlain by minor aquifers .
‘Shallow, weathered and/or fractured-rock and relatively low-yielding aquifer systems are underlain
over 80 percent of South Africa. By contrast, appreciable quantities of groundwater can be abstracted at
relatively high rates from dolomitic and quartzitic aquifer systems located in the northern and southern
18 IRR POLICY PAPER, JUNE 2018parts of the country respectively, as well as from a number of primary aquifers situated along the coast-
line’ (Pavelic, et al. 2012, pg 179)
a. Surface Water
The effect of mining and other industrial practices on surface water is a critical issue for water supply
in South Africa. In March 2017, the Water Research Commission in association with Golder Associates,
launched a sophisticated analysis of mine water in South Africa (South African Mine Water Atlas). This
atlas details the effect of mine water on surface and groundwater in a series of risk maps over large por-
tions of South Africa. The reader is referred to this publication for detail of risk in each catchment area.
What is important is that the atlas connects geology, mineral resources and groundwater. It is a landmark
publication.
Fig. 13: In the East Rand of Gauteng, tailings dams related to old gold mining (light shapes) are in
close proximity to pans (round, dark shapes) and river courses, as well as residential areas.
Mine water in particular was classically pumped into depressions close to the mines on the Witwa-
tersrand (Randfontein to Springs). The Boksburg Lake system occurs close to the old gold mines on the
East Rand, and is fed by runoff from the suburbs and streams in the areas that surround the old mines.
This system, including the Germiston Lake, are centres for aquatic sports today. For many years they
were famous for flocks of flamingos which seem to have disappeared. This may be due to contaminated
water and increasing salts and acid from infiltration of groundwater into the lake system. Environmen-
tally hazardous conditions occur in proximity to natural pans and tailings dumps in the East Rand of
Gauteng.
4.1.2 Opportunity derived from Acid Mine Drainage
Acid mine drainage (AMD) is a significant problem affecting groundwater in gold mines. Where mines
are no longer operating, the water is not being pumped out, and is accumulating rapidly to the point
that in places it is threatening to decant (Crown Mines). The chemical reaction which creates corrosive
low-pH water involves the interaction of deep-flowing groundwater with ore minerals in the wall rocks
WHAT OPPORTUNITIES DOES SOUTH AFRICA’S GEOLOGICAL 19
ENDOWMENT OFFER FOR THE COUNTRY’S FUTURE?of gold mines under oxygenated conditions. This reaction also occurs in surface tailings dams from
gold, coal, and copper mines, when rainwater interacts with the fine particles of ground minerals. The
products of this reaction are an acidic compound in solution as well as heavy metal solid particles in
suspension in water. Both the acid and solid metal particles are toxic.
The responsibility for dewatering the voids in gold mines remains a grey area, a legacy issue from
historical negligence, and ownership changes without environmental regulations being met before sale
or after mine closure. The high degree of interconnectivity of the Witwatersrand gold mines means that
if one mine is not operating and dewatering is not taking place, the water overflows into adjacent mines
and accelerates the AMD process.
A worst case scenario occurred in 2002 when a West Rand mine (Roodepoort) overflowed to surface
and began decanting acid mine water into the Crocodile River, on which many farmers are reliant for
irrigation, and then into the Cradle of Humankind (Council for Geoscience, 2010).
The Department of Water and Sanitation has responded positively in the last decade to assist mining
companies with two water treatment plants, one operating in Germiston for treating water pumped out
of the Central Gold basin‚ and the other operating in Krugersdorp, for treating water pumped out of the
Western Basin. The Eastern Basin Acid Mine Drainage Treatment plant is the largest in the world and
was opened in February 2017. It can process 110 mega litres of water a day, and directs the treated water
back to the Vaal River system along which wetlands will also be fed (Mzamo, 2017).
Mine dewatering may also open opportunities to engineering works if mines
seek to be re-opened again.
The CSIR is developing nanoclay to address the issue of energy-intensive AMD-water processing
plants and has a patent pending on this technology. The nanotechnology also has the potential to
concentrate the heavy metals generated by the AMD reaction, which would then be sold (Kilian, 2018).
Treated AMD water is suitable for industrial use, as seen in gold tailings reprocessing operations
where there is substantial use of treated AMD water. Treated water, however, is not suitable for agri-
culture. Further purification is required. The opportunity of treated mine water lies in perfecting the
purification process to restore the water quality to potable standard, which would create a near water-
neutral mining sector. Water treatment is a large business opportunity for service providers to the mining
industry and the water management authorities.
Mine dewatering may also open opportunities to engineering works if mines seek to be re-opened
again. Currently, mines across the Wits Basin are dewatered to a designated critical level via pumping of
that water to the treatment plants (Coetzee, 2016). A re-opening of old flooded gold mines will depend
on the gold price and technology which can access more complex and deep zones (2000-4000m depth
below surface or bs) of old mines, lower grade areas, and targets at greater depths(+4000m bs) and even
work under water with amphibious mining supported by artificial intelligence.
4.2 Minerals
The mineral wealth of the country evokes much pride in South African citizens. The minerals industry
has been battered by decreasing and flat commodity prices (coal, platinum and gold respectively), dan-
gerous working conditions (gold) and a reduction in exposure of large multinationals to the SA market
(e.g. Rio Tinto and BHP Billiton) (coal, base metals). Added to this, regulatory issues such as slow
turnaround time in the processing of prospecting rights by the Department of Mineral Resources, are just
some of the negative issues that have plagued the industry for the past 14 years.
In this section a synopsis is presented of examples of how South Africans, where applicable, could
derive benefits from a selected group of minerals and their mining styles.
20 IRR POLICY PAPER, JUNE 20184.3 Metallic
4.3.1 Precious Metals
4.3.1.1 Gold
The Witwatersrand Supergroup of rocks formed in the ancient Wits Basin hosts the world’s largest
known resource of gold, and the third largest proven reserves in the world (Chamber of Mines, 2016).
Gold (including uranium) is extracted from predominantly underground mines. The 5 to 7km thick
sequence of sediment and gold particles was deposited in vast sedimentary basins fed by braided river
systems [Fig. 6]. A major outpouring of lava across the basin sealed the sediments and their minerals
in conglomerate reefs. This protection from Earth’s atmosphere as well as from direct contact with rain
water preserved the ore minerals for approximately 3 billion years until humans discovered the reefs in
1886 and learnt how to exploit the resource.
The Witwatersrand goldfields have supplied 50% of all gold ever mined. Significantly, it is estimated
that there is more gold left unmined today than was extracted over the goldfields' 132-year history. These
resources lie at a great depth of over 3000m below surface and are the subject of ongoing advanced re-
search as to how they can be extracted economically and safely, as suggested above.
Working conditions in these gold mines are generally characterised by hard, abrasive quartzitic rock,
steep gradients and seismicity due to the release of stress in the rock mass due to mining (opening of
voids). With the increasing depth of mining, temperatures continue to rise. Virgin rock temperature at
depths of 2 000m below surface can be as high as 40ºC. This requires substantial energy for refrigeration
and ventilation. In 2016, South Africa contributed only 4.4% to global gold production, continuing a
steady trend of declining production due to increased depth of mining, increased travel time to stopes,
and dwindling gold grades with ever more material to move (Chamber of Mines, 2010).
Fig. 14: Top left: The Witwatersrand Basin (red), Bushveld Igneous Complex (light green),
and Barberton, Murchison and Giyani greenstone belts (bright green). Bottom left:
A Conceptual Model of how ‘Wits’ gold-bearing reefs formed. Right: The eight gold
basins of the Witwatersrand Basin (Source: Barker and Associates, 2003)
WHAT OPPORTUNITIES DOES SOUTH AFRICA’S GEOLOGICAL 21
ENDOWMENT OFFER FOR THE COUNTRY’S FUTURE?4.3.2 Platinum
The Bushveld Igneous Complex intruded into the crust approximately 2 billion years ago, and segre-
gated into various igneous layers containing platinum group elements, chrome, vanadium and refractory
minerals and magnetite. It hosts more than half of the world’s platinum group elements. The platinum
mines have produced more than 75% of the world’s platinum output.
Fig. 15: The Bushveld Complex of South Africa (Books on the Wall Publishing, 2011). The
contact between the dark green and light green layers marks PGE-bearing horizons.
The Complex has two prominent eastern and western lobes, and two less prominent but no less valu-
able lobes in Limpopo and Mpumalanga, with a third small unit lying west of the northern limb, the Villa
Nora complex. The deposit is saucer-shaped, the inward tilt of the strata having a significant influence
on the topography in the North West, Mpumalanga and Limpopo provinces. Additionally, the rock types
gabbro, norite and anorthosite are also quarried from the Complex, and are used as dimension stone
which adorns many surfaces in homes and offices.
4.3.3 Opportunities in Gold and Platinum
A critical issue facing the precious metals industry worldwide and, no less, in South Africa, is demand.
Underground working conditions is also an ongoing issue. On the Bushveld Complex, which is host
to 80% of the world’s platinum reserves, temperatures can reach 70ºC, which is 30ºC higher than gold
mines at the equivalent depth. Today, most deep-level underground mines are ageing with travel times to
the face sometimes amounting to an hour or more, impacting significantly on production. This is giving
rise to much logistical research in the industry and the Chamber of Mines Research Organisation (CSIR/
COMRO) and universities, especially in Johannesburg (Wits) and Pretoria (Tuks).
The introduction of stricter emission standards for combustion-engine motor cars is expected to at
least maintain and probably increase demand for PGMs (palladium, platinum, and rhodium), which are
used in catalytic converters.
22 IRR POLICY PAPER, JUNE 2018However, the move toward curtailing carbon emissions in developed regions, like Europe and, more
recently, China, has led to a drastic decline in the purchase of combustion-engine vehicles, which use
platinum in catalytic converters.
Significant changes in policy seek to ban production of diesel and petrol vehicles in the future:
France and the UK by 2040, and Scotland by 2032. China is conducting research into their deadline to
ban the sale and production of combustion-engine vehicles (World Economic Forum, 2017).
The rise of the battery-powered electric vehicle and its associated battery metals may dwarf the de-
mand for platinum in the near future. Most electric vehicles run on lithium-ion batteries composed of
lithium, nickel, cobalt and graphene. However, a competitor innovation to lithium-ion batteries lies in
technology used in Fuel Cell Electric Vehicles (FCEVs). South Africa’s opportunity is to provide plati-
num to this particular market which is hoped to buoy the industry. FCEVs use platinum catalysts and run
solely on hydrogen, emitting only water from the tailpipe of the vehicle.
While sales of battery-powered vehicles are set to outpace FCEVs in the short term, a long-term view
may show a different trajectory. If platinum is going to survive in South Africa, FCEVs need to prove
themselves better for the consumer than battery-powered EVs. The benefits of FCEVs over battery EVs
relate to recharge time, refilling infrastructure, and better potential for automation. The time it takes to
fill an FCEV is faster than the time required to charge a battery EV, which is a considerably attractive
factor for potential buyers who lead a fast-paced lifestyle.
If autonomous, fuel-cell vehicles can move more material around SA’s mines,
this bodes well for revenue and will free cash to plug into other innovations
and fulfilment of social and labour plans required by all major mining
companies.
Developed nations are adopting FCEV more quickly than proponents of battery vehicles may think,
and Honda, Hyundai, Toyota and Mercedes have all released their own FCEVs – a sign of the East’s
confidence in the technology. In a more industrial application, locally, Anglo American Platinum has
developed technology with Shell that can compress hydrogen into liquid. If adopted globally, this tech-
nology will strongly influence the uptake of FCEVs. The significance in this innovation is demonstrated
in this comparison: a car drives about 100 km on 1 kg of compressed hydrogen, while it drives a mere
1 km on the energy stored in 1 kg of batteries (Mining Weekly, 2018).
Anglo American Platinum will apply this new technology to its own operations in 2019 by way of
installing it into vehicles operating around mining workings. If autonomous, fuel-cell vehicles can move
more material around SA’s mines, this bodes well for revenue and will free cash to plug into other in-
novations and fulfilment of social and labour plans required by all major mining companies.
In order to innovate and increase the longevity of South Africa’s high-potential mining industry,
the new Mandela Mining Precinct in Johannesburg was opened on 4th May 2018. The Council for
Scientific and Industrial Research (CSIR) and the Chamber of Mines (CoM), in collaboration with the
newly established Mining Equipment Manufacturers of South Africa (MEMSA), have developed vital
mining research and development (R&D) programmes to be carried through the Precinct, and will guide
mining’s revival and modernisation. The first priority projects are for the gold and platinum industry,
where practices for safer working conditions and change of mining methods need urgent implementa-
tion (Creamer, 2018).
Funding averaging R100-million a year over four years is being provided by government and busi-
WHAT OPPORTUNITIES DOES SOUTH AFRICA’S GEOLOGICAL 23
ENDOWMENT OFFER FOR THE COUNTRY’S FUTURE?ness. The Department of Science and Technology (DST) has allocated R210-million from 2017/18 to
2020/21 for R&D into hard-rock, narrow-reef, metalliferous underground mining. The Chamber of
Mines has pledged R33-million for the 2018 calendar year, and the Department of Trade and Industry
has provided R8-million.
There are 34 projects on the agenda, placed at various mine sites around the country, which are fo-
cused on three main areas: modernisation of current mining operations; mechanisation using drilling
and blasting, and non-explosive rock breaking. All these initiatives aim to develop technology which is
semi-automated and which puts human operators at much lower risk. Moreover, narrower mine cuttings
are also envisioned through bespoke vehicle design.
To encompass all engineering innovations, the Precinct also aims to develop an Internet Of Things
model to create a digitised mine with real-time data updates for all operating components of a mine,
from dozers to conveyor belts and more. It is hoped that as much as 8 old gold or platinum mines can be
re-opened without investment in new infrastructure.
Lastly, property development on undermined land is another derivative opportunity from the gold
and platinum mining industries. These developments require stringent geotechnical and geological in-
vestigation, as well as verification of the mine voids below the mined area.
The depth to mined-out area has a direct influence on where property may be developed at surface,
along with level of risk that undermined ground may face from settlement due to collapse in these stopes
resulting from weathering, seismicity or artisanal mining activity (“Zamma Zammas”) in purportedly
closed mines.
In terms of zinc, South Africa has one of the largest known, undeveloped
zinc orebodies in the world.
Five mega-cities are currently planned for construction around Gauteng, one of which, Goudrand
Mega City in the Greater Springs area, will be developed on ground where mining operations ceased in
2003 (Gauteng Province, 2017).
4.4 Base Metals
4.4.1 Copper, Nickel, Zinc, Lead, Tin
Copper is widely used in power cables, electrical equipment, automobile radiators, and cooling and
refrigeration tubing. The useful metal is found in stratiform deposits in the Northern Cape, and in the
Phalaborwa Igneous Complex. Mining of or exploration for this commodity is strongly linked to its
price, since it is a bulk mineral, and since SA’s reserves are dwarfed by those of DRC and Zambia. Cop-
per production reached 116,973 tonnes in 2007. Since then there has been a steady decline and produc-
tion stood at 65,257 tonnes in 2016 (Chamber of Mines, 2017a).
Nickel is an essential metal in batteries and the emerging technology in electric vehicles. Nickel-
based alloys are also used for more demanding applications such as gas turbines and some chemical
plants e.g. desalination plants. South Africa’s primary nickel producer is Nkomati mine in Mpumalanga,
but the metal is also produced as a by-product at platinum mines on the Bushveld Igneous Complex.
Small, undeveloped tin deposits also occur at the uppermost, granitic layers of the Bushveld Igneous
Complex.
In terms of zinc, South Africa has one of the largest known, undeveloped zinc orebodies in the world.
The Gamsberg Zinc project at Black Mountain Mine in Aggeneys in the Northern Cape is nearing end-
24 IRR POLICY PAPER, JUNE 2018of-construction for exploiting this orebody. The mine will comprise an open pit mine and dedicated
processing plant. Vedanta, the owner company, is considering a refinery on site as well. The mine will
produce from Gamsberg mid-2018 (Liedtke, 2018). Zinc’s industrial uses range from alloys to paints,
rubber, cosmetics, pharmaceuticals, plastics, inks, soaps, batteries, textiles and electrical equipment.
Black Mountain Mining currently produces lead, silver and copper over and above its ambitions to
develop the zinc resource. The Northern Cape region near Aggeneys is a high prospect for zinc, lead,
copper and silver.
4.5 Heavy Metals
4.5.1 Iron, Manganese, Cobalt, Zinc, Cadmium, Mercury, Lead
South Africa’s iron ore and manganese is mined in bulk and is shipped to the Far East through Saldanha
Bay. The mines are open cast and exploit stratiform deposits which formed during the first oxidation of
Earth’s ocean and atmosphere. These deposits were later upgraded by a chemical alteration process after
initial formation. The iron ore price is strongly linked to a mine’s operation in South Africa. The iron
ore mines of the Northern Cape are still operating and make use of the Sishen-Saldanha railway line to
transport the bulk material. However, Thabazimbi Mine in North West closed in 2015 due to its old age
(80 years), and presents geotechnical hazards with steep-sided tailings dumps.
Steenkampskraal, which is situated in the Western Cape, has the highest
concentration of rare-earth elements in any deposit of its kind around the
world and has recently garnered more interest as international manufacturers
of smart devices and green technology are looking to diversify their REE
supply.
Also in the Northern Cape is the world’s largest on-land resource of manganese, of which South
Africa is the world’s top producer. This mineral, exported in bulk, improves the strength of steel. The
Kalahari Manganese field has been worked since 1927 at Wessels, N'Chwaning and Hotazel mines,
which exploit a dome-like geological structure which exposes the iron and manganese-ore horizons. The
Postmasburg Manganese field is currently being exploited and the area is promising to junior explorers.
4.5.2 Rare-Earth Minerals
This group of elements are not especially rare, are chemically similar and tend to occur together in na-
ture, which makes their physical separation difficult.
Rare-earth elements (REEs) are a major component in electric motors, and more specifically, perma-
nent magnets. The use of permanent magnets improves the torque of the vehicles. REEs are also used in
nickel metal hydride batteries, most commonly known for their use in the Toyota Prius. The oil refining
industry also makes use of REEs in components for the cracking process which involves the breaking
of molecular carbon bonds in heavy oil. Wind turbines also make use of a substantial amount – tens of
kilograms’ worth – of one particular rare-earth element.
REEs occur in many household items: in televisions and energy efficient lamps, UV lights and glass-
polishing powders, and, most significantly, smartphones.
Because rare earths are used for so many commercial applications, the US, Japan, Europe and other
countries could be vulnerable to supply disruptions since China dominates the market – supplying over
80% of the world’s rare earth elements in 2017.
WHAT OPPORTUNITIES DOES SOUTH AFRICA’S GEOLOGICAL 25
ENDOWMENT OFFER FOR THE COUNTRY’S FUTURE?You can also read