Geological interpretation based on satelite imagery: Updating geological maps of Indonesia to 1:50,000 map scale
←
→
Page content transcription
If your browser does not render page correctly, please read the page content below
Bulletin of the Geological Society of Malaysia, Volume 59, November 2013, pp. 19 – 26

      Geological interpretation based on satelite imagery: Updating
          geological maps of Indonesia to 1:50,000 map scale
                                        Jamal, Sidarto, Ipranto & Sonny Mawardi
                      Geological Agency, Ministry of Energy and Mineral Resouces Republic of Indonesia
                                    Jalan Diponegoro No 57, Bandung 40122, Indonesia

     Abstract: Indonesia is an archipelago comprising over 13,700 islands and a total territory of more than seven million
km2.. Geologically, the earth’s crust in this region displays several special features as a result of the collision of three
mega plates, Eurasia, Indiaustralia and Pacific. Inter-related features such as island arcs, volcanic belts, seismic zones,
gravity anomaly zones, and deep sea trenches resulted from the collision process.
     Knowledge of the regional geology of the entire Indonesian region was greatly advanced by the completion of
systematic geological mapping at the scale of 1: 100,000 of Jawa and Madura Islands and at the scale of 1:250,000 on
the other islands. A great quantity of data concerning various aspects of geology and geophysics, collected during more
than 50 years, has accumulated.
     The need for geological information at a larger scale, however, is now increasing. This demand is related to national
development programs as well as to Indonesia’s industrial growth. Exploration for energy, mineral and ground water
resources, the generation of information for land-use planning and geological hazard mitigation will all benefit from the
availability of geological maps at the scale of 1:50,000. Therefore, since 2010 the Geological Agency, Ministry of Energy
and Mineral Resources of Republic of Indonesia, has initiated new geological mapping project starting with geological
interpretation based on data from satellite imagery combined with existing field data.
     The methodology for geological interpretation is based on visual interpretation of remote sensing data of morpho-
structural aspects of the imagery combined with field data existing in a GIS environment. Interpretation keys were
determined in order to provide guidelines on how to recognize certain geological objects on satellite imagery. Preparation
of data including the creation of shaded relief of the digital surface model (DSM) and intensity layer of orthorectified
images (ORRI), contour generation, color composite of optical images, drainage pattern generation and fusion of passive
and active remotely-sensed images.

     Keywords: geological map, remote sensing, Indonesia

                       BACKGROUND                                  hazards such as earthquakes, landslides, volcanic activity,
     Indonesia is the largest archipelagic country in the world,   floods and tsunami are also a major concern.
which has five major islands and about 300 smaller island               The knowledge of the regional geology of the entire
groups. Altogether there are more than 13,700 islands. The         Indonesian region has been greatly advanced following
archipelago is situated at a junction between two oceans,          the completion of systematic geological mapping in 1995.
the Pacific and Indian oceans, and bridges two continents,         Much data concerning all aspects of geology and geophysics
the Asian and Australian continents. Indonesia has a total         has been acquired during more than 50 years of geological
area of 9.8 million km2, of which more than 7.9 million            mapping. From the compiled geological data, it is possible
km2 is ocean.                                                      to perceive the distribution of various kinds of rock units
     From the point of view of earth science, Indonesia has        ranging in age from Palaeozoic, through Mesozoic to
various unique geological phenomena due to its location at         Cenozoic. The rock units consist of sedimentary, carbonate,
the triple junction of three mega-plates: Eurasia, Indiaustralia   and volcanic rocks which are subdivided into broad groups
and Pacific (Figure 1). The involvement of these three             based on their ages, respectively; Quaternary, Tertiary, and
mega-plates interaction with each other, has resulted in the       Pre-Tertiary ages. In addition, based on the rock lithology
formation of double island arcs, K-shaped islands, active          and origin, some rocks are grouped into plutonic, ophiolite,
volcanic belts, active seismic zones, deep sea trenches            metamorphic and mélange rocks (Figure 2).
and the negative gravity anomalies. Morphologically this
condition has resulted in a distinct and varied relief with        DEVELOPMENT OF GEOLOGICAL INFORMATION
high mountain belts, deep valleys, and high cliffs. Moreover,           The Center for Geological Survey, one of the units
due to this complex geological history, Indonesia also has a       of the Geological Agency of the Ministry of Energy and
huge amount of geological resources including oil and gas,         Mineral Resources, continues its activities in mapping and
coal, gold, diamonds, iron, nickel and other mineral resources     research on various aspects of geology and geophysics in
such as clay and gem stones. However, the potency of geo-          the entire Indonesian region, which originally was initiated
Presented at 48th CCOP Annual Session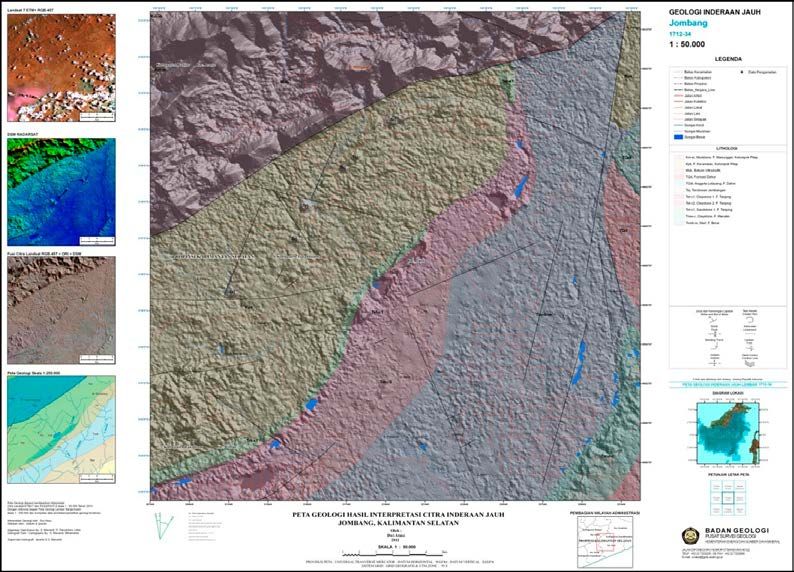
Jamal, Sidarto, Ipranto & Sonny Mawardi

in 1850 by previous research institutions. The results of the
research, investigation and mapping have become national
assets represented by all the the geological and geophysical
data which are collected in the Geological Museum and
Library within the Center for Geological Survey of the
Geological Agency that was established in 1979.
     The above activities in mapping and research of many
aspects of geology and geophysics were diversified and
reinvigorated with the commencement of the Indonesian
Five Year Development Plan in 1969. Systematic mapping
which initially was only applied to geology and geophysics,
were later been applied to construct other thematic maps,
such as seismotectonics, geomorphology, and Quaternary
geology. The research in aspects of geology and geophysics
also includes topics such as paleontology, sedimentology,
petrology, geochemistry, gravity, paleo-magnetics,
radiometric dating, rock physics, and structural geology.
     Indonesia has now succeeded in the completion of
systematic geological mapping at the scale of 1:100,000 in
Jawa and Madura Island and 1:250,000 in the islands outside
                                                                 Figure 1: Indonesian archipelago location at the triple junction
Jawa and Madura together with the 1:1,000,000 map of the
                                                                 of three mega plates, Eurasia, Indiaustralia and Pacific, modified
entire Indonesian region. Based on these systematic maps,        from Le Pichon (1968).
geological and thematic maps at the scale of 1:5,000,000
have been compiled.
     The need of geological information in Indonesia at           CURRENT KNOWLEDGE ON THE GEOLOGY OF
a larger scale is now increasing. This demand is related                                 INDONESIA
to national development programs as well to Indonesia’s               The large quantity of geological and geophysical data
industrial growth. Exploration for energy, mineral and           which are stored in the Geological Agency, Ministry of
ground water resources, information required to aid land use     Energy and Mineral Resources, is a national asset that
planning and geological hazard avoidance and mitigation          should be utilized by the broad geoscience communities,
are all issues that argue for the development of geological      domestic as well as international. Investigation, research and
maps at the scale of at least 1:50,000. In order to answer       mapping of the geology and geophysics during eight periods
this demand, the Geological Agency as an Institution that        of Indonesia’s Five-Year Development plans (1960-1999)
is responsible for geological survey, has been conducting        contributed very considerable and available data resources.
geological mapping program, which is planned to last from        Systematic geological maps at a scale of 1:100,000 for Jawa
year 2010 until 2025. This program was initiated employing       and Madura, 1:250,000 for islands outside Jawa and Madura,
geological interpretation based on satellite imagery combined    and scale 1:1,000,000 for the entire Indonesian region are
with field data collected during from previous work. Later       now available. The Geological Map of Indonesia at a scale
on, validation will be conducted with ground truth in addition   of 1:5,000,000 has also been published (GRDC, 1992).
to stratigraphic study and the collection of new field data.          The simplified geological map of Figure 2 shows the
                                                                 distribution of the geologic units on land which covers an
                                                                 area of 1,952,814 km2. The extent of each geologic unit
Table 1: The extent of geologic units on land (1,925,814 km2),
                                                                 is measured on the basis of the distribution of the unit
calculated using grid by Handoko (Sukamto, 2000).
                                                                 which appears on the Geological Map of Indonesia at scale
No.    GEOLOGICAL UNIT                       EXTENT (+ km2)
1      Quaternary sediments                  570,798             1:5,000,000 (GRDC, 1992). The extent of each geologic
2      Quaternary carbonates                 15,811              unit of Quaternary, Tertiary, Mesozoic and Paleozoic age is
3      Quaternary volcanics                  140,860             shown in Table 1; including geologic units based on their rock
4      Tertiary sediments                    474,513             association: metamorphic rocks, plutonic rocks, mélange
5      Tertiary carbonates                   119,877
6      Tertiary volcanics                    118,349
                                                                 rocks and ophiolitic rocks. This summary information
7      Tertiary-Cretaceous Sediments         98,229              about the geological units, based on the geological eras,
8      Mesozoic sediments                    99,901              is introduced here to give an insight into the potential for
9      Mesozoic carbonates                   18,344              mineral and energy resources as well for geohazards that
10     Mesozoic volcanics                    21,204              possibly may occur within each geological unit.
11     Paleozoic rocks                       45,783
12     Metamorphic rocks                     82,247
                                                                      The distribution of these various geological units may be
13     Plutonic rocks                        66,442              used in evaluating the veracity of the opinion that Indonesia
14     Melange rocks                         31,115              remains well endowed with mineral and energy resources.
15     Ophiolitic rocks                      36,970              Peat deposits, for example, have been estimated to be over

20                                                      Bulletin of the Geological Society of Malaysia, Volume 59, November 2013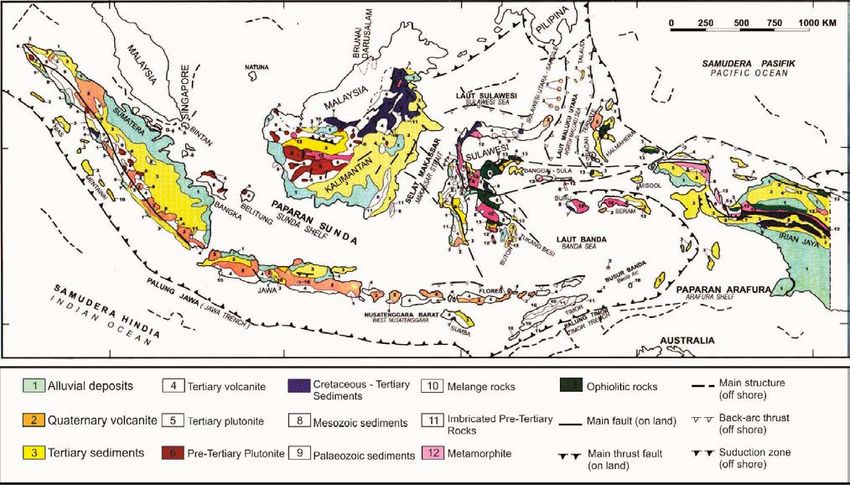
Geological   interpretation based on satelite imagery:   Updating   geological maps of Indonesia to   1:50,000   map scale

Figure 2: The geology of Indonesia simplified from the Geological Map of Indonesia, 1:5,000,000 compiled by Geological Agency
(GRDC, 1992).

2 m thick over a total area of 88,015 km2 in Sumatera,                                  RAPID MAPPING
Kalimantan and Papua (Soedradjat et al., 1991) in areas                 In order to accelerate planning and to support national
(+570,798 km2) underlain by Quaternary sedimentary rocks.          development, the Geological Agency as the institution
     Coal which originally was estimated to have a reserve         responsible for national geological survey and mapping,
of + 32.1 billion tons (Soedradjat et al., 1991), later rising     proposed a rapid mapping programme to cover Indonesia’s
to an estimated +36.34 billion tons (Suhala & Yoesoef,             entire land territory from 2010 until 2025. This programme
1995), is found in Tertiary sedimentary rocks, which have          started with geological mapping based on interpretation
an areal extent of +474,513 km2. Tertiary sedimentary              of remotely-sensed data combined with existing data in a
rocks can also be used to re-evaluate sedimentary basins           GIS environment. The programme is categorized as “rapid
that may contain hydrocarbon reserves. Quaternary, Tertiary        mapping” because the final target is to complete more than
and Mesozoic carbonate rocks as potential raw material for         3700 updated map sheets at the scale of 1:50,000 by 2015.
Portland cement and other industries are of very great extent      Thereafter, the programme will be continued by a field
(+154,032 km2 ). Limestone layers may attain thickness of          campaign as a method of verification until 2025. Geological
hundreds of meters, so that when the average thickness is          interpretation on the basis of remotely-sensed data combined
estimated at only 100 m, the limestone would have a reserve        with the large quantity of geological and geophysical data,
of at least 39.28 trillion tons (specific weight 2.55). This       which are stored in the Geological Agency can provide a
figure is much higher than the previous estimated reserve          fast and effective way to produce geological maps at the
of limestone which was only + 20 billion tons (Soedradjat          1:50,000 scale. Combination of an optical dataset (e.g.
et al., 1991).                                                     Landsat ETM, ALOS DAICHI and ASTER) and synthetic
     Various kinds of geological units of which the extent         aperture radar (e.g. IFSAR, Radarsat-2 and TerraSAR-X)
has been measured above may provide information for the            should produce data of outstanding quality for analysing
further exploration of various kinds of metallic minerals,         and extracting surface geological phenomena for geological
industrial minerals, coal and peat, petroleum and natural          interpretation maps.
gas. More intensive prospecting is still needed to explore              The earths surface is composed of various lithological
possible potential resources and this requires the detail          units which are reflected in morphological complexity
provided by geological maps at a larger scale of 1:50,000.         because of the exogenous and endogenous geological
Such information on regional geology, which covers the             processes involved. Morphological features and resultant
entire Indonesian region is an asset that can be used in           landforms can be analyzed through field campaigns and
further investigation needed for mineral and energy resource       also from remotely-sensed data. Interpretation of geological
evaluation, geohazards and land use planning decisions             features from remotely-sensed data is aimed to collect
within a fully self supporting civil society.                      geological information for further applications. There are
Bulletin of the Geological Society of Malaysia, Volume 59, November 2013                                                          21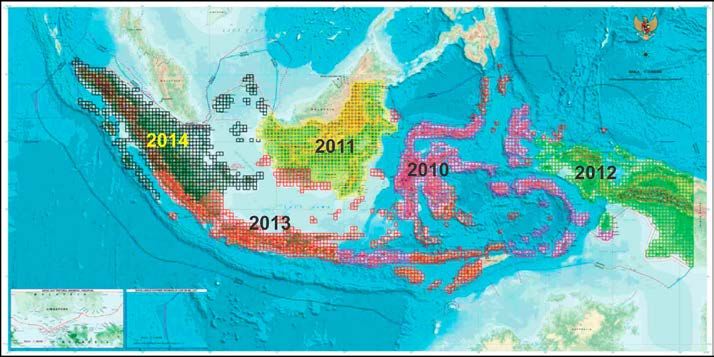
Jamal, Sidarto, Ipranto & Sonny Mawardi

some advantages of using such data as, for example, many          geological units by introducing new classes or categories
remote areas and small islands can be examined quickly            of units. Lineaments, scarps and land offsets are assigned
and without problems related to accessibility and difficult       to geological structures which are categorized as faults,
terrain. Such a rapid mapping program can therefore reduce        joints, calderas, and bedding traces.
both time and cost of obtaining detailed initial geological
information. However, the program will still need validation                      CRITERIA DATA NEEDED
in the form of a limited field campaign and the use of                 The use of remote sensing data for geological application
specific computer aided tools.                                    has been applied by the Geological Bureau in Indonesia
                                                                  since the beginning of 1960. In the beginning, the remotely-
  GEOLOGICAL AND TECHNICAL CHALLENGES                             sensed images were aerial photographs, which were analyzed
     Development of geological information at larger scales       with stereoscopes to extract information about the surface
(1:50,000) is a critical issue for the Geological Agency as       geology. Advanced technologies have led to the use of better
the institution responsible for systematic national geological    remotely sensed data leading to higher accuracy, precision
survey and mapping in Indonesia. However, resolving this          and detailed graphic and temporal resolution.
issue involves many practical challenges for the researchers           Some quality aspects regarding the remotely sensed data
including the huge area of the Indonesian territory, its          that are used during identification of geological features in
archipelagic setting, the complexity of its geology and the       the Indonesian archipelago are:
large number of remote areas involved. As mentioned above,        1. Technology must take account of the tropical climatic
rapidly acquired, remote sensed data can partly resolve some           condition in Indonesia.
of these challenges.                                              2. Sensors for data acquisition must cover optical and
     The quality of the results of image interpretation depends        altitude information.
on a number of factors: the interpreter, the image data           3. Up-to-date data acquisition and collection are of main
used, and the guidelines provided. Professional experience,            concern.
including experience of image interpretation determines the       4. Datasets are expected to be processed with the latest
skills of an image-interpreter. A background in geological             technologies in order to achieve a high quality standard
interpretation is essential in order for the interpreter to            of radiometric correction, geometric correction,
extract image features related to geological phenomena.                enhancement, filtering, fusion, and classification.
Furthermore, local knowledge, derived from field visits, is       5. Digital technology will ensure that data is easy to
required to help in the interpretation. Finally the quality of         collect, process, duplicate, interpret, analyze, and store.
interpretation guidelines are a large influence, for example             Several products that can meet acceptable quality
standards for the development of Indonesian geologic maps         standards in geological mapping applications and have been
have an important role in ensuring the replicability of work.     used by The Geological Agency are:
     Geological interpretation in a tropical terrain is often     1. LANDSAT 7 ETM+; optical satellite observation with
particularly challenging due to the dense vegetation cover in          orbital height of 705 km, temporal resolution 18 days,
heterogeneous rain forest and the thickness of weathered soil          swath 185 x 185 km, 7 bands with 30 x 30 m spatial
that renders spectral information for the rock units beneath           resolutions and 120 m thermal band resolution. Cloud
difficult to recognize. The technical challenge in geological          sensitive but having good spectral information for
interpretation was how to make the visual interpretation of            surface geological survey.
remotely-sensed data of morpho-structural aspects combine         2. ASTER – Advanced Spaceborne Thermal Emission
with field data existing in a GIS environment. Interpretation          and Reflection Radiometer; 16 bands of optical earth
keys needed to be established such as tone/hue, texture,               satellite observation with three sub system of 15 m
shape, size, pattern, site and association which provide               spatial resolution in visible near infra red (VNIR), 30 m
guidelines on how to recognize certain geological objects              in short wave infra red (SWIR), 90 m spatial resolution
on satellite imagery. Other aspects used in geological                 in thermal infra red (TIR). This sensor can run oblique
interpretation were landforms, relief, drainage pattern,               scanning to create three dimensional images or create
vegetation and land use.                                               a digital elevation model (DEM).
     The aim was to define and delineate the lithology of         3. SRTM – Shuttle Radar Topography Mission; radar
geological units and recognise geological structures that              technology with 90 m and 30 m spatial resolutions.
could be used to analyze and interpret sub-surface conditions          Sensors used are C-band and X-band with capabilities
and geological relationships. Geological sections relatively           of three dimensional representation, cloud penetration,
crossing or perpendicular to the main geometry of geological           and active sensor which could operate in day and night.
structures were made and represented at the surface by            4. IFSAR – Interferometry Synthetic Aperture Radar;
contours. Distributions of lithology in the subsurface were            an airborne radar technology with single-pass mode
interpreted from trends and steepness of slopes as seen on             of acquisition. This sensor produce digital elevation
the data images.                                                       model (DEM) and orthorectified radar image (ORRI).
     Updating geological maps to a larger scale in part                Using X-band technology with 3 cm of wavelength
focuses on further subdividing the existing mapped                     that can penetrate could, haze, dust, rain and night.
22                                                       Bulletin of the Geological Society of Malaysia, Volume 59, November 2013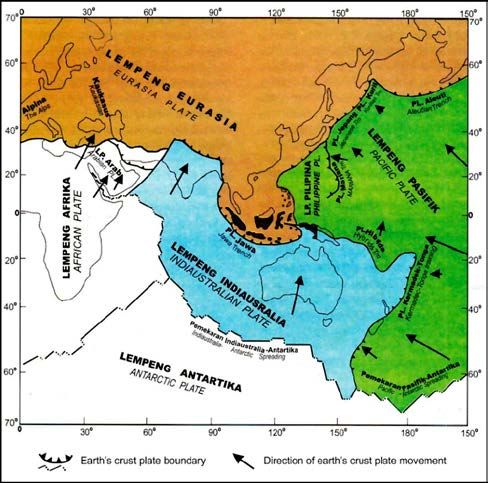
Geological   interpretation based on satelite imagery:   Updating   geological maps of Indonesia to   1:50,000   map scale

     IFSAR type II, having spatial resolution of 5 m digital       provides an essential aid in morpho-structural analysis
     surface model (DSM) with 1 m vertical accuracy and            and characterization of landform-lithology in geological
     2 m of horizontal accuracy. Spatial resolution of ORRI        interpretation and was derived from the digital surface
     product is 1.25 m with 2 m accuracy. IFSAR type I,            model data by using particular hydro-enforcement software.
     having spatial resolution of 5 m DSM with 15 – 50
     cm vertical accuracy and 1 m of horizontal accuracy.          Development of Existing Data
     Spatial resolution of ORRI product is 0.625 m with 1               A great deal of data from various aspects of geology
     m accuracy.                                                   and geophysics had been accumulated over the previous
5.   Radarsat-2; Canadian satellite earth observation.             fifty years. However, development of an inventory of such
     Launched in December 2007. Radar technology in                a great amount of data can be a problem. Data collections
     orbital height 798 km of sun-synchronous orbit and            which are stored in the library are mostly only available
     using C-band and multi polarization of HH, VV, HV             in non-digital format and must be converted into digital
     and VH. Highest spatial resolution is 1 m in Spotlight        data in the form of vector and raster layers together with
     Mode, 3 m in Ultra Fine Mode with 100 m position              data attributes.
     of accuracy.                                                       Building a geological database system referred firstly
6.   TerraSar-X; German satellite earth observation.               to broad geological information in particular areas and
     Launched in June 2007 and operated since January              further pursued into local specific geological information.
     2008. Radar technology using X-band and multi                 A database inventory was collected and stored with the
     polarization of HH, VV, HV and VH. This sensor can            information content including information on regional
     operate in day and night and in all weather conditions.       geology, physiography, stratigraphy, geological structures,
     TerraSar-X is having 11 days of temporal resolution           tectonic setting, and energy and mineral resources. Specific
     and 1 m of spatial resolution. There are three modes          data wers stored in vector format in the following hierarchy:
     of data acquisition of TerraSar-X: Spot Light with 1          project (Prj_ID), map sheet number (sheet_ID), region
     m of spatial resolution and swath 5 km x 10 km, Strip         (region_ID), location number (loc_ID), formation (Fm_ID),
     Map with 3 m of spatial resolution and swath 30 km            symbols (symbol_ID), group (group_ID), class lithology
     x 50 km and finally Scan SAR with 18 m of spatial             (litho_ID), environment (en_ID), era, period, epoch, fossil,
     resolution and swath 100 km x 150 km.                         remarks, storage number (sto_ID) and references.

                     METHODOLOGY
     Geological interpretation based on remotely sensed
data required datasets which contain specific information
on the earth’s surface. Spectral, altitude and terrain data
combined with secondary data regarding morphology,
lithology, location of observation, rock units, geochemistry,
measurements of strikes and dips and other local attributes
comprised the main information used to develop the
geological maps. In order to achieve a better performance
in interpretation work, it was necessary to develop all
information into a database format and process in a GIS
environment. Airborne and satellite images, field data,
and other secondary data were prepared before geological
interpretation started and finally compiled in a preliminary
geological map based on remote sensing data interpretation
(Figure 3).

Spatial Data Preparation
     Preparation of data included the creation of shaded
relief of the digital surface model (DSM) and intensity layer
of orthorectified images (ORRI) taken from satellite radar
images which are posted by 50 m to generate contours at a
25 m interval. Data preparation on optical images (Landsat
ETM+7) included the creation of orthorectified images
and color composites of R/G/B: 4/5/7 in order to highlight
geological features in the areas of interest. Image fusion of
active and passive satellite imagery was also undertaken in
order to create datasets which have both spectral information      Figure 3: Flow chart in updating geological maps of Indonesia to
and highly detailed terrain information. The drainage pattern      1:50,000 map scale.

Bulletin of the Geological Society of Malaysia, Volume 59, November 2013                                                          23
Jamal, Sidarto, Ipranto & Sonny Mawardi
Development of the data base into a GIS environment data validation in order to prove the interpretation results
was necessary in order to support the geological interpretation and to check the correlation of rock units or formations in
work and ensure that geological interpretation met a good a particular area.
quality standard and used valid and precise information. Ground truth investigations were also conducted
by visiting areas in which there was ambiguity in the
Geological Interpretation interpretation of results. Furthermore, a more systematic
Geological interpretation based on satellite images survey was also undertaken by carrying out stratigraphic
was done by visual interpretation with computer aided studies regarding rock formations that have already been
software. Specific computer software was used with interpreted. Survey lines were prepared in order to make
capabilities of digital image processing, modeling, three new geologic cross sections of the interpretation maps at
dimensional visualization, hydro enforcement, and other 1:50,000 scale. The data records that were collected during
visual enhancement techniques. Overlays of various datasets field survey contain information of station number, date,
including field data in the form of vector data from previous scale, formation, lithology, thickness, texture, sedimentary
projects were combined to analyze and develop a preliminary structures, composition, fossils, color, strike/dip, sample
geological map. The interpretation was conducted by number, remarks and other descriptive information as thought
overlaying information layers from vector and raster data necessary. All data records were compiled and added as a
to extract new detailed geological information. new information layer in geological interpretation map in
The method of interpretation was to describe order to develop a preliminary geological map at 1:50,000
morphological features in a particular area, define the map scale.
landform genetics, and group into geo-morphological classes.
Key elements are shape, pattern, relief, drainage, vegetation Digital Layout
and dimension of a particular morphology. Furthermore, Geological interpretations based on remote sensing
other geological features were analyzed on the imagery to data were prepared in a digital map format at 1:50,000
differentiate and delineate lithologic units or rock units. scale. The information includes boundaries of rock units,
Optical satellite images can help to determine relatively geological structures, satellite/airborne imagery a as base
younger and older formations or rock units. Combination map (both optical and radar data), the geological map at
with high resolution radar images may help to recognize 1:250,000 scale as reference data, topographic map, and
sediments, intrusions, alluvial deposits, metamorphic rocks, legend containing geological symbols (Figure 6).
and volcanic deposits.
UPDATING GEOLOGICAL MAP AT 1:50,000 MAP
Validation and Ground Truth SCALE
Ground truth and stratigraphic surveys were undertaken The project has so far been conducted for two years
for some area of interest which are believed to be key area starting from 2010. Until now it has produced geologic
in order to validate the geological interpretation results. interpretation maps for at least 1700 map sheets. The areas
For this purpose a limited number of objects or areas are covered areas are Sulawesi, Kalimantan, Bali, Nusa Tenggara
selected and visited in the field. The data collected in the and Papua Island. Preparation of the maps in digital layouts
field is referred to as ground truth. was done in 1:50,000 scale. The maps are represented as
Geological interpretation results are inevitably geological maps based on interpretation of remote sensing
subjective results, therefore it is necessary to validate data (Figure 4).
and cross check the relationships of several ‘interpreted’ In the year 2010 geological interpretation was done
formations or rock units in the field. Field identification was for Sulawesi, Bali, and Nusa Tenggara Island with the
also undertaken to collect new authentic data as well as for completion of more than 750 map sheets. The following
Figure 4: Planning for development of
geological mapping based on remote
sensing data interpretation (Sidarto,
2010).
24 Bulletin of the Geological Society of Malaysia, Volume 59, November 2013Geological interpretation based on satelite imagery: Updating geological maps of Indonesia to 1:50,000 map scale
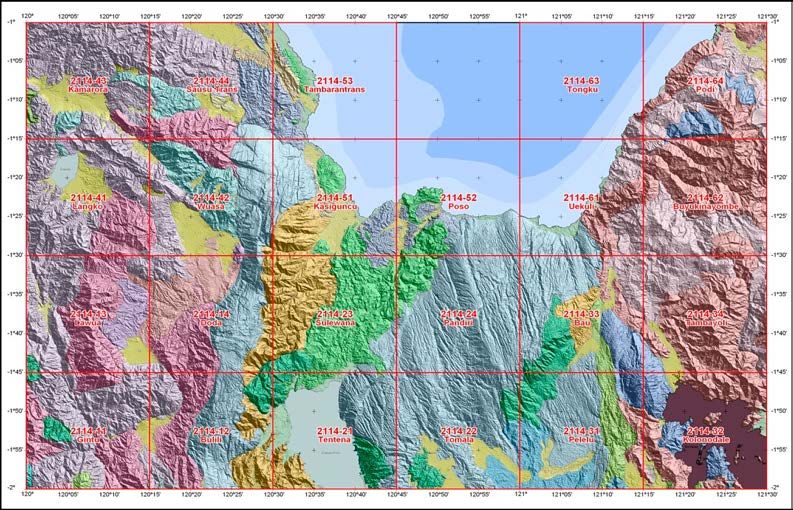
Figure 5: Updating regional
geological map of 1:250,000
map scale into detailed
1:50,000 map scale.
Figure 6: Layout of geological
map based on remote sensing
data interpretation at 1:50,000
map scale.
year (2011) geological interpretation was done for the (1:250,000 map scale) rock formations can be divided into
island of Kalimantan with the completion of more than several lithological units or rock types. For example, in the
800 map sheets. By mid 2012 the completed geological new geological interpretation map a sedimentary formation
interpretations have produced more than 200 map sheets may be subdivided into sandstone, clay and conglomerate/
which cover Papua Island. coarse sandstone. Formations of volcanic rocks may be
Creation of the larger map scale (1:50,000) divides divided into several classes as lava flows, volcanic breccias,
a sheet of the regional geological map at 1:250,000 scale tuffs and lahars. In addition, it may be possible to gain more
into 24 sheets of the new geological maps (Figure 5). There information on the source of eruption.
are several improvements in the updated geological map of Other improvements in geological interpretation at
Indonesia regarding detailed information on boundaries of 1:50,000 map scale are the recognition of geological
rock units. As compared to the previous geological maps lineaments which appear as minor structures in the imagery
Bulletin of the Geological Society of Malaysia, Volume 59, November 2013 25Jamal, Sidarto, Ipranto & Sonny Mawardi
but could not be found in the field. These were successfully These new geological interpretation maps are not
mapped as faults, anticlines and synclines and categorized standard geological maps; they are preliminary maps
as new geological information in the interpreted maps. This providing guidelines for conducting detailed geological
can be used to describe and to explain the detailed tectonic mapping and selecting the priority areas throughout
setting in local areas. Indonesia in order to accelerate the needs of geological
information for national development purposes.
CONCLUSION
The methodology for updating existing geological maps REFERENCES
to 1;50000 scale has depended on geological interpretation Le Pichon, X., 1968. Sea-floor spreading and continental drift.
that is based on visual interpretation on remote sensing data, Journal of Geophysical Research, 73(12), 3661–3697
which means that all the interpretation results still need to GRDC (Pusat Penelitian dan Pengembangan Geologi), 1992. Peta
Geologi Indonesia skala 1:5.000.000
be validated in the real world. It is therefore necessary to
Sidarto, 2010. Perkembangan Teknologi Inderaan jauh dan
mount a field campaign to cross check the relationships Pemanfaatannya untuk Geologi di Indonesia. Publikasi Khusus
between classes of interpreted rock units and define them Badan Geologi, Kementerian Energi dan Sumber Daya Mineral.
based on new and authentic data. Soedrajat, S., A. Noer, L. Sumiarso, S. Suhala, M. Arifin, T.S.
The quality of the result of an image interpretation Kurnat, A. Muis, A.E. Hermantoro, S. Herwanto, M. Wijono
depends on a number of factors: the interpreter, the image & S. Prawira, 1991: Potensi dan prospek investasi di sector
data used, and the guidelines provided. The professional pertambangan dan Energi; Yayasan Krida Caraka Bhumi,
experience and the experience of image interpretation Jakarta, 548 p.
determine the skills of an image-interpreter. Therefore, it Suhala, S. &Yoesoef, A.F., 1995. Teknologi Pertambangan di
Indonesia; Direktorat Jendral Pekerjaan Umum, PPTM
is important to define interpretation keys, which provide
Bandung.
guidelines on how to recognize certain geological features Sukamto, R., 2000. Pengetahuan Geologi Indonesia: Tantangan
on satellite imagery and to establish standardization for dan Pemanfaatan; Publikasi Khusus Pusat Penelitian dan
development of Indonesian geologic maps, thus ensuring Pengembangan Geologi; Direktorat Jendral Geologi dan
the reproducability of the work. Sumber Daya Mineral.
Manuscript received 21 December 2012
26 Bulletin of the Geological Society of Malaysia, Volume 59, November 2013You can also read