Geology and Scientific Significance of the Rümker Region in Northern Oceanus Procellarum: China's Chang'E-5 Landing Region - Archive ouverte HAL
←
→
Page content transcription
If your browser does not render page correctly, please read the page content below

Geology and Scientific Significance of the Rümker
        Region in Northern Oceanus Procellarum: China’s
                   Chang’E-5 Landing Region
   Y. Qian, L. Xiao, Y. Zhao, J. Huang, Jessica Flahaut, M. Martinot, J. Head,
                                    H. Hiesinger, Gang Wang

     To cite this version:
    Y. Qian, L. Xiao, Y. Zhao, J. Huang, Jessica Flahaut, et al.. Geology and Scientific Signifi-
    cance of the Rümker Region in Northern Oceanus Procellarum: China’s Chang’E-5 Landing Re-
    gion. Journal of Geophysical Research. Planets, Wiley-Blackwell, 2018, 123 (6), pp.1407-1430.
    �10.1029/2018JE005595�. �hal-02130239�

                                 HAL Id: hal-02130239
                https://hal.archives-ouvertes.fr/hal-02130239
                                     Submitted on 1 Jan 2022

    HAL is a multi-disciplinary open access            L’archive ouverte pluridisciplinaire HAL, est
archive for the deposit and dissemination of sci- destinée au dépôt et à la diffusion de documents
entific research documents, whether they are pub- scientifiques de niveau recherche, publiés ou non,
lished or not. The documents may come from émanant des établissements d’enseignement et de
teaching and research institutions in France or recherche français ou étrangers, des laboratoires
abroad, or from public or private research centers. publics ou privés.
                                              Copyright
Journal of Geophysical Research: Planets
RESEARCH ARTICLE                                Geology and Scientific Significance of the Rümker
10.1029/2018JE005595
                                                Region in Northern Oceanus Procellarum:
Special Section:                                China’s Chang’E-5 Landing Region
Science and Exploration of the
Moon, Near-Earth Asteroids,                     Y. Q. Qian1 , L. Xiao1 , S. Y. Zhao1 , J. N. Zhao1 , J. Huang1 , J. Flahaut2,3                           ,
and the Moons of Mars                           M. Martinot4,5 , J. W. Head6 , H. Hiesinger7 , and G. X. Wang8
                                                1
                                                  State Key Laboratory of Geological Processes and Mineral Resources, Planetary Science Institute, School of Earth Sciences,
Key Points:
• The Rümker region is located in the           China University of Geosciences, Wuhan, China, 2Centre de Recherches Pétrographiques et Géochimiques, CNRS/UMR
  northwest of the Procellarum KREEP            7358, Université de Lorraine, Vandœuvre-lès-Nancy, France, 3Institut de Recherche en Astrophysique et Planétologie,
  Terrane, experiencing a long and              CNRS/UMR 5277, Université Paul Sabatier, Toulouse, France, 4Faculty of Science, Vrije Universiteit Amsterdam, Amsterdam,
  complex geological history
                                                Netherlands, 5Université Lyon 1, ENS-Lyon, CNRS, UMR 5276 LGL-TPE, Villeurbanne, France, 6Department of Earth,
• We carried out a detailed geological
  study and defined and dated 14                 Environmental and Planetary Sciences, Brown University, Providence, RI, USA, 7Institut für Planetologie, Westfälische
  geological units                              Wilhelms-Universität Münster, Münster, Germany, 8Beijing Spacecrafts, China Academy of Space Technology, Beijing, China
• The Em4 is the science-richest unit
  and suitable for landing. It is proposed
  as the first priority for sample return        Abstract The Rümker region (41–45°N, 49–69°W) is located in northern Oceanus Procellarum of the Moon.
                                                Mons Rümker is the most distinctive geological feature in the area. The region is characterized by prolonged
Supporting Information:                         lunar volcanism (Late Imbrian Period to Eratosthenian Period), forming multiple geologic units in the area,
• Supporting Information S1                     including very low-Ti to low-Ti mare basalts, high-Ti mare basalts, and volcanic complexes. Each geologic unit
• Data Set S1
• Figure S1
                                                has distinct element composition and mineral assemblages. The Rümker region, overlying the Procellarum
                                                KREEP Terrain, was selected as the landing region for China’s Chang’E-5 lunar sample return mission.
Correspondence to:                              Prelanding analyses of the geologic context and scientific potential are reported in this contribution. We
L. Xiao,                                        conducted detailed geological mapping using image, spectral, and altimetry data. Fourteen geological units
longxiao@cug.edu.cn
                                                were defined, a geologic map was constructed, and the geologic history was outlined. The western mare
                                                units (Im1, Im2, and Im3) are Imbrian-aged (~3.4–3.5 Ga) representing the major stage of lunar mare
Citation:                                       eruptive volcanism. The eastern young mare units (Em3 and Em4;
Journal of Geophysical Research: Planets                                                 10.1029/2018JE005595

                  Figure 1. Location of the Rümker region and previous landing sites. The Rümker region is located in northern Oceanus
                  Procellarum, away from previous sampling sites. The basemap is a Lunar Orbiter Laser Altimeter and Kaguya Terrain
                  Camera merged hillshade map (simple cylindrical projection; Barker et al., 2016).

                  Located in northern Oceanus Procellarum (Figure 1), the Rümker region is in the northwest part of the PKT
                  (Figure 2; Haskin, 1998; Jolliff et al., 2000). Its extended and complex geologic history includes multiple
                  volcanic episodes, each differing in element composition and mineral assemblages (e.g., Hiesinger et al.,
                  2003, 2011; Morota et al., 2011; Pieters, 1978; Zhang et al., 2016).

                  Figure 2. Thorium abundance map of the lunar nearside. The thick black line denotes the boundary of the Procellarum
                  KREEP Terrane (Th > 3.5 ppm). “A” represents the Apollo sampling sites; “L” represents the Luna sampling sites. The
                  white box indicates the CE5 designated landing region. The basemap is a Lunar Orbiter Laser Altimeter and Kaguya
                  Terrane Camera merged hillshade map (Barker et al., 2016) superposed on the Lunar Prospector thorium data (Prettyman
                  et al., 2006).

QIAN ET AL.                                                                                                                     1408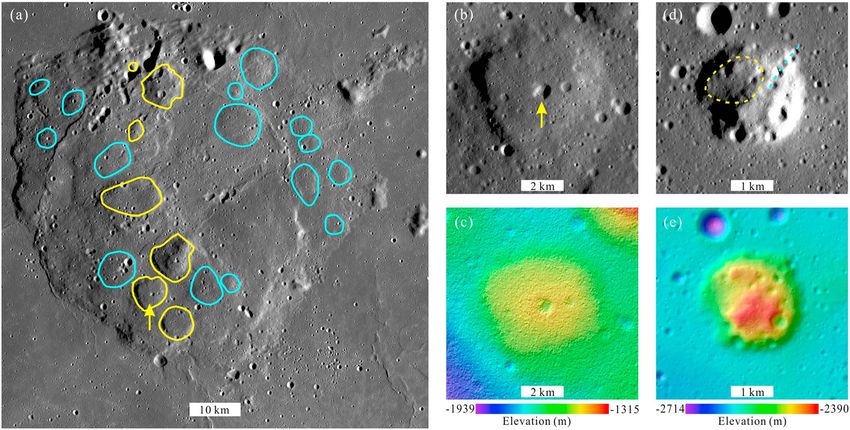
Journal of Geophysical Research: Planets                                              10.1029/2018JE005595

                  Earliest geological mapping (Wilhelms & McCauley, 1971; 1:5 million) defined two mare units in the Rümker
                  region, that is, Imbrian-aged and Eratosthenian-aged mare units (Im and Em). Scott et al. (1977) combined
                  these into an Imbrian-Eratosthenian-aged mare unit (EIm). Scott and Eggleton (1973) subdivided two non-
                  mare units (Ith and If) and two mare units (Im and Em) in their 1:1 million geological map. The authors con-
                  cluded that the Ith unit resembles the Alpes Formation and that the If unit is part of the Fra Mauro Formation,
                  both of which are interpreted as ejecta materials from the Imbrium impact basin (Page, 1970; Scott &
                  Eggleton, 1973).
                  Whitford-Stark and Head (1980) later subdivided four lithostratigraphic formations in Oceanus Procellarum
                  according to surface morphology and spectral characteristics. Three of them occur in the Rümker region,
                  including the Telemann Formation (the western part), the Sharp Formation (the eastern part), and the
                  Hermann Formation (the central southern part). Three basalt end-members were identified (Dechen Basalt,
                  Lavoisier Basalt, and Roris Basalt), and their sources and emplacement styles were studied in detail
                  (Whitford-Stark & Head, 1980).
                  More recent stratigraphic works were based on Clementine data. Hiesinger et al. (2003, 2011) used
                  Clementine color ratio data (750–400 nm/750 + 400 nm as red, 750/990 nm as green, and 400/750 nm as
                  blue) to map the mare units in Oceanus Procellarum. Three spectrally homogeneous units in the Rümker
                  region were defined and dated by crater size-frequency distribution (CSFD) methods (P9, 3.47 Ga; P10,
                  3.44 Ga; P58, 1.33 Ga; Hiesinger et al., 2003, 2011). Using Clementine false-color mosaics (750 nm/415 nm
                  as red, 750 nm/950 nm as green, and 415 nm/750 nm as blue), titanium and iron data, Boroughs and
                  Spudis (2001) mapped six lava flows in northern Oceanus Procellarum. Four of them are located within the
                  Rümker region (Flow2, Flow3, Flow5, and Flow6).
                  Mons Rümker (i.e., Rümker Hills), the most distinctive topographic feature in northern Oceanus Procellarum,
                  has long been recognized as one of the three major volcanic complexes in Oceanus Procellarum
                  (Whitford-Stark & Head, 1977). Its morphology, composition, mineralogy, and formation mechanism have
                  been well studied (Campbell et al., 2009; Dmitrovsky et al., 2017; Farrand et al., 2015; Smith, 1974;
                  Whitford-Stark & Head, 1977; Wöhler et al., 2007; Zhao et al., 2017). A comprehensive analysis using recent
                  lunar orbital data (Zhao et al., 2017) identified three geologic units at Mons Rümker and further obtained
                  their model ages by CSFD methods (IR1, 3.71 Ga; IR2, 3.58 Ga; IR3, 3.51 Ga). Zhao et al. (2017) concluded that
                  the steep-sided domes and shallow domes on Mons Rümker are probably formed at different stages of evo-
                  lution of this volcanic complex.
                  China’s first lunar sample return mission, Chang’E-5 (CE5) mission, is scheduled to launch in 2019, following
                  the successful Chang’E-3 (CE3) soft landing and roving exploration of northern Mare Imbrium (44.12°N,
                  19.51°W; Ling et al., 2015; Xiao, 2014; Xiao et al., 2015; Zou et al., 2016). The Rümker region in northern
                  Oceanus Procellarum (41–45°N, 49–69°W, ~58,000 km2 in area) is the landing region selected for the CE5 mis-
                  sion (Zeng et al., 2017). Up to 2 kg of lunar samples from the surface and subsurface (up to 2 m in depth) are
                  planned to be collected and returned to the Earth (Wang & Xiao, 2017; Zou & Li, 2017), providing an oppor-
                  tunity to study new lunar samples in terrestrial laboratories since Luna-24 (1976).
                  The Rümker region remains unexplored by robotic or human landing missions carried out earlier by the
                  United States (Surveyor, Apollo) or the Soviet Union (Luna), and no samples have ever been returned from
                  this broad area (Figures 1 and 2). Understanding its geological context and evaluating the scientific value
                  of materials from this region are key to the further exploration and preparation for sample return and analy-
                  sis. A detailed study of Mons Rümker was carried out, and several candidate landing sites were proposed by
                  Zhao et al. (2017). However, the extensive mare areas to the north, making up the majority of the landing
                  region (Figure 3), have not been well studied using newly obtained orbital remote sensing data. Therefore,
                  the goals of this study are (1) to characterize the geological context of the Rümker region, (2) to assess their
                  science potential for understanding and resolving outstanding lunar science questions, and (3) to propose
                  the most scientifically significant landing and sampling sites for the CE5 mission. To understand better the
                  context of the Rümker region, we extend our study area to 39–46°N, 48–70°W (Figure 3).

                  2. Data and Methods
                  2.1. Topography and Geomorphology
                  A Kaguya Terrain Camera (TC) global image mosaic with uniform morning illumination (TC Morning Map
                  data) and TC DTM data, with a spatial resolution of ~10 m/pixel (Haruyama et al., 2008, 2014), were

QIAN ET AL.                                                                                                                 1409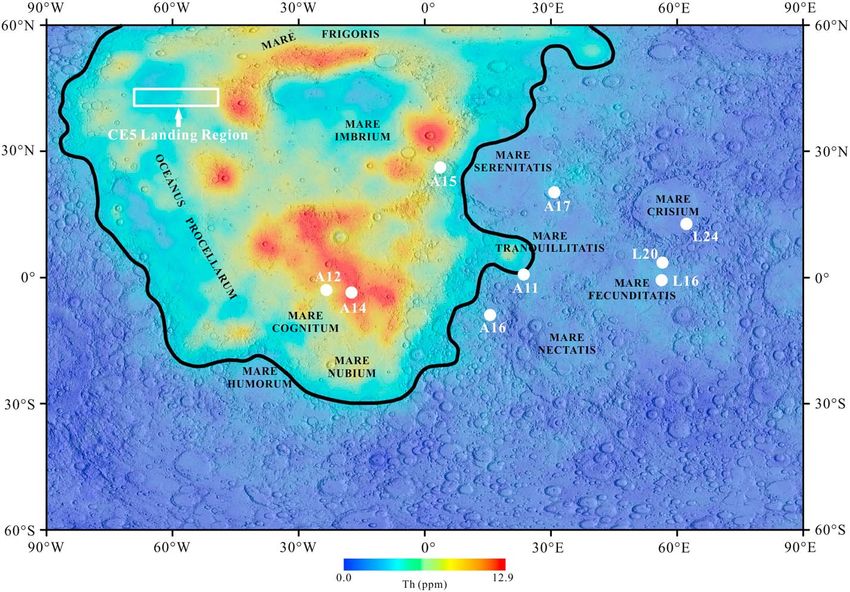
Journal of Geophysical Research: Planets                                                  10.1029/2018JE005595

                  Figure 3. (a) Terrane camera (TC) morning map of the Rümker region (Lambert conformal conic projection). The white
                  box denotes the CE5 landing region. The yellow boxes represent the locations of other figures in this paper. The yellow
                  dashed lines denote the ejecta from Harpalus carter. The blue dashed lines denote ejecta from Pythagoras crater. The
                  green dashed lines denote ejecta probably from Copernicus crater. (b) Topography of the Rümker region. The image is a
                  Lunar Orbiter Laser Altimeter and Kaguya TC merged hillshade map superposed on the TC DTM data (Lambert conformal
                  conic projection). The white box denotes the CE5 landing region. The black lines denote wrinkle ridges. The red lines
                  denote Rima Sharp.

                  mosaicked to analyze topographic and geomorphologic features. TC Morning Map data were used to
                  perform the CSFD measurements on the major mare units to determine their absolute model ages. TC
                  Morning Map and TC DTM data were downloaded from the SELENE Data Archive (http://darts.isas.jaxa.jp/
                  planet/pdap/selene/). Lunar Reconnaissance Orbiter (LRO) wide-angle camera (WAC) DTM data (~118 m/pixel;
                  Scholten et al., 2012) were applied at a baseline length of 354 m to survey surface slopes. LRO narrow-angle
                  camera (NAC) data were used for more detailed studies of local features, due to their high spatial resolution (up to
                  ~0.5 m/pixel) and more variable illumination conditions (Robinson et al., 2010). WAC DTM data and NAC data
                  were downloaded from the LROC website (http://lroc.sese.asu.edu/).

                  2.2. Composition
                  2.2.1. TiO2 and FeO Contents
                  Kaguya Multiband Imager (MI) data were downloaded from the SELENE Data Archive (http://darts.isas.jaxa.jp/
                  planet/pdap/selene/). MI has five visible bands (415, 750, 900, 950, and 1,000 nm) and a spatial resolution of

QIAN ET AL.                                                                                                                       1410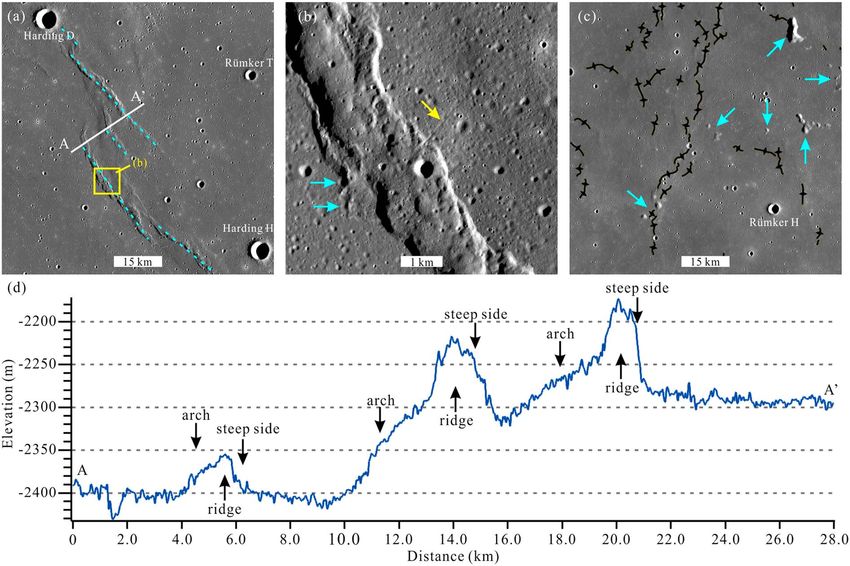
Journal of Geophysical Research: Planets                                                   10.1029/2018JE005595

                  20 m (Ohtake et al., 2008). TiO2 and FeO abundances were calculated from MI data using the algorithms
                  described by Otake et al. (2012):

                                                 θTi ¼ arctanf½ðR415 =R750 Þ  0:208=ðR750 þ 0:108Þg                                 (1)

                                                               wt%TiO2 ¼ 0:72  θTi 14:964                                            (2)

                                                 θFe ¼ arctanf½ðR950 =R750 Þ  1:250=ðR750  0:037Þg                                 (3)

                                                           wt%FeO ¼ 20:527  θFe  12:266                                             (4)

                  where R415, R750, and R950 are the reflectance at each corresponding band. The standard deviation of the
                  TiO2 and FeO contents are 0.43 and 0.81 wt %, respectively. Caution should be exercised in interpretations
                  when the TiO2 content is lower than 2 wt %, at which point the linear correlation between UV/VIS (321 nm/
                  415 nm) and TiO2 content tends to break down (Coman et al., 2018; Sato et al., 2017).
                  A false color composite map was produced from MI data by assigning 750 nm/415 nm as red, 750 nm/950 nm
                  as green, and 415 nm/750 nm as blue (Pieters et al., 1994). Because of its sensitivity to surface maturity and
                  composition, and its ability to highlight subtle spectral differences (Eliason et al., 1999; Pieters et al., 1994), the
                  false color composite map, together with titanium and iron variation and crater distribution data, was used to
                  determine the nature and boundaries of geologic units.
                  2.2.2. Mineralogy
                  Moon Mineralogy Mapper (M3) reflectance data acquired from the optical period OP2C were selected
                  because of their full spatial coverage over the Rümker region. M3 OP2C data have a spatial resolution of
                  280 m/pixel, with 85 bands, spanning from 430 to 3,000 nm (Pieters et al., 2009). The M3 data used in this
                  study are calibrated data archived in the Planetary Data System (version 1 of Level 2), radiometrically cor-
                  rected (Green et al., 2011), geometrically corrected (Boardman et al., 2011), thermally corrected (Clark et al.,
                  2011), and photometrically corrected (Besse et al., 2013).
                  To decrease the effects of space weathering and to permit a more robust spectral study, we removed the
                  continuum following the method of Horgan et al. (2014) and Martinot et al. (2018). These authors defined
                  the continuum by maximizing the 1 and 2 micron absorption bands. Spectral parameters such as band cen-
                  ters, band depths, band areas, and band asymmetries were calculated for the 1 and 2 micron absorption
                  bands of each spectrum. M3 RGB composite maps using these criteria were produced to highlight the
                  mineralogical diversity of the Rümker region (Martinot et al., 2018; Mustard et al., 2011). Both M3 original
                  and continuum-removed spectra were visually analyzed for definitive mineral identification, performed by
                  comparison of the M3 spectra with the RELAB reference library (http://www.planetary.brown.edu/relab/).

                  3. Results
                  3.1. Topography
                  The Rümker region is located within the relatively smooth mare plains of northern Oceanus Procellarum
                  (Kreslavsky et al., 2013; Rosenburg et al., 2011; Figure 3a). This area is covered by widespread mare basalts
                  and is generally flat. The mean slope of the area is 1.1° (at a baseline length of 354 m), with only 10% of
                  the area exceeding a slope of 2°. The average elevation of the mare area is ~2,145 m. The western maria
                  is 200–300 m higher than the eastern maria (Figure 3b). The highest point is in the south of Mons Rümker
                  (1,271 m), and the lowest point is at the bottom of Mairan G crater (3,571 m). The regional topography
                  is largely influenced by mare ridges, along which the mare surface is locally raised, up to 100–200 m. Mons
                  Rümker, ~70 km in diameter, stands up to 1,300 m above the surrounding mare. It has a mean slope of
                  2.7°. The individual domes on Mons Rümker are slightly steeper than the plateau.

                  3.2. Geomorphology
                  3.2.1. Impact Craters
                  Most of the craters in the area are simple primary craters smaller than 2 km in diameter, characterized by
                  bowl-shaped floors, only few with flat bottoms. Almost all craters larger than 2 km in diameter are found
                  in the western maria. It is also apparent that the western maria has a much higher crater density than the
                  eastern maria. Harding D (centered at 42.8°N, 67.6°W; Figure 4a) is the largest crater in the area. It has a

QIAN ET AL.                                                                                                                        1411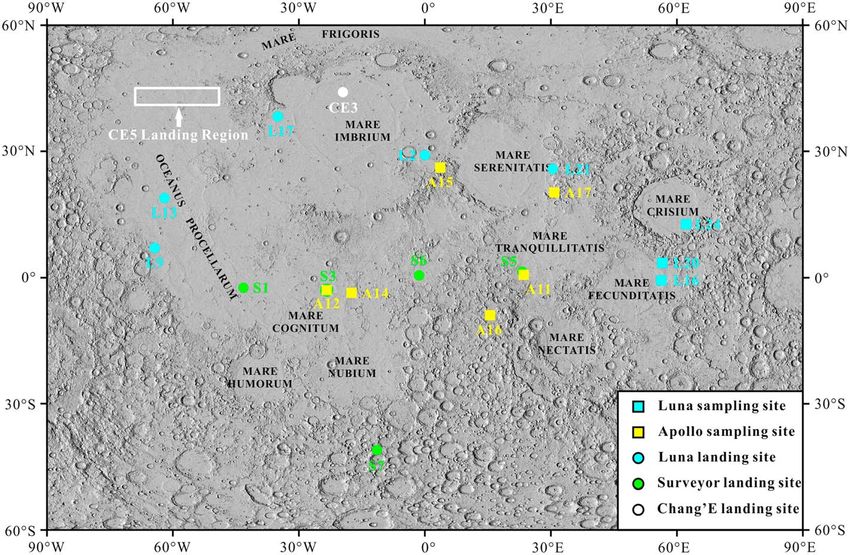
Journal of Geophysical Research: Planets                                                             10.1029/2018JE005595

Figure 4. Typical impact crater-related structures in the Rümker region. (a) Harding D crater (centered at 42.8°N, 67.6°W; Figure 3a). This crater formed on a NW-
oriented wrinkle ridge (blue dashed lines). Its ejecta (yellow arrow) buries a portion of the wrinkle ridge. (b) Secondary crater clusters (centered at 42.9°N, 58.0°W;
Figure 3a). The yellow dashed line denotes Harpalus secondaries (Scott & Eggleton, 1973). The secondary craters denoted by the blue dashed line are radial to
Copernicus crater and are thus probably formed by Copernicus crater ejecta. The blue arrow denotes secondaries without any dominant orientations. (c) A buried
crater (centered at 44.4°N, 61.9°W; Figure 3a). The yellow arrows denote the exposed rim crest of the preexisting crater. This preexisting crater is almost completely
buried by the later lavas. The subsequent lava flooding is estimated to be less than ~800 m, using the depth/diameter relationships of fresh craters (Pike, 1974).

                                          diameter of 6.3 km and a bowl-shaped floor. Its rim is ~250 m higher than the surrounding mare. This crater
                                          formed on a NE-orientated wrinkle ridge.
                                          Secondary crater clusters formed by ejecta from the crater Copernicus (NW trend), Harpalus (NE trend), and
                                          Pythagoras (NW trend) are distributed in the area (Figure 3a; Scott & Eggleton, 1973). For example, the
                                          NE-oriented clusters to the north of Mons Rümker are formed by Harpalus crater ejecta (Figure 4b; Scott &
                                          Eggleton, 1973). However, the sources of the secondaries that are not characterized by any preferred orienta-
                                          tions are mostly unknown.
                                          There are at least 35 buried craters in the study area (39–46°N, 48–70°W) and 15 buried craters that lie within
                                          the Rümker region (41–45°N, 49–69°W), mostly in the eastern maria. These premare craters were partially
                                          filled by lava flows, leaving only the raised rim crests visible on the surface (Figure 4c).
                                          3.2.2. Wrinkle Ridges
                                          Lunar wrinkle ridges are abundant in the study area (Figure 3b). Most of the wrinkle ridges have typical
                                          shapes as described by Strom (1972) and Sharpton and Head (1988) (i.e., a gently sloping, broad arch at
                                          the base, and a sharper but irregular ridge at the top; Figure 5). The dimensions of the wrinkle ridges are vari-
                                          able in the Rümker region. In the western maria, the wrinkle ridges range up to 6 km in width and 110 km in
                                          length and are 200 m above the surrounding mare. In the eastern maria, the wrinkle ridges are smaller than
                                          those in the western maria, mostly less than 1.5 km in width and 20 km in length, and are seldom much
                                          higher than 50 m above the surrounding mare.
                                          The wrinkle ridges in the Rümker region have three preferred orientations (NW, NNW, and NE, respec-
                                          tively). In the western maria, most wrinkle ridges are oriented NW or NNW, consistent with the preferred
                                          orientation of those in Oceanus Procellarum as a whole (Yue et al., 2015). For example, the wrinkle ridges
                                          between Harding D and Harding H craters in the western maria are parallel and have a distinct NW trend
                                          (Figure 5a). Five independent wrinkle ridges are parallel with each other, with variable lengths (10 to
                                          100 km) but similar morphologies and slopes. In the vicinity of these parallel wrinkle ridges, a linear fault
                                          vertically cuts a wrinkle ridge (Figure 5b).
                                          In the eastern maria, the wrinkle ridges have a prominent NE trend along the outer ring of the Imbrium basin
                                          marked by the shoreline of Mare Frigoris (Spudis et al., 1988; Wilhelms & McCauley, 1971). This trend suggests
                                          that the wrinkle ridge formation in the eastern maria was affected by the ring system of the Imbrium basin
                                          (Head, 1982; Maxwell et al., 1975).
                                          3.2.3. Sinuous Rilles
                                          In the eastern maria, a sinuous rille (Rima Sharp) is incised into the mare plains along the mare/highland
                                          boundary (Figure 3b). Rima Sharp is even the longest sinuous rille on the Moon (Hurwitz et al., 2013). It

QIAN ET AL.                                                                                                                                                      1412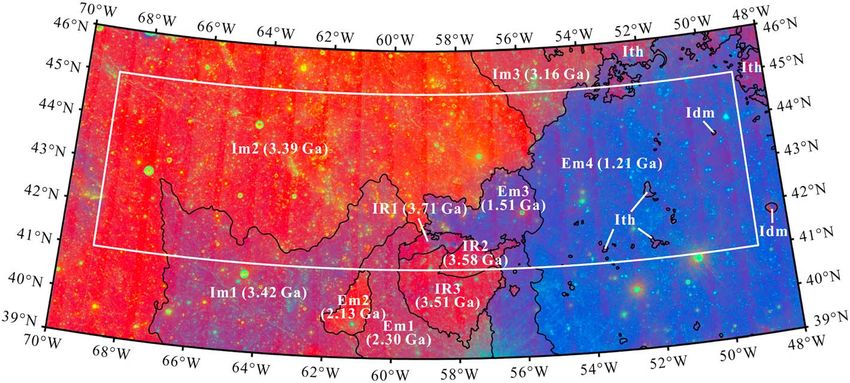
Journal of Geophysical Research: Planets                                                              10.1029/2018JE005595

Figure 5. Wrinkle ridges. (a) NW-orientated parallel wrinkle ridges (centered at 41.7°N, 66.3°W; Figure 3a). The blue dashed lines denote parallel wrinkle ridges. AA0
shows the location of the profile in Figure 5d. The yellow box denotes the location of Figure 5b. (b) A southwest trending fault cuts the wrinkle ridge in the area
(the yellow arrow). The craters denoted by blue arrows are cross-cut by the ridge front. (c) Wrinkle ridges in the eastern maria (centered at 41.3°N, 53.9°W; Figure 3a).
They are oriented NE along the outer ring marked by kipukas (see section 3.2.5). (d) Topographic profile across wrinkle ridges (AA0 in (a)). The wrinkle ridges in
the area display the typical broad arches (2–3°) and sharp ridges (up to 8°; Sharpton & Head, 1988; Strom, 1972).

                                          originates in Sinus Roris, to the north of the Rümker region, at an elevation of 2,300 m, and fades into the
                                          mare surface to the south at an elevation of 2,500 m (Figure 6). Rima Sharp is 566 km long, 257 km of which
                                          are within the study area. The width of Rima Sharp varies from 0.8 to 3 km. Its depth varies from 20 to 50 m,
                                          and the narrowest parts of the channel have greater depths than those of the wider parts. The channel wall
                                          slopes of Rima Sharp fluctuate between 8 and 12°. The regional slope of Rima Sharp (defined as the gradient
                                          of the material surrounding the sinuous rille) is 0.02° as measured by Hurwitz et al. (2013). A thermal erosion
                                          formation mechanism is favored for such sinuous rilles (Hurwitz et al., 2012).
                                          3.2.4. Volcanic Domes
                                          Volcanic domes are relatively common in the lunar maria (Head & Gifford, 1980; Smith, 1973). They are often
                                          observed in clusters, as in the case of Mons Rümker (Smith, 1974; Whitford-Stark & Head, 1977), where most
                                          of the volcanic domes in the study area are located. Zhao et al. (2017) identified 22 volcanic domes on the
                                          Rümker plateau and divided them into two groups: steep-sided domes and shallow domes (Figure 7a). The
                                          steep-sided domes usually have relatively steep flank slopes (>5°) and greater heights, with associated vol-
                                          canic features such as possible summit pits and flow features (Figure 7b). The shallow domes have gentle
                                          topographic relief and lower heights (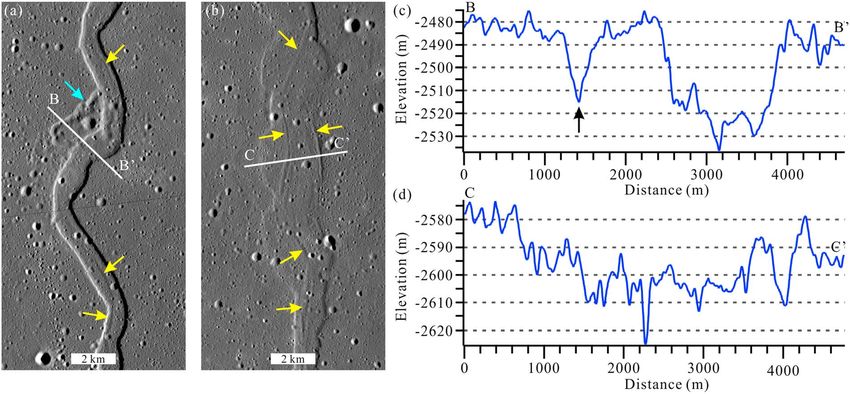
Journal of Geophysical Research: Planets                                                          10.1029/2018JE005595

Figure 6. Sinuous rilles. (a) The narrow and deep parts of Rima Sharp (centered at 45.0°N, 51.0°W; Figure 3a). Rima Sharp is ~1.3 km wide and 40–50 m deep in this
part. The yellow arrows denote small channels within Rima Sharp. The blue arrow denotes a shallow (~30 m in depth) branch of Rima Sharp. The white line (BB0 )
shows the location of the profile in Figure 6c. (b) The wide and shallow part of Rima Sharp (centered at 41.7°N, 50.0°W; Figure 3a). Rima Sharp is ~3.1 km wide and
~20 m deep in this part. The yellow arrows denote small channels within Rima sharp. The white line (CC0 ) shows the location of the profile in Figure 6d.
(c) Topographic profile of the narrow part of Rima Sharp. The black arrow denotes a branch of Rima Sharp. (d) Topographic profile of the wide part of Rima Sharp.

                                        Mairan domes (Glotch et al., 2011; Head & McCord, 1978). This dome is cratered, but most of the craters
                                        appear to be fresh secondaries that not highly degraded. A circular depression (~1.3 km in diameter)
                                        which may be a volcanic depression is outlined in the northwest (the yellow dashed line in Figure 7d). The
                                        East Dome was first described as a silica-rich dome by Glotch et al. (2011). Similar features in the vicinity

Figure 7. Volcanic domes in the Rümker region. (a) Volcanic domes on Mons Rümker. The yellow lines denote steep-sided domes (flank slopes >5°). The blue lines
denote shallow domes (flank slopes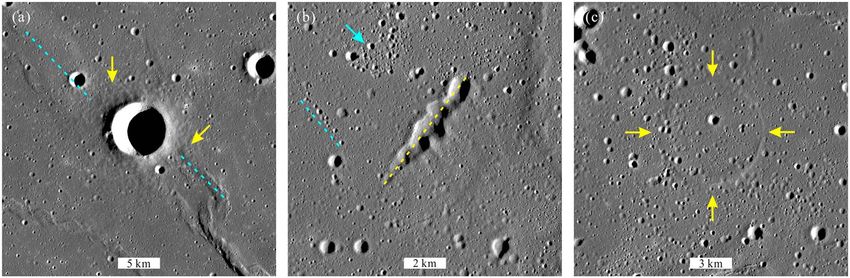
Journal of Geophysical Research: Planets                                                              10.1029/2018JE005595

Figure 8. Kipukas in the Rümker region. (a) Isolated kipukas (centered at 40.4°N, 54.8°W; Figure 3a). These kipukas are reshaped by wrinkle ridges (the blue dashed
lines), especially in the places denoted by the yellow arrows. (b) The largest isolated kipuka (centered at 42.6°N, 52.1°W; Figure 3a). The yellow arrows denote
debris. The blue arrows denote a buried crater (~3.9 km in diameter). (c) Highlands near Louville P crater, with a morphology that is similar to the kipukas scattered in
the eastern maria. The blue dashed lines denote wrinkle ridges.

                                          (the Gruithuisen and Mairan domes) are interpreted to have formed from high viscosity silica-rich magmas of
                                          rhyolitic or dacitic composition (Glotch et al., 2010, 2011; Head & Wilson, 2017; Ivanov et al., 2016; Wilson &
                                          Head, 2003).
                                          3.2.5. Kipukas
                                          Kipukas are islands or exposures of earlier structures or units that have been surrounded by later units.
                                          Numerous isolated kipukas are identified within the eastern maria. They are hilly to hummocky highland
                                          materials of various shapes and are up to 500 m higher than the surrounding surface. The kipukas have rela-
                                          tively smooth surfaces with fewer craters than the maria, and the few remaining craters are all heavily
                                          degraded (Figures 8a and 8b). At the base of the kipukas, debris from the upper slopes encircles the kipukas
                                          and forms a 200 to 300-m wide deposit zone (Head, 1977). Although the kipukas usually display a scattered
                                          distribution in the eastern maria, the highlands in the northeastern part of the study area near Louville P cra-
                                          ter have similar morphologies (Figure 8c). Both the isolated kipukas and highlands near Louville P crater are
                                          characterized by subdued shapes and heavily degraded superposed craters, lying on the possible Imbrium
                                          basin ring (Wilhelms & McCauley, 1971).

                                          3.3. Composition
                                          3.3.1. TiO2 and FeO Concentrations
                                          TiO2 and FeO abundance maps (Figure 9) were used to estimate the surface TiO2 and FeO contents. The
                                          results show that both the TiO2 and FeO abundances vary significantly across the area. The TiO2 contents
                                          range up to 7.5 wt % (Figure 9a), and the FeO contents vary from 10 to 18.0 wt % (Figure 9b). The western
                                          and the eastern maria are dominated by two different types of mare basalts, with distinctly different TiO2
                                          contents, and varying FeO contents. However, it should be noted that about 45% of the study area has
                                          TiO2 contents lower than 2 wt %, a value at which the specific TiO2 contents are probably not accurate
                                          (Coman et al., 2018).
                                          The western maria are characterized by very low-Ti to low-Ti basalts (up to 5.0 wt %, TiO2 content; Neal
                                          & Taylor, 1992). The mean content of TiO2 is 1.6 wt %. About 80% of the area has TiO2 contents lower
                                          than 1%. The northwestern part of the western maria exhibits the lowest TiO2 contents in the study area
                                          (1.3 wt %, mean content). The TiO2 contents increase from north to south in the western maria and reach
                                          an average of 2.4 wt % to the south of Harding D crater. The FeO contents of the western maria are lower
                                          than of the eastern maria. The FeO contents range from 14 to 17 wt % (15.8 wt %, mean content), increas-
                                          ing toward the south.
                                          A very low-FeO zone occurs in the northeast of the western maria, without variation of TiO2 abundances, sug-
                                          gesting an origin due to the emplacement of ejecta from Pythagoras crater (low-Fe and very low-Ti), rather
                                          than due to the composition of local bedrock or regolith. Large craters and their surrounding ejecta in the
                                          western maria have even lower TiO2 contents than the mare surface (
Journal of Geophysical Research: Planets 10.1029/2018JE005595
Figure 9. TiO2 and FeO abundance maps of the Rümker region (Lambert conformal conic projection). (a) TiO2 abundance
map of the study area. (b) FeO abundance map of the study area. The white boxes denote the CE5 landing region. The
black dashed lines denote geologic boundaries discussed in section 3.4.
to the excavation of underlying very low-Ti lava flows or underlying fresh rocks of the same lithology. This
relationship between lava flows and their compositions can be used to obtain the thickness of lava flows
(Thomson et al., 2009; Weider et al., 2010), which is discussed in section 4.1.1.
The eastern maria are clearly more enriched in TiO2 (4.7 wt %, mean content) and FeO (16.7 wt %, mean con-
tent) than the western maria. About 65% of the eastern area has TiO2 contents between 4 and 7 wt % and
about 80% of the area has FeO contents greater than 16%. Most of the eastern maria are covered by bright
(high albedo) ray materials radiating from Copernican-aged Harpalus crater (Figure 3a), whose bedrock target
is low-Ti mare basalts. These materials clearly decrease the surface TiO2 contents in the eastern maria. Except
for these areas covered by ejecta, rocks in the region are classified as high-Ti basalts (TiO2 contents between 6
and 7 wt %; Neal & Taylor, 1992).
The underlying older low-Ti materials are clearly excavated by superposed impact craters, as shown in the
nature of the ejecta from relatively large and fresh craters. This ejecta has TiO2 contents close to those of
the western maria (1.9 wt %, mean content). The kipukas are expected to show very low TiO2 and FeO con-
tents due to their origin as highlands (Spudis et al., 1988), but mixture with the surrounding high-Ti basalts by
impacts has commonly raised their titanium and iron abundance.
Mons Rümker is dominated by low-Ti basalts (1.8 wt %, mean content; Neal & Taylor, 1992). The mean content
of FeO is 15.6 wt %. The FeO content is lower in the northeastern Rümker plateau, due to admixing of high-
land and basaltic materials (Zhao et al., 2017).
3.3.2. Mineralogy
The color composite maps shown in Figure 10 highlight the presence of distinct spectral units, represented
by different colors. The area is dominated by pyroxene signatures, characterized by broad absorption bands
centered around 1 and 2 microns (Adams, 1974). Other common lunar minerals such as olivine or plagioclase
QIAN ET AL. 1416Journal of Geophysical Research: Planets 10.1029/2018JE005595
3 3 3
Figure 10. M spectral analysis of the Rümker region. (a) M 2,900-nm mosaic. (b) M RGB composite of spectral para-
meters (R = 2 micron band center, stretched values: 2,000–2,500 nm; G = 2 micron band depth, stretched values: 0.04–
3
0.13; B = reflectance at 1,580 nm, stretched values: 0.085–0.15). (c) M continuum-removed 3 × 3 pixel average spectra
(using methods of Martinot et al., 2018) of selected impact craters (A through G) and of nearby maria (A0 through G0 )
3
within the western maria (see positions on Figure 10a). (d) M continuum-removed 3 × 3 pixel average spectra of
selected impact craters (H through L) and of the nearby maria (H0 through L0 ) within the eastern mare (see positions on
Figure 10a). (e) RELAB database pyroxene spectra processed using the method of Martinot et al. (2018) (respective samples
RELAB-ID: PD-CMP-006, AG-TJM-010, DL-CMP-008, and DH-MBW-005 for diopside, augite, pigeonite, and enstatite).
have not been detected throughout the study area. Although several parameters, such as surface physical
properties and rock texture, may also influence the band shape, band center positions are often indicative
of the pyroxene cation content (Adams, 1974; Burns et al., 1973; Cloutis & Gaffey, 1991).
The western maria spectra (Figure 10c) are characterized by greater band depths and band centers at shorter
wavelengths than the eastern maria spectra. Spectra from the eastern maria (Figure 10d) are quite homoge-
nous, with the exception of those taken from the interiors of impact craters with diameters exceeding 900 m,
where the spectra have band centers located at shorter wavelengths, consistent with the western maria spec-
tra. It is therefore likely that the impact craters of the eastern maria have excavated material from an older,
buried unit, spectrally similar to the western maria. Spectra of the western maria show 1 and 2 micron bands
centered around 990 and 2,180 nm, consistent with a pyroxene of intermediate-Ca composition such as
pigeonite (Figure 10e). Spectra of the eastern maria have 1 and 2 micron bands centered at ~1,010 and
2,260 nm, consistent with high-Ca pyroxene such as augite (Figure 10e). Ling et al. (2017) also conducted
QIAN ET AL. 1417Journal of Geophysical Research: Planets 10.1029/2018JE005595
Figure 11. Geologic units of the Rümker region. The black lines denote the geological boundaries. The white box denotes
the CE5 landing region. Im1, Im2, and Im3 are Imbrian-aged mare units. Em1, Em2, Em3, and Em4 are Eratosthenian-aged
mare units. IR1, IR2, and IR3 are Rümker plateau units. Ith is a highland unit. Idm is an Imbrian-aged dome unit.
spectral observation of the Rümker region. Both Ling et al. (2017) and this survey suggest that there is little
low-Ca pyroxenes in the mare area.
Mons Rümker, the Mairan T dome, and the highlands in Montes Jura to the east of the study area are all char-
acterized by weaker pyroxene absorptions bands, which likely indicate a lower mafic component, or more
mature regolith (Fischer & Pieters, 1994). The pyroxene component of the highlands is slightly more variable,
with absorption bands shifted toward shorter wavelengths (~950 and 2,140 nm), suggesting the presence of
low-Ca pyroxene rather than the intermediate to high-Ca pyroxene detected in the mare units. The Mons
Rümker pyroxene component is closer in composition to the older, western maria in composition (intermedi-
ate-Ca pyroxene). The Mairan T dome, Mons Rümker, and the highlands in Montes Jura have higher average
reflectance values than the mare units, which may indicate the presence of a less mafic component, such as
silica or feldspar, which cannot easily be detected in the VNIR domain when mixed with pyroxene (e.g.,
Adams & McCord, 1972; Pieters, 1986).
3.4. Geologic Units
Fourteen geologic units were defined and mapped in this study, including seven mare units (Im1, Im2,
Im3, Em1, Em2, Em3, and Em4), three Rümker plateau units (IR1, IR2, and IR3), one nonmare highland units
(Ith), and three dome units (ld, sd, and Idm; Figure 11). In order to define the geologic units, we followed
the assumption by Hiesinger et al. (2000) that spectrally and compositionally homogeneous units are
formed within a short period and each unit represents a single volcanic eruptive phase. Therefore, each
spectrally and compositionally homogeneous unit is regarded as a geologic unit. We used TiO2 and FeO
contents and a false color composite from Kaguya MI data to define spectral and compositional units.
The boundaries revealed by TiO2 and FeO abundance data (Figure 9) correlate well with those revealed
by M3 color composite data (Figure 10). Boundaries are shown as black lines in Figure 11 and black dashed
lines in Figure 9.
Crater size-frequency distribution methods were carried out to analyze the homogeneous units using TC
Morning Map data to determine their absolute model ages. The results are shown in Table 1 together with
optical maturity values, TiO2 and FeO contents, and their uncertainties (shown as standard deviation). The
cumulative crater frequency plots are shown in Figure 12. Mons Rümker was mapped, and surface ages were
determined by Zhao et al. (2017), and we used their results in this study.
Im1, Im2, and Im3 are Imbrian-aged mare units (referred to as western maria above), adopting the lunar
stratigraphy system by Stöffler and Ryder (2001). Im1 is the oldest mare unit (~3.42 Ga) in the area. It is dark
bluish-purple in color with a red hue in the false color map (Figure 11), dominated by low-Ti basalts (2.4 wt %,
mean content of TiO2). Im2 (~3.39 Ga) is the largest mare unit in the area, containing five large craters (>3 km
in diameter), Eratosthenian-aged Pythagoras secondaries, and large wrinkle ridges. It is orange-red in the
QIAN ET AL. 1418Journal of Geophysical Research: Planets 10.1029/2018JE005595
Table 1
Geologic Units in the Study Area
a b df df
Area Model age (this study) Hiesinger et al. (2003) TiO2 FeO
2 cf
Unit (km ) (Ga) (Ga) OMAT (wt %) (wt %)
Em4 35,905 1.21 (+0.03/0.03) 1.33, P58 0.173 (0.023) 4.8 (1.2) 16.7 (0.7)
Em3 5,396 1.51 (+0.07/0.07) 0.168 (0.023) 3.6 (0.9) 16.2 (0.7)
Em2 915 2.13 (+0.13/0.13) 0.164 (0.033) 1.6 (0.4) 16.2 (0.6)
Em1 3,928 2.30 (+0.10/0.10) 0.169 (0.029) 2.4 (0.5) 16.8 (0.4)
Im3 3,454 3.16 (+0.06/0.09) 3.40, P13 0.184 (0.028) 1.4 (0.4) 15.3 (0.7)
Im2 44,327 3.39 (+0.02/0.02) 3.44, P10 0.166 (0.035) 1.3 (0.4) 15.6 (0.8)
Im1 13,749 3.42 (+0.02/0.02) 3.47, P9 0.166 (0.030) 2.4 (0.6) 16.3 (0.6)
e
IR3 747 3.51 (+0.04/0.06) 0.156 (0.025) 1.9 (0.4) 15.9 (0.8)
e
IR2 727 3.58 (+0.03/0.04) 0.155 (0.019) 1.5 (0.4) 14.9 (0.8)
e
IR1 2,912 3.71 (+0.04/0.05) 0.157 (0.027) 2.0 (0.6) 15.1 (1.0)
a
Absolute model ages. Absolute model ages of each unit were calculated using CraterstatsII (http://www.geo.fu-berlin.de/). Uncertainties are reported by Michael
b c
and Neukum (2010). Geologic units and their model ages defined by Hiesinger et al. (2003). Mean optical maturity (OMAT) values. OMAT values were
d e
obtained from Kaguya MI data, using the method described by Lucey et al. (2000) and Lemelin et al. (2016). Mean TiO2 and FeO contents. The CSFD results
f
by Zhao et al. (2017). The values in parentheses of OMAT, TiO2, and FeO indicate standard deviation values of each unit.
false color map (Figure 11), and the TiO2 content (1.3 wt %, mean content) is apparently lower than that of
Im1. Im3 is located in the northeast near Louville P crater (~3.16 Ga; Figure 11), with a low TiO2 content
(1.4 wt %, mean content). It is the smallest Imbrian-aged unit in the area, embaying some of the highlands
near Louville P. Most of the unit is covered by NE-orientated Pythagoras secondary ejecta, resulting in the
largest OMAT value (0.184) in the area. Our mapping results of Imbrian-aged mare units correlate well with
previous stratigraphic studies by Whitford-Stark and Head (1980) and Hiesinger et al. (2003).
Em1, Em2, Em3, and Em4 (Em3 and Em4 are referred to as eastern maria above) are Eratosthenian-aged mare
units. Em1 (~2.30 Ga) embays Mons Rümker in the southwest. It has similar color ratios and TiO2 contents as
the neighboring unit, Im1, but it is different in its relatively high FeO contents and lower crater density. Em2
(~2.13 Ga) has the lowest TiO2 contents (1.6 wt %, mean content) among the Eratosthenian units. It has an
orange-red hue in the false color map (Figure 11) similar to the Im2 unit, but it has fewer craters and a
younger model age. Em3 (~1.51 Ga) is located to the east of Mons Rümker. It is purple in the false color map
(Figure 11), characterized by a low-Ti composition (3.6 wt %, mean content of TiO2). This unit embays a por-
tion of Mons Rümker in the east.
Em4 (~1.21 Ga) is the youngest mare unit in the area. This unit has a high TiO2 (6–7%) content, except for the
areas covered by Copernican-aged secondary ejecta, as discussed in section 3.2.1. The FeO contents of Em4
are also high (16.7 wt %, mean). This unit is purple-blue in the false color map (Figure 11) and embays dozens
of highland kipukas. The wrinkle ridges are smaller than those of western maria, trending NE along the outer
ring of the Imbrium basin. Rima Sharp incises this unit at its boundary with Montes Jura.
IR1, IR2, and IR3 are Rümker plateau units, according to the definition and crater counting results of Zhao et al.
(2017) (Table 1). IR1 (~3.71 Ga) is a lineated terrain in the north of Mons Rümker, formed by a mixing of Iridum
crater ejecta and basaltic materials. IR2 (~3.58 Ga) occurs northeast of Mons Rümker, exhibiting lower TiO2
contents. IR3 (~3.51 Ga) covers the main portion of Mons Rümker, characterized by higher TiO2 and FeO con-
tents than IR2 (Zhao et al., 2017).
Three dome units are identified in the area. Two of them (ld, ~3.5 Ga; sd, active until ~3.0 Ga) were defined by
Zhao et al. (2017) on the basis of their flank slopes. The silica-rich domes including the East Dome and the
Mairan domes (Idm) are mapped as another independent unit with a highland volcanism formation mechan-
ism in the Imbrian Period (Head & McCord, 1978).
Kipukas/highlands are informally defined as massif materials (Wilhelms, 1970) that resemble the Alpes
Formation (Page, 1970), interpreted to have been formed by the ejecta of the Imbrium basin in previous stu-
dies (Scott & Eggleton, 1973; Spudis et al., 1988). In the current study, we defined it as the Ith unit after Scott
and Eggleton (1973). It is the oldest unit in the area, contemporary with the Imbrium basin impact (~3.93 Ga;
Snape et al., 2016).
QIAN ET AL. 1419Journal of Geophysical Research: Planets 10.1029/2018JE005595
Figure 12. Cumulative crater frequency plots and absolute model ages of the mare units analyzed. See Table 1 for details. The lunar production function and the
chronology function are given by Neukum et al. (2001).
4. Discussion
4.1. Volcanic Events and Geologic History
4.1.1. Volcanic Events
The oldest recognizable mare basaltic unit in Oceanus Procellarum is the Repsold Formation (medium to high
TiO2 content). At present it is only exposed in northwestern Oceanus Procellarum near the Rümker region
(Whitford-Stark & Head, 1980). It is inferred to be beneath the uppermost mare basalts defined in this study,
on the basis of superposition relationships and its extensive coverage (Whitford-Stark & Head, 1980). The
QIAN ET AL. 1420Journal of Geophysical Research: Planets 10.1029/2018JE005595
Repsold Formation was emplaced around 3.75 ± 0.05 Ga (Boyce & Jonnson, 1978) or 3.72 Ga (P28; Hiesinger
et al., 2003, 2011) ago.
The basaltic unit IR1 formed ~3.71 Ga during the same period or shortly after the emplacement of the
Repsold Formation, followed by IR2 (3.58 Ga) and IR3 (3.51 Ga; Zhao et al., 2017). Shallow domes (ld) formed
around 3.5 Ga ago (Zhao et al., 2017). Extrusive steep-sided domes formed later by relatively high viscosity
magma, and volcanic activity continued until ~3.0 Ga ago (Zhao et al., 2017). The basaltic eruptions in the
Mons Rümker region are similar to the western maria flows in elemental composition (low TiO2), mineralogy
(intermediate pyroxene composition), and emplacement ages (Imbrian-aged), suggesting that they may be
from the same mantle source region but have different eruption styles.
Although the small silica-rich East Dome has not been dated in this study due to its small area, it most
likely formed in the Imbrian Period, contemporary with the Mairan domes (Head & McCord, 1978) and
other silica-rich domes, for example, the Gruithuisen domes (3.7–3.85 Ga, Wagner et al., 2002) and the
Hansteen domes (3.65–3.74 Ga, Wagner et al., 2010). On the other hand, its relatively shallow slopes
(9°), low thorium abundance (8.6 ppm), and lower silica content compared with other Mairan domes
(Glotch et al., 2011) might indicate that it is not completely similar to typical red spots that are formed by
more viscous, silica-rich magmas (Glotch et al., 2010, 2011; Head & Wilson, 2017; Ivanov et al., 2016; Wilson
& Head, 2003).
The Imbrian-aged mare basalts (Im1, Im2, and Im3) defined in the current study comprise the major mare
eruption phase during the Late Imbrian Period (3.2–3.8 Ga; Hiesinger et al., 2000, 2003, 2010, 2011). This erup-
tion phase has a very low-Ti to low-Ti and intermediate pyroxene composition (e.g., pigeonite), suggesting
early magma source regions without ilmenite. The materials excavated from the largest crater (Harding D,
6.3 km diameter) have similar mineral, TiO2, and FeO contents as those in the surface of the mare, unlike
the underlying Repsold Formation materials, as do other impact craters. This implies that the thickness of
the Imbrian mare units is at least 700 m. The sources of the Imbrian-aged basalt units are hard to trace,
but the sinuous rilles in Mons Rümker and Aristarchus regions were probably the source of some of these
materials (Whitford-Stark & Head, 1980).
The Eratosthenian-aged mare basalts (Em1, Em2, Em3, and Em4) represent the young phase of volcanism,
characterized by high titanium content (Blewett et al., 1997; Elphic, 2002; Pieters, 1978) and high olivine con-
tent (Pieters, 1978; Staid et al., 2011; Staid & Pieters, 2001; Zhang et al., 2016). The Eratosthenian-aged mare
basalts in this area are also rich in iron, especially the Em3 and Em4 units. The Em1 and Em2 units are not as
high in TiO2 and FeO content as the early Late Eratosthenian Period aged Em3 and Em4 units. The spectra
from these units have band center positions shifted toward shorter wavelengths from Em3 to Em4
(Figure 10d), suggesting a slight change in the pyroxene compositions (decrease of calcium) of the eruptive
high-Ti mare basalts with time.
Em4 comprises the main member of the Eratosthenian mare units in the area. Rima Sharp is the longest sin-
uous rille on the Moon and feeds most of the lavas of Em4 from the north in Sinus Roris with the assistance of
Rima Mairan from the southeast (Whitford-Stark & Head, 1980). The Em4 lava flow boundaries are undetect-
able in WAC low solar illumination image data, although Eratosthenian-aged lava flow fronts can be readily
observed in Mare Imbrium (Chen et al., 2018; Wu et al., 2018). This observation suggests that the Em4 lava
flow unit thickness is too small to be recognized. Spectroscopic observations by M3 show that materials exca-
vated by craters with diameter greater than 900 m in the eastern maria (Em3 and Em4) are different from sur-
face materials associated with Em3 and Em4 and similar to the older western maria. This observation
indicates that the eastern Eratosthenian-aged mare units (Em3 and Em4) are superposed on the old western
Imbrian-aged mare units (Im1, Im2, and Im3). Thus, we estimated the thickness of the eastern mare basalt to
be less than 90 m using depth/diameter relationships (Pike, 1974). Further constraints on basalt thickness
were provided by crater penetrating measurements (Thomson et al., 2009), yielding a thickness of 50–
100 m for the young basalts (Em3 and Em4; Table 2), comparable to the 30–60 m estimated by Hiesinger
et al. (2002).
In summary, the Imbrian-aged and Eratosthenian-aged mare units in the study area have a significant varia-
tion in age, mineralogy, composition, and volume, which are interpreted to originate from different mantle
source regions or depths (Kato et al., 2017; Staid et al., 2011).
QIAN ET AL. 1421Journal of Geophysical Research: Planets 10.1029/2018JE005595
Table 2
Basalt Thickness of the Young Mare Units (Em3 and Em4) and Craters Used to Calculate the Thickness
No Latitude (°) Longitude (°) Diameter (km) Dt (km) Rbase (km) Hb (m)
1 40.9 50.8 6.1 5.1 5.0 228 (±105)
2 42.1 52.2 1.6 1.4 0.9 119 (±7)
3 40.3 52.8 4.3 3.6 4.4 78 (±78)
4 39.8 53.2 2.0 1.7 1.4 106 (±22)
5 42.6 54.1 1.7 1.4 1.7 50 (±39)
6 43.2 55.5 1.2 1.0 0.7 97 (±3)
7 42.1 55.6 1.8 1.5 1.0 137 (±5)
8 42.3 56.0 3.3 2.8 2.6 132 (±53)
Note. The method applied is described in Thomson et al. (2009). Dt is the transient crater diameter. Rbase is the radius of
ejecta. Hb is the basalt thickness obtained. The error comes from the measurement of Rbase.
4.1.2. Geological History
The sequence of geologic events in the area, including volcanic activity, tectonism (wrinkle ridge formation),
and impact cratering, are now summarized. A geologic map (Figure 13) was produced, and we interpret the
geological evolutionary history of the Rümker region as follows:
1. The Imbrium impact at 3.92 Ga ago generated a complex multiring system (Snape et al., 2016) and the
outer ring materials formed the Ith unit in the area (Scott & Eggleton, 1973; Spudis et al., 1988). Ejecta
Figure 13. Geologic map of the Rümker region in northern Oceanus Procellarum.
QIAN ET AL. 1422Journal of Geophysical Research: Planets 10.1029/2018JE005595
of the Iridum impact (3.84–3.7 Ga; Wagner et al., 2002) formed the lineated terrain in the north of Mons
Rümker before 3.71 Ga (Zhao et al., 2017).
2. The earliest detectable basaltic volcanism in the area erupted around 3.72 Ga ago (Hiesinger et al., 2003),
forming medium to high-titanium mare basalts belonging to the Repsold Formation (Whitford-Stark &
Head, 1980).
3. Basaltic volcanism was active from 3.71 to 3.51 Ga ago in Mons Rümker, forming plateau basalts IR1
(3.71 Ga), IR2 (3.58 Ga), and IR3 (3.51 Ga; Zhao et al., 2017).
4. Silica-rich domes (Idm) formed contemporaneously to, or a little earlier than, Mons Rümker by silica/felsite
volcanic activity (Glotch et al., 2010, 2011; Head & McCord, 1978; Head & Wilson, 2017; Ivanov et al., 2016;
Wilson & Head, 2003).
5. The major phase of basaltic volcanism occurred during the Late Imbrian Period, forming very low-Ti to
low-Ti mare basalts (Im1, 3.42 Ga; Im2, 3.39 Ga; Im3, 3.16 Ga).
6. NW-oriented wrinkle ridges in Oceanus Procellarum were tectonically generated around 3.35 Ga ago (Yue
et al., 2017).
7. The youngest phase of mare volcanism started at ~2.30 Ga ago and ceased at ~1.21 Ga ago, forming four
episodes of mare units (Em1, 2.30 Ga; Em2, 2.13 Ga; Em3, 1.51 Ga; Em4, 1.21 Ga). The youngest mare
volcanism (with elevated titanium content) formed the Em4 unit.
4.2. Potential Science Outcomes From Sample Return
Laboratory studies of lunar samples from Apollo and Luna missions (landing sites shown in Figures 1 and 2)
solved numerous fundamental scientific issues of selenology and heralded the beginning of a golden age of
lunar research that continues to this day (e.g., Hiesinger, 2006; Jaumann et al., 2012; Neal, 2009; Taylor, 2014;
Taylor et al., 2006). However, most of the Moon remains unexplored and there are still many unanswered
scientific questions (National Research Council, 2007) that remain to be addressed by returned samples
(e.g., Crawford et al., 2007, 2012; Crawford & Joy, 2014; Flahaut et al., 2012; Kring & Durda, 2012). China’s
CE5 lunar sample return mission to the Rümker region provides a great opportunity to solve some of the sig-
nificant outstanding questions of lunar science. Samples from each geologic unit in the area have specific
scientific importance, which should be ranked to maximize the science outcomes.
4.2.1. The Young Mare Units
On the Moon, the phase of mare basalt volcanism that records internal mantle evolution began (cryptomaria;
Whitten & Head, 2015) prior to the end of impact basin formation (Oriental basin, ~3.68 Ga; Whitten et al.,
2011) peaked between 3 and 4 Ga and subsequently declined with time, with only a few extrusive mare
basalt deposits, widely spaced in the last 50% of the lunar history (Head & Wilson, 2017; Hiesinger et al.,
2000, 2003, 2010, 2011; Morota et al., 2011). Where is the youngest mare basalt volcanism, what is its exact
radiometric age, and what does its mineralogy and geochemistry tell us about the lunar mantle in the last
half of lunar history?
Remote sensing data and counts of superposed impact craters on mare basalt units show that the youngest
mare basalts could be as young as 1.2 Ga (Hiesinger et al., 2003, 2011). The youngest mare basalts are con-
centrated in the northern Oceanus Procellarum region, centrally located in the PKT, characterized by elevated
abundances of radioactive heat-producing elements such as U, Th, and K (e.g., Haskin, 1998; Jolliff et al., 2000;
Prettyman et al., 2006).
One (P58, 1.33 Ga) of the five young mare units (others are P56, P57, P59, and P60) occurs in the Rümker
region (Hiesinger et al., 2003, 2011). P58 nearly corresponds with Em3 (1.51 Ga) and Em4 (1.21 Ga) in the cur-
rent study. These two mare units have extremely young model ages, especially Em4, which is one of the
youngest mare units on the Moon revealed by crater counting methods (Hiesinger et al., 2000, 2003, 2010,
2011; Morota et al., 2011). These high-Ti basalts (Em3 and Em4) are younger than any existing lunar samples,
including the youngest lunar meteorites (NWA032, 2.8 Ga; Fagan et al., 2002).
These factors led scientists to place the return of samples from these young mare basalt units as a top priority
for future lunar exploration (National Research Council, 2007). Analysis of these samples in Earth laboratories
will (1) provide exact radiometric dates for the extrusive events and thereby improve our knowledge of lunar
chronology, (2) provide new knowledge of the nature of the geochemistry and mineralogy of basaltic source
regions and their isotopic and trace element characteristics, (3) permit the testing of the role of the radioac-
tive PKT in the generation of late-stage mare volcanism, and (4) improve understanding of the thermal state
QIAN ET AL. 1423Journal of Geophysical Research: Planets 10.1029/2018JE005595
of the lunar interior in late lunar history, thereby testing and constraining models for the thermal evolution of
the Moon.
Finally, the ages of these young basalts are currently determined by impact CSFD of the craters superposed
on the units, calibrated by counts of craters on geologic units radiometrically dated in Earth laboratories from
samples collected by Apollo and Luna missions. However, no samples have currently been returned from
such young lunar units, and, thus, there is a high level of uncertainty in the size-frequency distribution ages
in the last half of lunar impact chronology (Crawford et al., 2007; Stöffler et al., 2006; Stöffler & Ryder, 2001).
Return of samples from these young basalts would thus serve to provide an absolute calibration for the
cratering flux, an accomplishment that will assist in our understanding of the geological evolution of plane-
tary bodies throughout the Solar System (Crawford et al., 2007; Kring & Durda, 2012; National Research
Council, 2007).
4.2.2. Other Geological Units
The Imbrian-aged mare basalts in the area are low-Ti (Im1) to very low-Ti (Im2 and Im3) and dominated by
intermediate composition pyroxene such as pigeonite. Samples from the Imbrian-aged mare basalts are simi-
lar in age (Imbrian-aged) and composition (very low-Ti to low Ti) to Apollo and Luna samples (Apollo 12 and
15 missions collected low-Ti basalts, and Apollo 17 and Luna 24 missions collected very low-Ti basalts).
Samples from these units can provide important ground truth to help evaluate the low-Ti and VLT basalt pet-
rogenesis models (Neal & Taylor, 1992) and reveal mantle source region properties (Snyder et al., 1992).
Steep-sided lunar domes and volcanic complexes have not been sampled in previous lunar missions.
Samples from the domes on Mons Rümker and the silica-rich East Dome can reveal the elemental and
mineral compositions of these surface materials, providing ground truth for remote sensing data/methods.
Geochemical analysis can constrain the nature of magma source regions and test the existing models and
mechanism of dome formation (Head & Wilson, 2017; Wilson & Head, 2003; Wilson & Head, 2017). Samples
from the silica-rich East Dome can reveal the nature of silica-rich volcanism on the Moon, the effects of
thorium concentration on red spot formation, and lead to further understanding of the late stage magmatic
evolution of the Moon (Glotch et al., 2010, 2011; Hagerty et al., 2006).
4.3. Proposed Sampling Sites
Comparing the potential science return of each of the geologic units, we suggest that the Em4 unit has the
richest scientific value and should be the top priority landing unit for the CE5 mission. Sampling anywhere in
the Em4 unit could return young mare materials and fulfill the desired scientific goals. Thus, we propose the
entire Em4 unit as a candidate from which to choose a specific landing site (proposed landing site A). Our
suggestion to land in the young mare unit is supported by Ling et al. (2017) and Jolliff et al. (2017).
Furthermore, sampling the regolith developed on the Em4 unit could readily return samples of the underly-
ing older materials (i.e., Imbrian-aged mare basalts) excavated by impacts. In addition, the secondary clusters
and crater rays in the area indicate that material in the soils is likely to contain admixed ejecta from distant
craters, such as Copernicus, Harpalus, and Pythagoras. Finally, ejecta from craters superposed on the exposed
kipukas in the Em4 unit may provide fragments from the underlying Imbrium basin ejecta unit. In contrast,
landing in the western maria is likely to return only the Imbrian-aged mare deposits and possible ejecta
and fragments (similar in age and composition to Apollo and Luna samples) that could also be sampled in
Em4 unit.
Mons Rümker and the silica-rich East Dome are also valuable sampling units of significant scientific interest.
We list these as the second and third priority landing sites for the CE5 mission and propose two landing sites
within each unit (proposed landing sites B and C). Proposed landing site B is at a steep-sided dome on Mons
Rümker (centered at 58.53°W, 41.41°N). This steep-sided dome is ~7.5 km in diameter. The top of this dome is
flat and may be suitable for landing (You can also read